This page describes how to use the Hotspot insights dashboard to detect hotspots in your Spanner database.
Hotspot insights overview
Hotspots cause latency in your Spanner database. The Hotspot insights dashboard helps you detect the splits affected by hotspots. Use the following steps to determine if hotspots are causing latency and if it is, how to resolve the issue:
- Open the dashboard.
- Determine whether hotspots needs your intervention.
- Identify problematic hot splits.
Hotspot insights is available in single-region, multi-region, and dual-region configurations.
Pricing
There is no additional cost for Hotspot insights.
Data retention
The maximum data retention for the Hotspot insights chart and table is 6 hours.
For the hottest splits table, data is taken from the
SPANNER_SYS.SPLIT_STATS_TOP_MINUTE table, which has a maximum retention
of 6 hours. For more information, see
Data retention.
Required roles
You might need different IAM roles and permissions, depending on whether you are an IAM user or a fine-grained access control user.
Identity and Access Management (IAM) user
To get the permissions that you need to view the Hotspot insights page, ask your administrator to grant you the following IAM roles on the instance:
-
Cloud Spanner Viewer (
roles/spanner.viewer) -
Cloud Spanner Database Reader (
roles/spanner.databaseReader)
The following permissions in the Cloud Spanner Database Reader (
roles/spanner.databaseReader) role are required to view the Hotspot insights page:
spanner.databases.beginReadOnlyTransactionspanner.databases.selectspanner.sessions.create
Fine-grained access control user
If you are a fine-grained access control user, ensure that you:
- Have the Cloud Spanner Viewer
(
roles/spanner.viewer) - Have fine-grained access control privileges and are granted the
spanner_sys_readersystem role or one of its member roles. - Select the
spanner_sys_readeror a member role as your current system role on the database Overview page.
For more information, see fine-grained access control overview and Fine-grained access control system roles.
Open the Hotspot insights dashboard
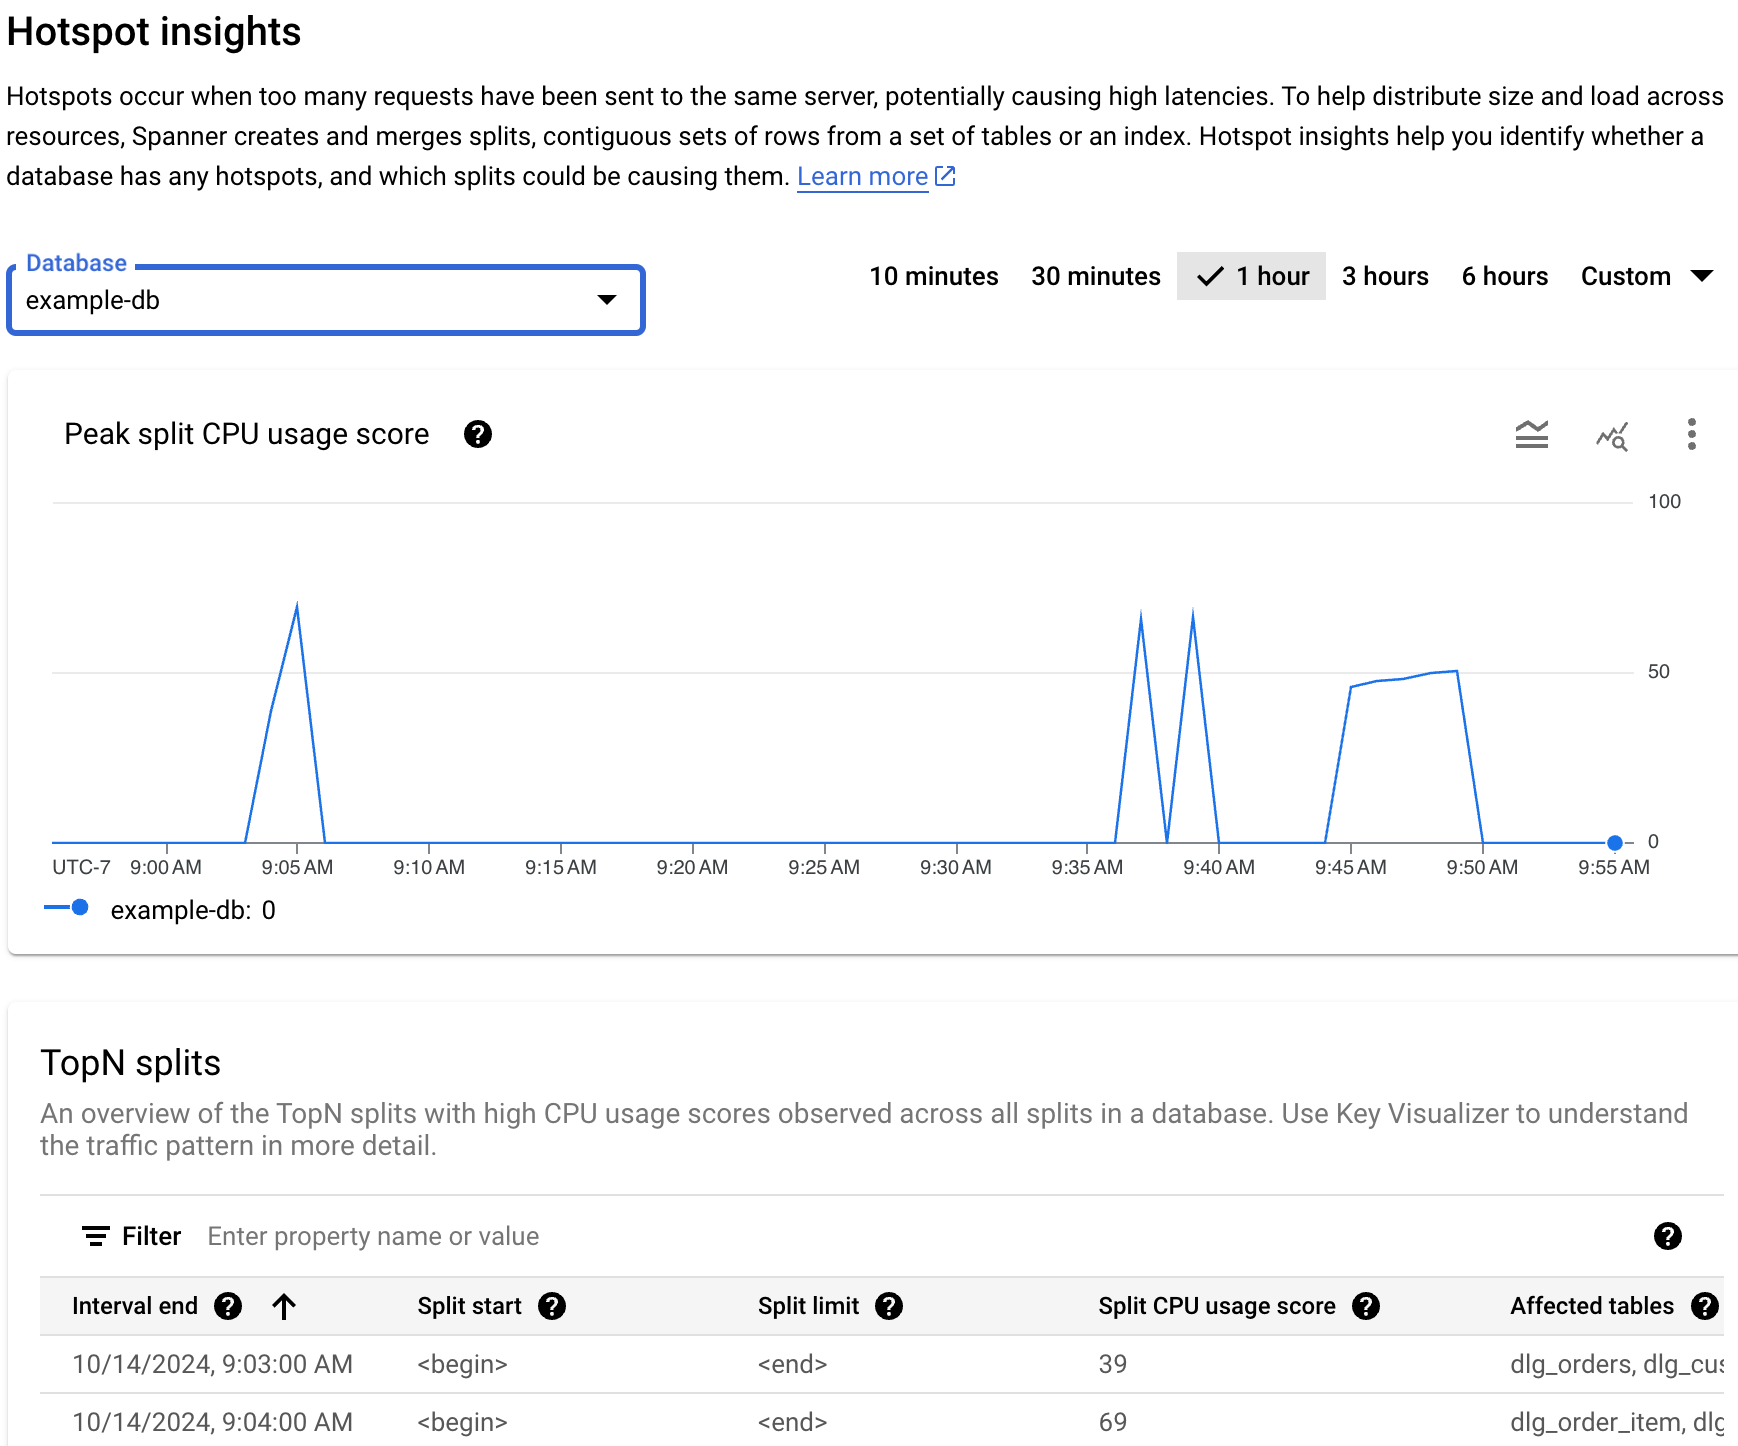
The Hotspot insights dashboard shows the peak split CPU usage percentage. This metric is an abstract percentage of 0 to 100 that reflects the amount of CPU used when rows within a split are accessed.
To view the Hotspot insights dashboard for a database, do the following:
In Google Cloud console, open the Spanner page.
Select an instance from the list.
In the navigation menu, click the Hotspot insights tab.
In the database field, select a database from the list. The dashboard shows the peak split CPU usage score for the database.
The areas of the dashboard include:
- Peak split CPU usage score graph: a higher CPU usage score (such as near 100) indicates that the split is hot and very likely causing a hotspot on the server compared to lower scores.
- Database field: filters the hot splits information on a specific database or all databases.
- Time range filter: filters the peak splits CPU usage by 1-minute increments up to a total of 6 hours.
- TopN splits table: displays the list of top splits sorted by split CPU usage scores.
Determine if hotspots need intervention
If you see a spike or an elevation in the graph that corresponds to the overall latency and a persistent high peak split CPU usage score, then you might need to investigate further.
Review the graph to explore these questions:
Which database is experiencing the latency degradation? Select different databases from the Databases list to find the databases with the highest latency. To find out which database has the highest load, you can also review the Latency chart for databases in the Google Cloud console.
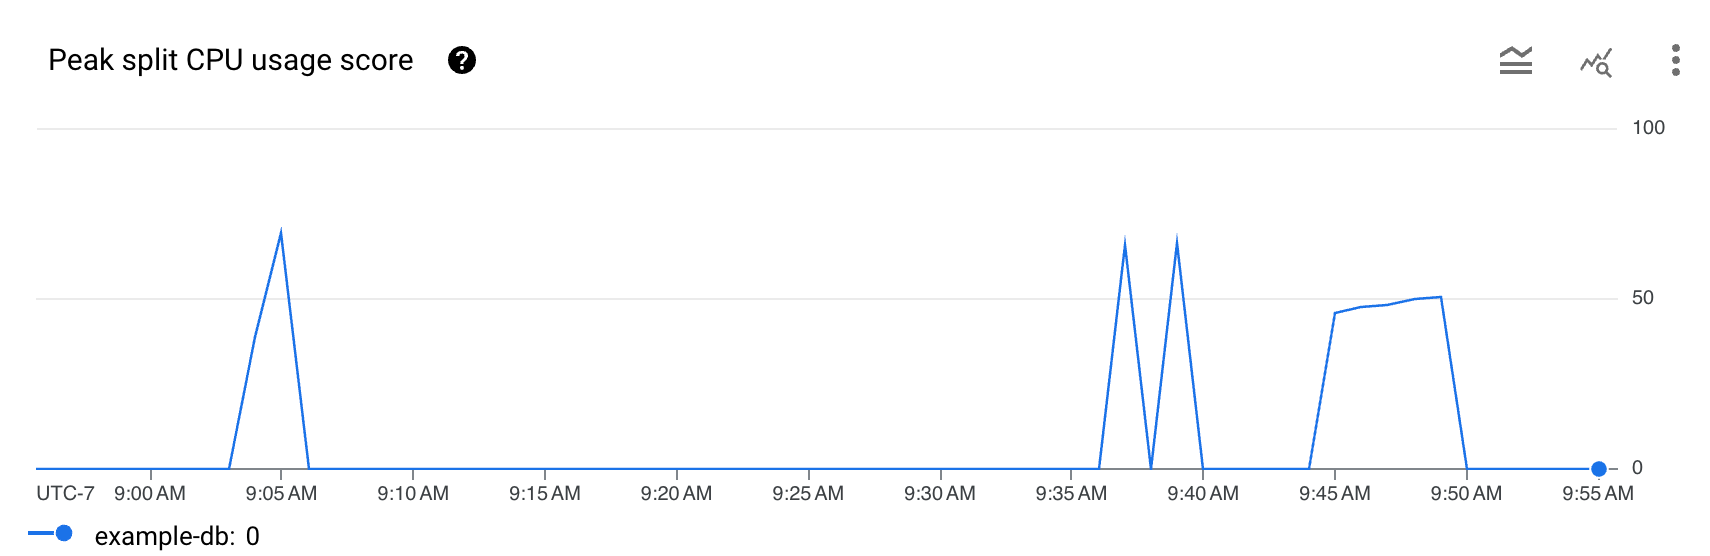
Is the latency high? Is the latency high as compared to the expected latency for the workload? Is the graph spiking or becoming more elevated over time? If you don't see high latency, then hotspots aren't a problem.
Is the high peak split CPU usage score at 100%? Is the graph spiking or becoming more elevated over time? If you don't see persistent 100% peak split CPU usage percentages for at least 10 minutes, then hotspots might not be a problem. If the peak split CPU usage percentage is high for longer than 10 minutes, then you might want to investigate further to see if the database has higher than expected latency levels.
If you see 100% peak split CPU usage percentages for longer than 10 minutes, then hotspots might need your intervention. Next, you can continue the debugging journey by identifying the hot splits in your database.
Identify problematic hot splits
To identify a potentially problematic split that has hotspots, see the TopN splits section in the Google Cloud console, as shown in the following.
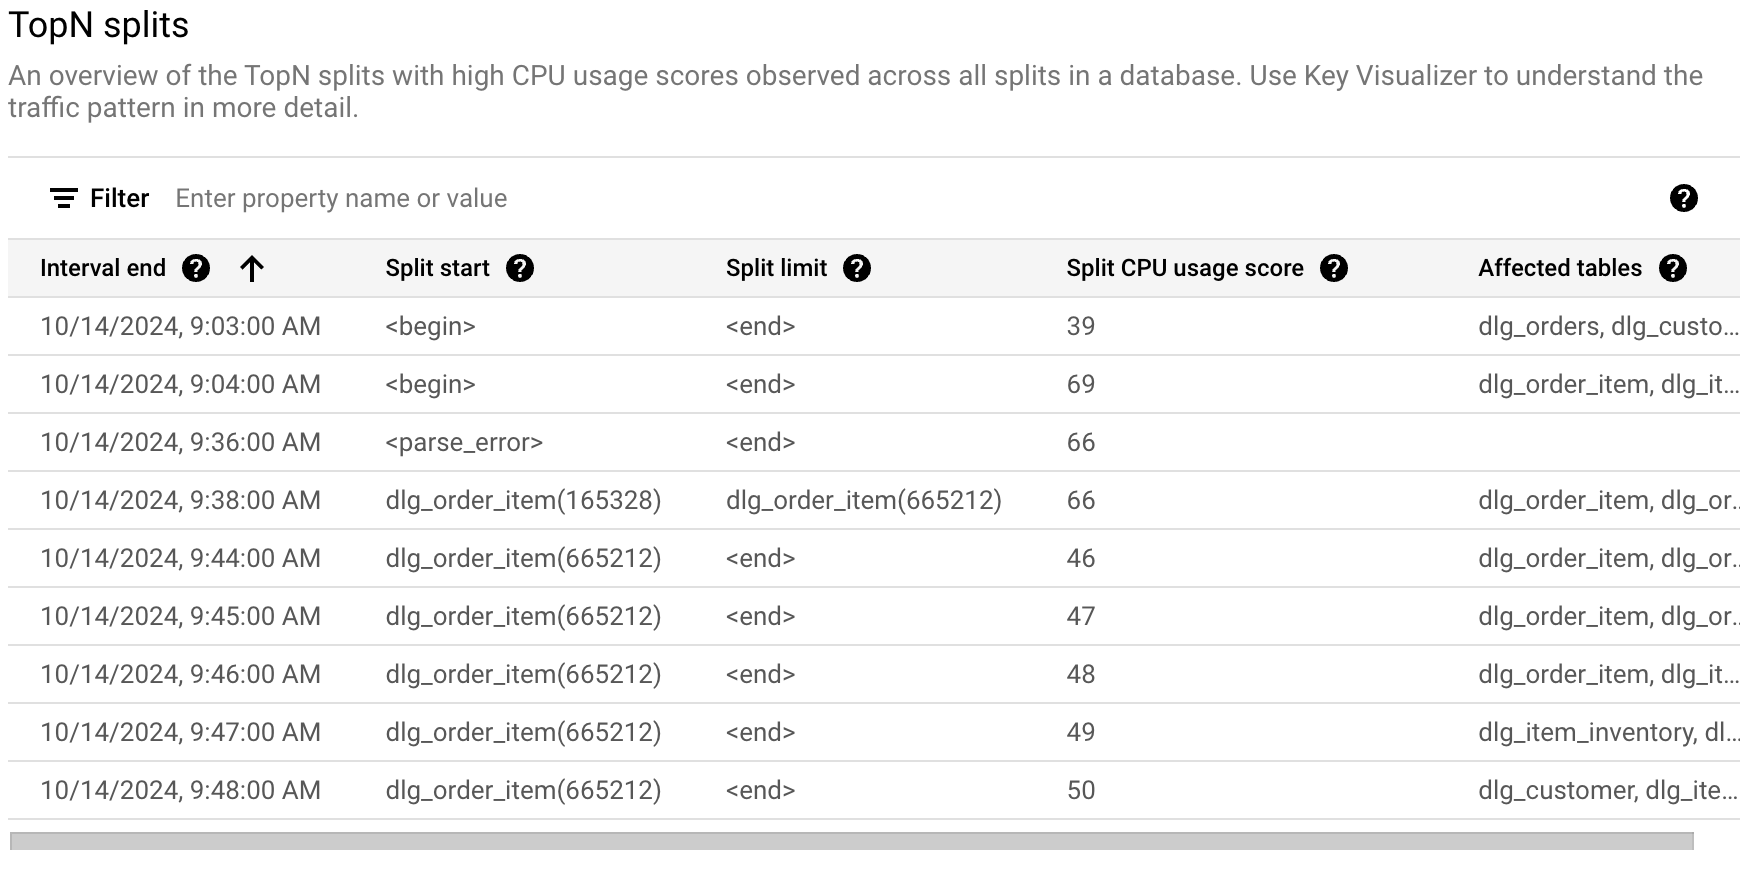
The TopN splits table provides an overview of the splits that might be hot during the chosen time window, sorted from latest to earliest. The number of TopN splits is limited to 100.
For the graphs, Spanner fetches data from the TopN splits statistics table, with a granularity of one minute. The value for each data point in the graphs represents the average value over an interval of one minute.
The table shows the following properties:
- Interval end: the date and time when the high peak CPU usage ends.
- Split start: the starting key of the range of rows in the split. If the split start is <begin>, it indicates the beginning of the key range of the database.
- Split limit: the limit key of the range of rows in the split. If the limit key is <end>, it indicates the end of the key range of the database.
- Split CPU usage score: an abstract score of between 0 and 100 that reflects the amount of CPU used by accesses to the rows within the split on a single server. Use the CPU usage score to help evaluate whether you have hotspots.
- Affected tables: the tables whose rows might be in the split.
What's next
- Learn about Split hotspot statistics