This document describes how Cloud Monitoring determines what time-series data your Google Cloud project can chart and monitor. If you only want to chart and monitor the time-series data collected by your Google Cloud project, then you don't need to perform any configuration. We recommend completing the Compute Engine quickstart. However, if you want to chart and monitor the time-series data collected by multiple Google Cloud projects, then some configuration is required. This document introduces the data model and best practices. For configuration information, see the documents listed in the What's next section.
Data model
This section introduces the concepts of a resource container, a metrics scope, and a scoping project.
- Resource container
- A resource container is a Google Cloud project. Resource containers store time-series data for the services and quota used by that container. The time-series data stored by a resource container includes a label that identifies the resource container. When viewing data stored in multiple resource containers, you can filter and group by that label.
- Metrics scope
- The metrics scope of a Google Cloud project defines the set resource containers whose time-series data the project can chart and monitor. By default, the metrics scope of a Google Cloud project only includes that project. Therefore, unless you configure the metrics scope, a Google Cloud project can only chart and monitor the time-series data it stores. You can use the Google Cloud console, the Google Cloud CLI, and the Cloud Monitoring API to modify the list of resource containers that are included in a metrics scope.
- Scoping project
- A scoping project hosts a metrics scope, and it stores the alerting policies, uptime checks, dashboards, synthetic monitors, and monitoring groups that you configure. Because every Google Cloud project hosts a metrics scope, every project is also a scoping project. When you use the Google Cloud console, the scoping project is the project selected by the Google Cloud console project picker.
Example metrics scope configuration
Assume that you have two projects, named Staging and Production,
that contain Compute Engine virtual machine (VM) instances. To view the
metrics for all of your VMs in a single view, you create
another project, AllEnvironments, and then add the Staging and Production
projects to the metrics scope of the project named AllEnvironments.
With this configuration, to create a chart that displays time-series data stored
in the Staging project, your first step is to open the Google Cloud console and
select a project with the Google Cloud console project picker:
If you select
AllEnvironments, then your chart can display time-series data stored by theStagingproject along with time-series data stored by theProductionandAllEnvironmentsprojects. To view time-series data that is stored by theStagingproject, you can add a filter.The dashed line in the following diagram shows the projects whose time-series data can be charted and monitored by the
AllEnvironmentsproject: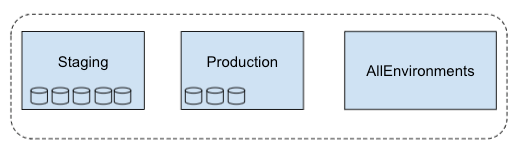
If you select
Staging, then your chart displays time-series data stored by theStagingproject.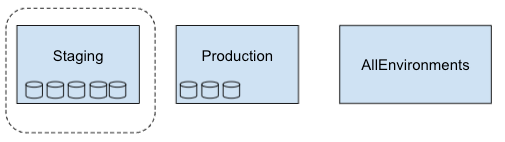
Best practices
When you want to chart or monitor time-series data stored in multiple resource containers, we recommend that you use a new Google Cloud project or one without resources as the scoping project, because these projects don't store any time-series data.
Consider a scenario where your scoping project contains resources such as VMs. To chart or monitor only the time-series data for the VMs in the scoping project, you must specify filters to exclude the time series from VMs stored in monitored resource containers. The requirement to use filters increases the complexity of configuring a chart and an alerting policy, and it increases the possibility of a configuration error.
Consider using multiple scoping projects to control which teams have access to the time-series data stored in your projects. The following table illustrates a possible configuration:
Scope A Scope B Scope C Scoping project scoping-project-A scoping-project-B scoping-project-C Monitored projects Project 1
Project 2Project 3
Project 4Project 1
Project 2
Project 3
Project 4
Project 5IAM-permissioned group
(example)Dev team A Dev team B SRE team
Grant access to Cloud Monitoring
To view the time-series data that can be charted or monitored by a project,
your Identity and Access Management (IAM) role on the
project must include all the permissions in the
Monitoring Viewer (roles/monitoring.viewer) role.
You don't need any other permissions.
For example, suppose the metrics scope of a scoping project
monitors three Google Cloud projects and that you have a role of
Monitoring Viewer on the scoping project. When you access the
scoping project by using the Google Cloud console,
you can view the time-series data stored in that project and the
time-series data stored in the other three Google Cloud projects.
To modify a metrics scope, your IAM roles on the
scoping project and on each resource container that you
want to add must include all permissions in the
Monitoring Admin (roles/monitoring.admin) role.
For more information, see Control access with Identity and Access Management.
Pricing
In general, Cloud Monitoring system metrics are free, and metrics from external systems, agents, or applications are not. Billable metrics are billed by either the number of bytes or the number of samples ingested.
For more information about Cloud Monitoring pricing, see the following documents:
What's next
- Configure a metrics scope for projects.
- Configure a metrics scope by using the Cloud Monitoring API.
- Collect metrics from AWS accounts.
- Quotas and limits.