Dialogflow CX 콘솔은 다양한 에이전트 요청 및 응답 데이터 통계를 보여주는 분석 패널을 제공합니다. 이 데이터는 에이전트가 프로덕션에서 어떻게 사용되고 있는지 평가하는 데 도움이 됩니다.
여러 데이터 뷰에서 선택하고 시간 범위로 필터링할 수 있습니다. 모든 차트에 표시되는 통계는 시간별로 계산됩니다.
분석 패널 열기
분석 패널을 열려면 다음 안내를 따르세요.
- Dialogflow CX 콘솔로 이동합니다.
- 프로젝트를 선택합니다.
- 에이전트를 선택합니다.
- 관리 탭을 선택합니다.
- 분석을 클릭합니다.
- 상단 근처에 있는 링크를 사용하여 새 애널리틱스에 액세스할 수도 있습니다.
일반적인 측정항목 정의
다음 측정항목이 여러 차트에 표시됩니다.
- 상호작용: 상호작용에는 직접 API 호출과 통합을 통한 간접 호출을 통한 인텐트 감지 요청 수가 포함됩니다.
- 세션: 세션은 상호작용에 제공된 세션 ID에 따라 결정됩니다. 이 측정항목을 사용할 수 있으려면 고유한 세션 ID를 만들어야 합니다. X축의 각 시간에서 세션 측정항목은 해당 시간 중의 활성 세션 수를 나타냅니다. 세션이 한 시간 경계를 벗어나면 활성 상태의 각 시간이 따로 계산됩니다. 따라서 차트에서 모든 시간별 세션 값의 합계는 전체 기간 중 실제 세션의 총 개수보다 클 수 있습니다.
개요 뷰
개요 뷰는 분석 패널 상단에 있습니다.
이 뷰에는 패널의 모든 콘텐츠에 적용되는 기간 및 시간대의 컨트롤이 있습니다.
다음 요약 측정항목도 표시됩니다.
- 사용량 (세션 수): 선택한 기간의 총 세션 수입니다.
- 참여도 (총 상호작용 수): 선택한 기간의 총 상호작용 수입니다.
- 경로 (평균 지속 시간(분)): 선택한 기간의 오디오 세션 평균 지속 시간
- 백엔드 (오류 코드 %): 선택한 기간 동안 확인 상태가 없는 상호작용의 비율입니다.
각 요약 측정항목에서 퍼센트 증가 또는 감소가 표시됩니다. 이 옵션은 선택한 기간 직전의 동일한 기간 이후의 측정항목 변경사항을 보여줍니다.
사용량 뷰
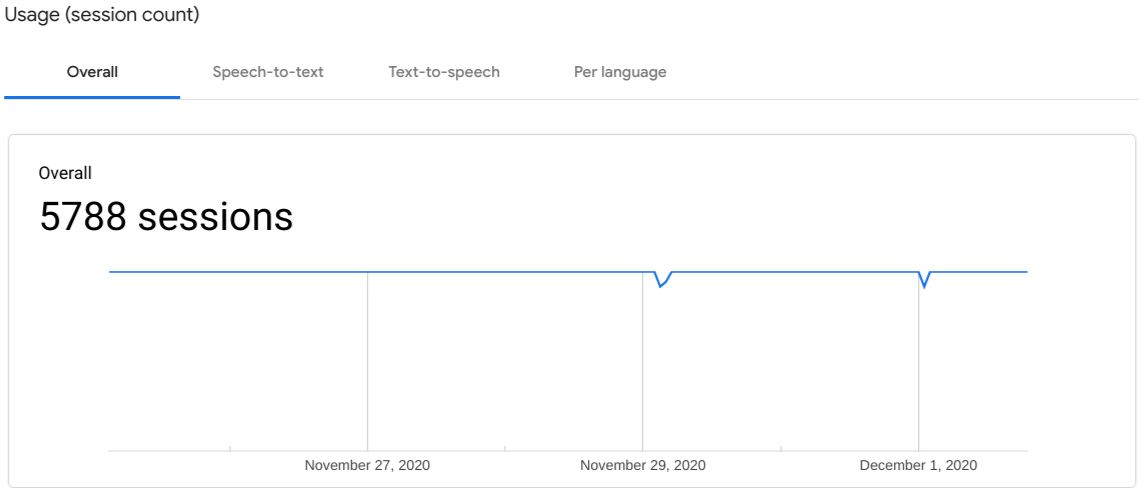
사용량 뷰에는 선택한 기간의 세션 수가 표시됩니다. 다음 탭을 선택하여 데이터를 필터링할 수 있습니다.
- 전체: 모든 세션을 표시합니다.
- 음성 텍스트 변환: 음성 텍스트 변환을 사용한 세션을 표시합니다.
- 텍스트 음성 변환: 텍스트 음성 변환이 사용된 세션을 표시합니다.
- 언어별: 언어별 세션을 차트화합니다.
참여 뷰
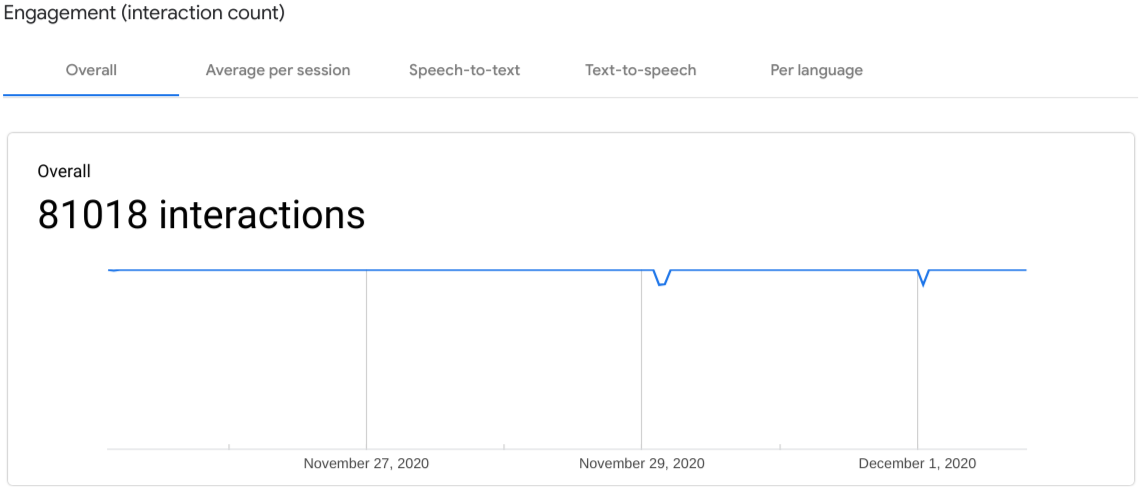
참여도 뷰에는 선택한 기간의 상호작용 횟수가 표시됩니다.
- 전체: 모든 상호작용을 표시합니다.
- 세션당 평균: 세션당 평균 상호작용 횟수를 표시합니다.
- 음성 텍스트 변환: 음성 텍스트 변환을 사용한 상호작용을 표시합니다.
- 텍스트 음성 변환: 텍스트 음성 변환을 사용한 상호작용을 표시합니다.
- 언어별: 언어별 상호작용을 차트화합니다.
뷰 이해하기
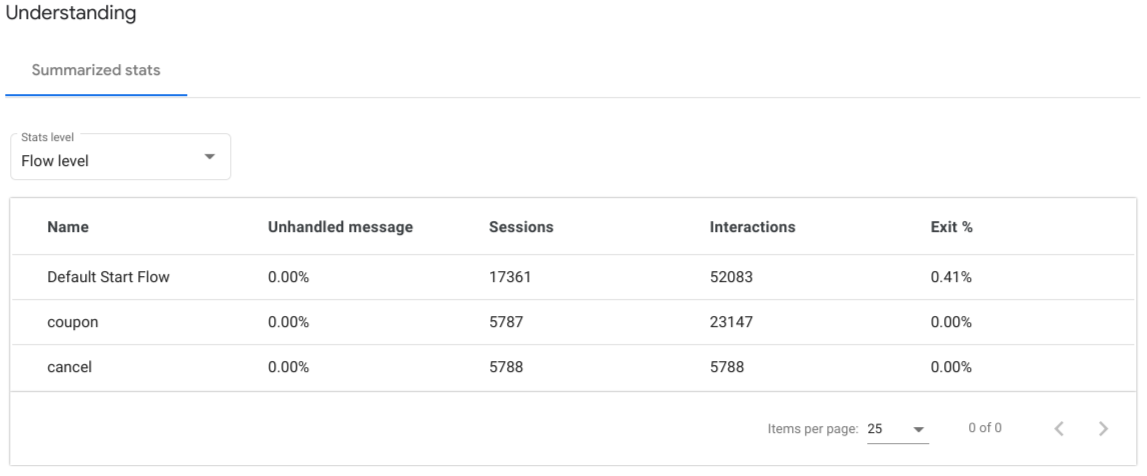
이해하기 뷰에는 인텐트, 페이지, 흐름 수준의 집계 측정항목이 표시됩니다. 수준이 드롭다운으로 선택됩니다.
- 처리되지 않은 메시지: 최종 사용자 입력이 범위 내에 있는 핸들러에 대한 어떤 인텐트와도 일치하지 않고 양식 매개변수를 충족하지 못한 비일치 상호작용 비율입니다.
- 세션: 선택한 수준의 세션 수입니다.
- 상호작용: 선택한 수준의 상호작용 수입니다.
- 종료 %: 선택한 기간 동안 흐름, 페이지 또는 인텐트 일치로 종료된 세션의 비율입니다.
경로 뷰
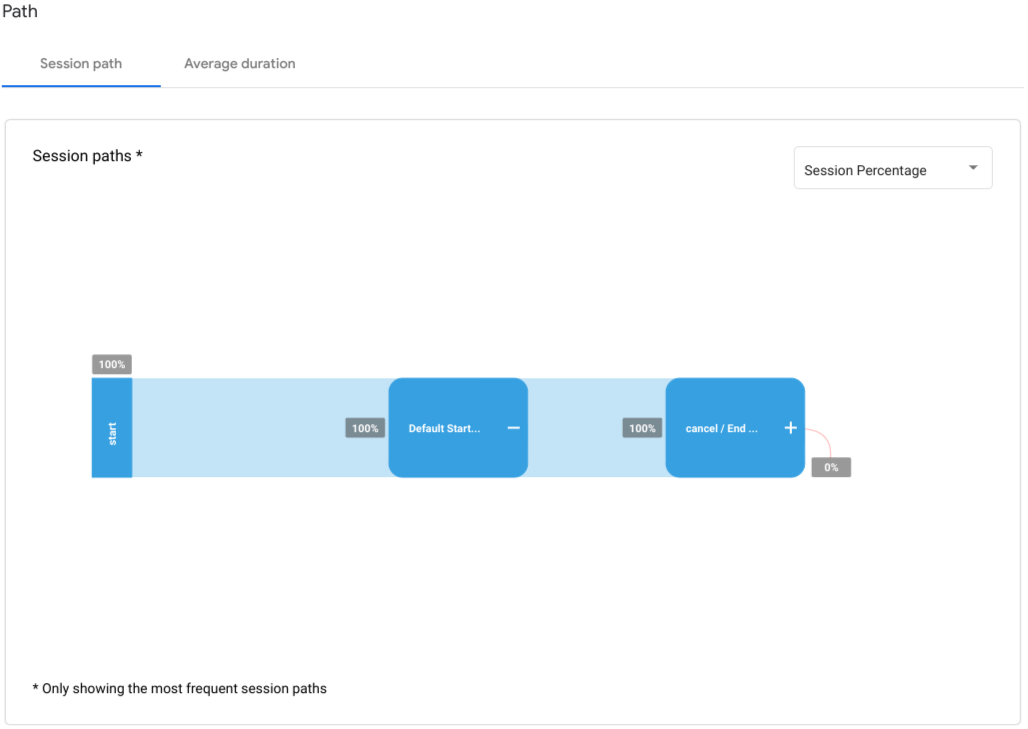
경로 보기의 세션 경로 탭은 페이지 경로 회선이 연결된 페이지 노드를 그래프화합니다. 이 그래프의 페이지 경로 줄은 에이전트에 대한 공통 세션에서 사용된 전체 경로에서 발견된 빈도를 보여줍니다. 하나의 페이지 노드가 여러 경로에서 일치하거나 단일 경로에서 여러 번 일치하는 경우는 여러 번 나타날 수 있습니다. 페이지 노드를 클릭하여 확장하면 이 차트와 상호작용할 수 있습니다.
페이지 노드 위로 마우스를 가져가면 페이지의 측정항목이 포함된 팝업이 표시됩니다.
- 이 경로 프리픽스 다음에 오는 세션: 페이지 노드까지의 경로를 따라간 세션의 수와 백분율입니다.
- 이 지점에서 종료: 페이지 노드까지의 경로에서 종료된 세션의 백분율입니다.
평균 지속 시간 탭에는 오디오 세션의 시간당 평균 시간이 표시됩니다.
백엔드 세션 수
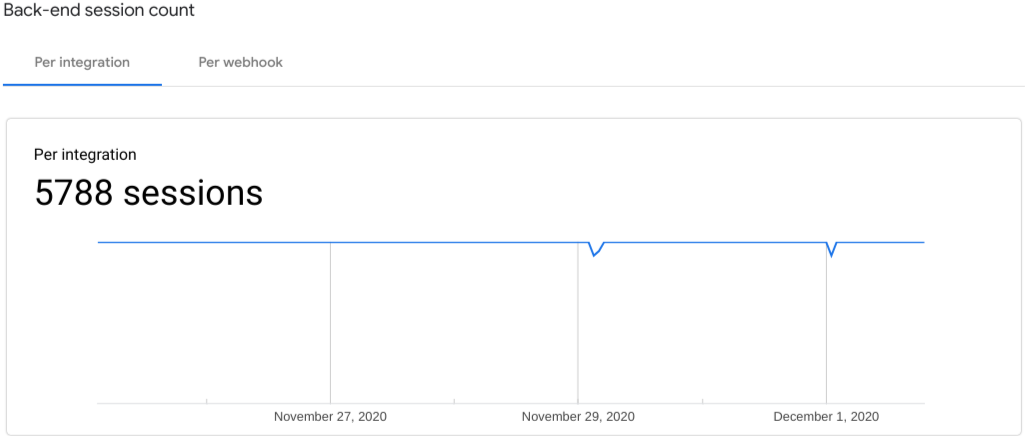
백엔드 세션 수 뷰에는 통합 및 웹훅별 세션이 표시됩니다.
백엔드 상호작용 수
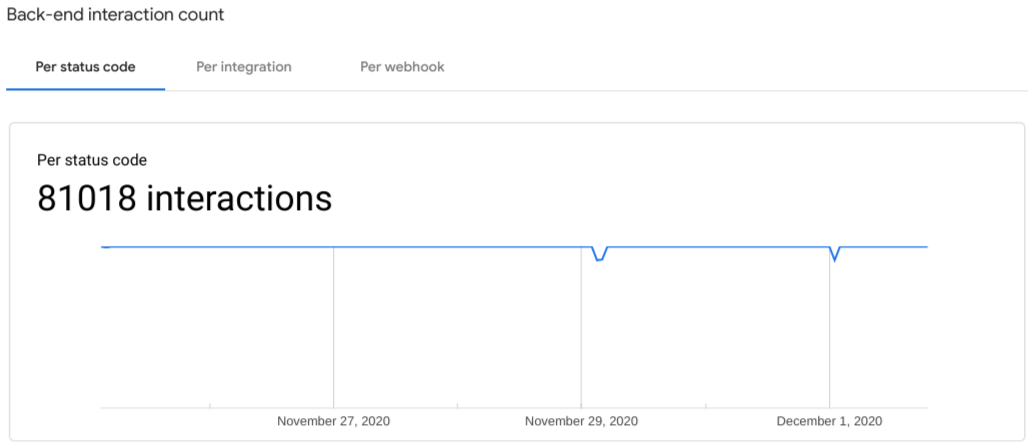
백엔드 상호작용 수 뷰에는 상태 코드, 상호작용, 웹훅별 상호작용이 표시됩니다.
제한사항
다음과 같은 제한사항이 적용됩니다.
- 애널리틱스에 데이터가 표시되는 데 최대 하루가 걸릴 수 있습니다.