Google Cloud Managed Service for Prometheus をデプロイすると、マネージド サービスに送信されたデータをクエリして、結果をグラフやダッシュボードに表示できます。
このドキュメントでは、クエリできるデータを決める指標スコープと、収集したデータを Cloud Monitoring で取得して使用する方法について説明します。
Managed Service for Prometheus のクエリ インターフェースはすべて、Cloud Monitoring API を使用して Monarch からデータを取得するように構成されています。ローカルの Prometheus サーバーからデータをクエリする代わりに Monarch をクエリすることにより、グローバルなモニタリングを大規模に実施できます。
始める前に
マネージド サービスをまだデプロイしていない場合は、マネージド コレクションまたはセルフデプロイ コレクションを設定します。PromQL を使用した Cloud Monitoring 指標のクエリのみに関心がある場合は、これをスキップできます。
クエリと指標のスコープ
クエリの対象となるデータは、データのクエリに使用する方法に関係なく、Cloud Monitoring 構成の指標スコープによって決まります。
Monitoring の指標スコープは読み取り専用のコンストラクトです。これを使用すると、複数の Google Cloud プロジェクトに属している指標データをクエリできます。すべての指標スコープは、スコープ対象プロジェクトと呼ばれる専用の Google Cloud プロジェクトによってホストされます。
デフォルトでは、プロジェクトは独自の指標スコープのスコープ対象プロジェクトであり、指標スコープにはそのプロジェクトの指標と構成が含まれます。スコープ対象プロジェクトは、指標スコープ内に複数のモニタリング対象プロジェクトを持つことができます。指標スコープ内のすべてのモニタリング対象プロジェクトの指標と構成は、そのスコープ対象プロジェクトに表示されます。1 つのモニタリング対象プロジェクトが複数の指標スコープに属している場合もあります。
スコープ対象プロジェクト内の指標をクエリし、そのスコープ対象プロジェクトがマルチプロジェクトの指標スコープをホストしている場合は、複数のプロジェクトからデータを取得できます。指標スコープにすべてのプロジェクトが含まれている場合、クエリとルールはグローバルに評価されます。
スコープ対象プロジェクトと指標スコープの詳細については、指標スコープをご覧ください。マルチプロジェクトの指標スコープを構成する方法については、複数のプロジェクトの指標を表示するをご覧ください。
Cloud Monitoring での Managed Service for Prometheus データ
Managed Service for Prometheus は、データ ストレージ バックエンドの Monarch を Cloud Monitoring と共有します。Cloud Monitoring で提供されるすべてのツールで、Managed Service for Prometheus から収集されたデータを使用できます。たとえば、Monitoring 用のGoogle Cloud コンソールで説明されているように、Metrics Explorer を使用できます。また、これらの指標に基づいてアラートを設定できます。Grafana ダッシュボードを Cloud Monitoring にインポートすることもできます。
Cloud Monitoring で Managed Service for Prometheus のデータなどの指標データを操作する場合は、Cloud Monitoring から提供される次のクエリツールを使用できます。
Cloud Monitoring での PromQL を使用したクエリ
Prometheus データをクエリする最も簡単な方法は、 Google Cloud コンソールで Cloud Monitoring の [Metrics Explorer] ページを使用することです。Prometheus データが正しく収集されていることを確認するには、次のようにします。
-
Google Cloud コンソールで [leaderboard Metrics Explorer] ページに移動します。
検索バーを使用してこのページを検索する場合は、小見出しが [Monitoring] の結果を選択します。
クエリビルダー ペインのツールバーで、[codeMQL] または [codePROMQL] という名前のボタンを選択します。
[言語] で [PromQL] が選択されていることを確認します。言語切り替えボタンは、クエリの書式設定と同じツールバーにあります。
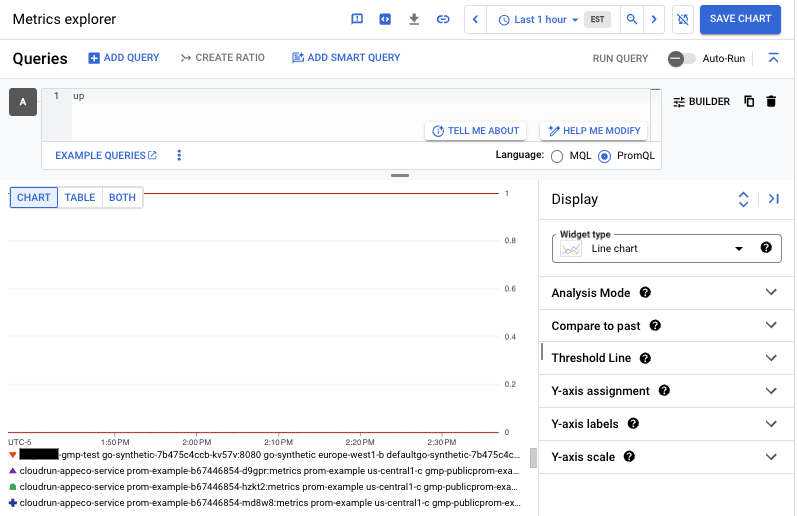
エディタに次のクエリを入力し、[クエリを実行] をクリックします。
up
データが取り込まれている場合、次のようなグラフが表示されます。
PromQL を使用して Cloud Monitoring システム指標をクエリする方法については、Cloud Monitoring 指標の PromQL をご覧ください。
Metrics Explorer グラフと Cloud Monitoring グラフでの PromQL の使用方法については、Cloud Monitoring での PromQL をご覧ください。
Cloud Monitoring のその他のクエリ オプション
Prometheus のデータを Cloud Monitoring の時系列として表示し、グラフやダッシュボードを作成する場合、メニュードリブン インターフェースまたは MQL を使用できます。Metrics Explorer でのシンプルなクエリの例を次に示します。
-
Google Cloud コンソールで [leaderboard Metrics Explorer] ページに移動します。
検索バーを使用してこのページを検索する場合は、小見出しが [Monitoring] の結果を選択します。
グラフに表示するデータを指定します。前述の [PromQL] ボタンだけでなく、メニュードリブンのインターフェースも使用できます。クエリを作成するには、次の操作を行います。
クエリビルダー ペインで、[指標を選択] をクリックします。
検索フィールドに「up/」と入力してリストをフィルタします。つづいて、[Prometheus Target] を選択して [Up] を選択し、[Prometheus/up/gauge] を選択します。
[適用] をクリックします。
このクエリの結果のグラフには、PromQL の例に示されているグラフと同じデータが表示されます。
メニュードリブンのインターフェースを使用して作成したクエリは、[PromQL] ボタンを選択することで PromQL に変換できます。この変換では、ヒストグラム関数やその他の一般的でない演算子が正しく変換されない可能性があります。
prometheus_target リソース
Cloud Monitoring では、モニタリング対象リソースタイプの時系列データが書き込まれます。Prometheus 指標の場合、モニタリング対象リソースタイプは prometheus_target です。PromQL で記述されていない Prometheus 指標のモニタリング クエリでは、このリソースタイプを指定する必要があります。
prometheus_target リソースには次のラベルがあります。これは、クエリ対象データのフィルタリングと操作に使用できます。
project_id: このリソースに関連付けられた Google Cloud プロジェクトの ID。location: データが保存される物理的な場所(Google Cloud リージョン)。通常、この値は GKE クラスタまたは Compute Engine インスタンスのリージョンです。データが AWS またはオンプレミス デプロイメントから収集される場合、その値は最も近い Google Cloud のリージョンになる可能性があります。cluster: GKE クラスタまたは関連するコンセプト。空の場合もあります。namespace: GKE 名前空間または関連するコンセプト。空の場合もあります。job: Prometheus ターゲットのジョブラベル(既知の場合)。ルール評価の結果で空の場合もあります。instance: Prometheus ターゲットのインスタンス ラベル(既知の場合)。ルール評価の結果で空の場合もあります。
これらのラベルの値は収集時に設定されます。