To monitor a service, you need at least one service-level objective (SLO). The SLOs encapsulate your performance goals for the service. Every SLO is based on a performance metric, called a service-level indicator (SLI). For background information on SLIs and SLOs, see Concepts in service monitoring.
You can create up to 500 SLOs for a service.
Before you begin
To get the permissions that
you need to view and create SLOs,
ask your administrator to grant you the
Monitoring Editor (roles/monitoring.editor).
IAM role on your project.
For more information about granting roles, see Manage access to projects, folders, and organizations.
You might also be able to get the required permissions through custom roles or other predefined roles.
Getting started
To define an SLO, navigate to the Create a Service Level Objective (SLO) pane.
-
In the Google Cloud console, go to the
 SLOs page:
If you use the search bar to find this page, then select the result whose subheading is Monitoring.
Open the Create a Service Level Objective (SLO) pane:
For a new service:
- Click Define service, and then define your service.
- After you click Submit in the Define service pane, click Create SLO.
For an existing service:
- In the Services list, click the name of the service in the Services list.
- On the Service details page, click Create SLO.
The SLO-creation pane leads you through the steps to create an SLO. The remainder of this document describes each of the following steps in the SLO-creation process:
- Set the SLI.
- Define SLI details.
- Set the SLO.
- Review and save the SLO.
To advance to the next step, click Continue. You can click a previous step to make changes before you save the SLO. To exit the SLO-creation process, click Cancel.
Setting your SLI
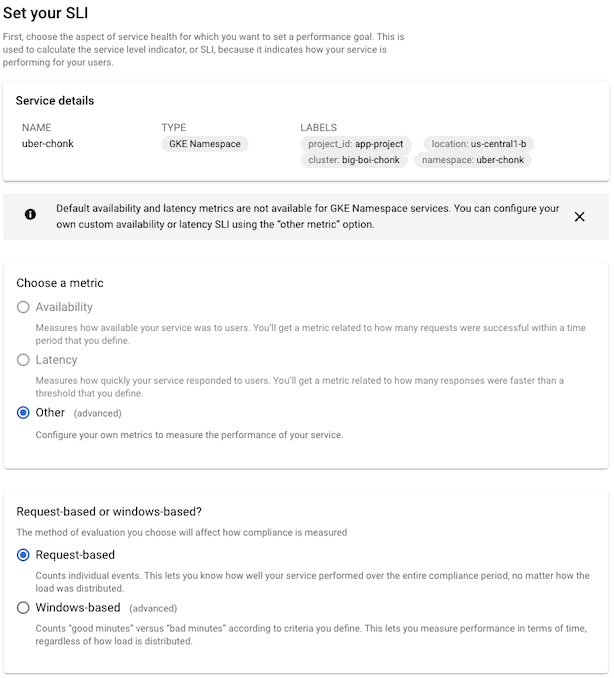
The Set your SLI pane has the following sub-panes:
Service details, which reports identifying information about your service. This is the same as the Service details pane on the dashboard for the service.
Choose a metric, where you choose a metric for the performance you want to monitor.
Request-based or windows-based?, where you choose how the metric is to be evaluated.
The following screenshot shows the SLI pane:
For more information about metrics used in SLIs and the evaluation methods, see the conceptual topic Service-level indicators.
Choosing a metric
The SLI metric specifies the type of performance you want to measure. In the SLI, you build a ratio from the metric to measure good performance over time. You have the following options for SLIs:
- Availability, which measures how available your service is to users.
- Latency, which measures how responsive your service is to users.
- Other, which lets you indicate that you want to use a specific metric. You specify the metric and describe how to build the SLI on the Set SLI details pane.
The valid choices depend on the type of service you are configuring.
For services on Cloud Service Mesh, Istio on Google Kubernetes Engine, and App Engine, you can choose any of the options. The availability and latency metrics are already known for these services, or you choose Other to use a custom SLI.
For GKE-based services, and for custom services, the only choice is Other. Prometheus metrics are not included in default availability and latency SLOs, and other meaningful availability or latency metrics aren't known in advance for these services.
If you configured collection of Prometheus metrics using Google Cloud Managed Service for Prometheus, you can set a collected Prometheus metric as a custom SLI.
Choosing the evaluation method
After you select the metric for your SLI, you specify how the metric should be evaluated.
Request-based evaluation measures the number of requests that meet the evaluation criterion against the total number of requests in a given period.
Windows-based evaluation measures the number of evaluation periods that meet a goodness criterion against the total number of evaluation periods.
For both evaluation methods, you specify the evaluation criteria on the Set SLI details page.
For more information on these evaluation types, see Compliance in request- and windows-based SLOs.
Setting SLI details
The contents of the Define SLI details pane depends on the metric and evaluation method you chose in the previous step.
If you chose the availability metric and request-based evaluation, there are no other details needed.
Windows-based evaluation
If you selected window-based evaluation, you set the additional criteria for the window on this pane: a goodness criterion and a duration.
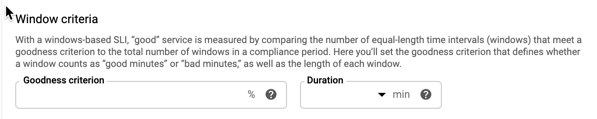
The goodness criterion indicates the percentage of windows that must evaluate to “good” over the compliance period. The duration specifies the length of the window.
Latency metric
If you chose the latency metric, you specify the threshold value that determines acceptable performance on this pane:
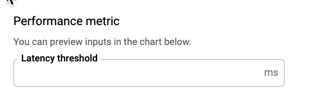
Anything above the latency threshold is considered “bad” performance in evaluating the SLI.
Custom SLI
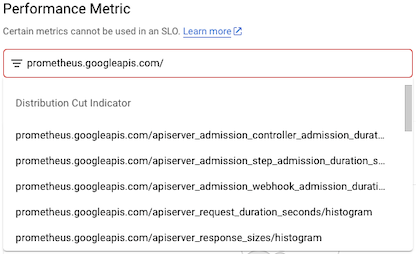
If you selected Other as the SLI metric, you specify the metric you want to use on this pane. You can select a metric by typing in the Performance Metric field or select one from the list.
The metrics in the list are divided into two types:
- Distribution-cut indicators
- Time-series ratio indicators
If you are collecting Prometheus metrics with Google Cloud Managed Service for Prometheus, the
metric name starts with prometheus.googleapis.com/.
The following screenshot shows a partial list:
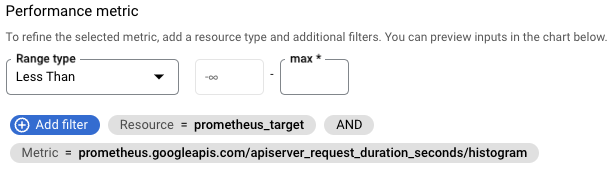
If you select a distribution-cut indicator, you configure the SLI by providing a range—above, below, or between—and a filter to specify the monitored resource and any labels you want to include. The configuration pane looks like the following:
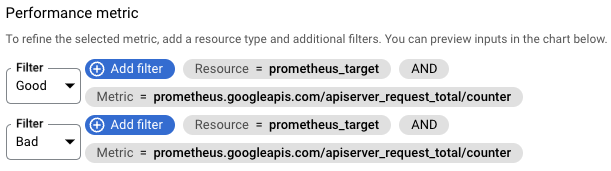
If you select a time-series ratio indicator, you configure the ratio by building numerator and denominator filters to classify the metric data, typically by selecting the values of labels in the metric or resource type. The configuration pane looks like the following:
For more information about these SLI types, see the Monitoring API
reference pages for DistributionCut and TimeSeriesRatio.
GKE control plane metrics
GKE control plane metrics are useful indicators of system health that you can use for custom SLIs. You must enable collection of these metrics before you can use them. These metrics are collected by Google Cloud Managed Service for Prometheus.
- Use [API server metrics][gke-api-metrics] to track API server load, the fraction of API server requests that return errors, and the response latency for requests received by the API server.
- Use scheduler metrics to help you to proactively respond to scheduling issues when there aren't enough resources for pending Pods.
For more information about control plane metrics and using them to monitor system health, see Use control plane metrics.
Preview chart
After you have configured the SLI, the Define SLI details pane includes a preview chart to show you how the historical performance of this service is measured by the SLI. For example:
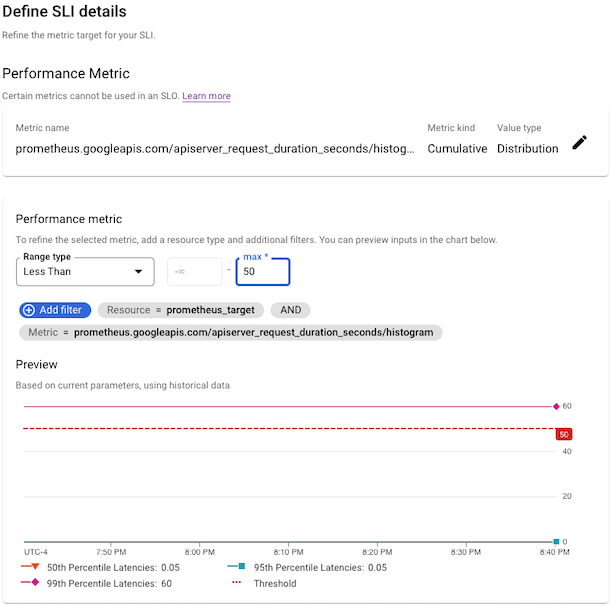
If you have just created or deployed a service, there may not be any data yet. You can still create the SLI, but you won't get the historical perspective.
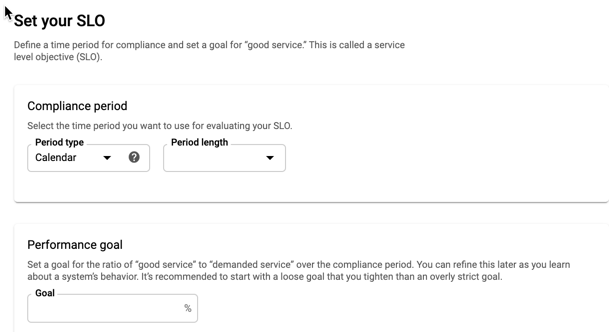
Setting your SLO
The Set your SLO pane has the following regions:
Compliance period, where you set the time period over which you want to evaluate the SLI.
Performance goal, where you specify the threshold for performance over the compliance period.
Preview, which displays a chart that shows the performance-goal threshold and graph that shows the results of evaluating the SLI over the compliance period.
Compliance period
There are two types of compliance period, which you select from the menu:
- Calendar period
- Rolling window
A calendar period measures compliance over a fixed period of time, the period length. When the period ends, the error budget is reset and a new compliance period starts.
A rolling window is a sliding period. It also has a length, but the compliance is computed over the last n days. When a new day starts, the compliance and remaining error budget are recomputed over the previous n days.
For more on calendar and rolling-window compliance periods, see Compliance periods.
Preview chart
After you have configured the SLO, the Set your SLO pane includes a preview chart to show you how the historical performance of this service is measured by the SLO. For example:
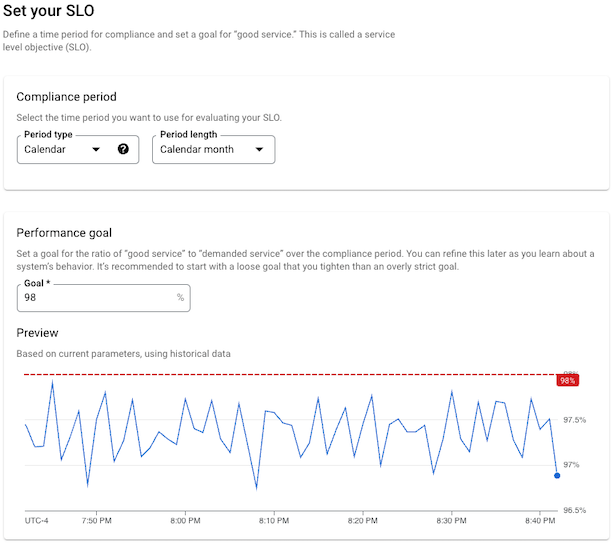
If you have just created or deployed a service, there may not be any data yet. You can still create the SLO, but you won't get the historical perspective.
Saving your SLO
The Review and save pane has a single field, a display name for the SLO. The field has a default value based on the selections you made while defining the SLO, but you can change it to make the display name more descriptive.
The pane also provides a preview of your SLO in JSON format. The JSON block
summarizes your SLO and can be copied for use with the
serviceLevelObjectives.create method.
If you change any of the SLO values, the JSON preview is updated automatically.
The following screenshot shows the field with a default name:
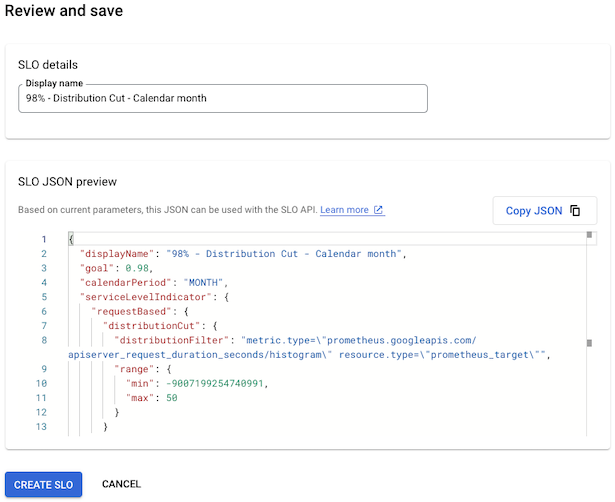
When you are satisfied with the display name, click Create SLO.
What's next
After you create an SLO, you can do the following:
Monitor the performance of your service relative to the SLO by creating an alerting policy. For more information, see Alerting on your burn rate and Creating an alerting policy.
View the status of all the SLOs for a set of services by creating a custom dashboard in Cloud Monitoring that displays SLO charts. For more information, see Create a custom dashboard and Display SLOs on a dashboard.