本頁說明如何使用 Cloud Monitoring 和 Spanner 稽核記錄,監控及分析 Spanner Data Boost 使用情形。
Cloud Monitoring 可追蹤一段時間內的總用量,並依使用者細分用量。Spanner 稽核記錄可提供更彈性的用量分析,包括依使用者或 BigQuery 工作 ID 提供指標。
使用 Cloud Monitoring 追蹤 Data Boost 使用情形
如要追蹤整體 Data Boost 使用情況,請按照下列步驟操作:
- 前往 Google Cloud 控制台的「Monitoring」。
前往「Monitoring」頁面 - 如果導覽選單中顯示「指標探索器」,請選取該選項。 否則,請按一下「資源」,然後選取「指標探索器」。
- 選取頁面頂端的時間間隔。
- 在「指標」下拉式清單的「按資源或指標名稱篩選」欄位中,輸入
spanner並按下Enter縮小搜尋範圍。 在「指標」清單中,依序選取「Cloud Spanner 執行個體」>「執行個體」>「處理單元秒數」,然後按一下「套用」。
系統會建立折線圖,顯示所有 Spanner 執行個體的 Data Boost 總用量。
如要查看特定執行個體的用量,請按照下列步驟操作:
- 使用「篩選器」欄位新增篩選器,例如執行個體 ID。
- 按一下「+」即可新增其他屬性。
如要查看所有執行個體的用量明細,請按照下列步驟操作:
- 如要清除篩選器,請按一下篩選器欄位旁的「X」X圖示。
- 在「Aggregation」(匯總) 運算子下拉式清單中,選取「Sum」(總和),然後依 instance_id 選取。
如要依主體細分用量,請在「Aggregation」(匯總) 運算子下拉式選單中選取「Sum」(總和),然後選取「credential_id」(憑證 ID)。
使用稽核記錄分析 Data Boost 使用情況
Spanner 稽核記錄可讓您更彈性地分析 Data Boost 使用情況。除了可依執行個體或主體細分一段時間內的使用量 (如同 Cloud Monitoring),如果啟用並提供 Spanner 稽核記錄,還可依資料庫或 BigQuery 工作 ID 細分一段時間內的使用量。
啟用稽核記錄可能會產生額外費用。如要瞭解 Logging 定價,請參閱「Google Cloud Observability 定價:Cloud Logging」一文。
啟用 Data Boost 用量稽核記錄
您必須先啟用 Spanner 的資料存取稽核記錄,才能收集 Data Boost 的用量資料。請按照以下步驟操作:
- 按照「透過 Google Cloud 控制台設定資料存取稽核記錄」一文的說明操作。
- 為 Spanner API 服務啟用「資料讀取」記錄類型。
- 如要依 BigQuery 工作 SQL 文字取得 Data Boost 使用量,請務必啟用 BigQuery 的稽核記錄。
依主體查看用量
如要查詢稽核記錄,查看各使用者的 Data Boost 使用情形,請按照下列步驟操作:
前往 Google Cloud 控制台的「Logs Explorer」。
在導覽選單中,按一下「記錄分析」。
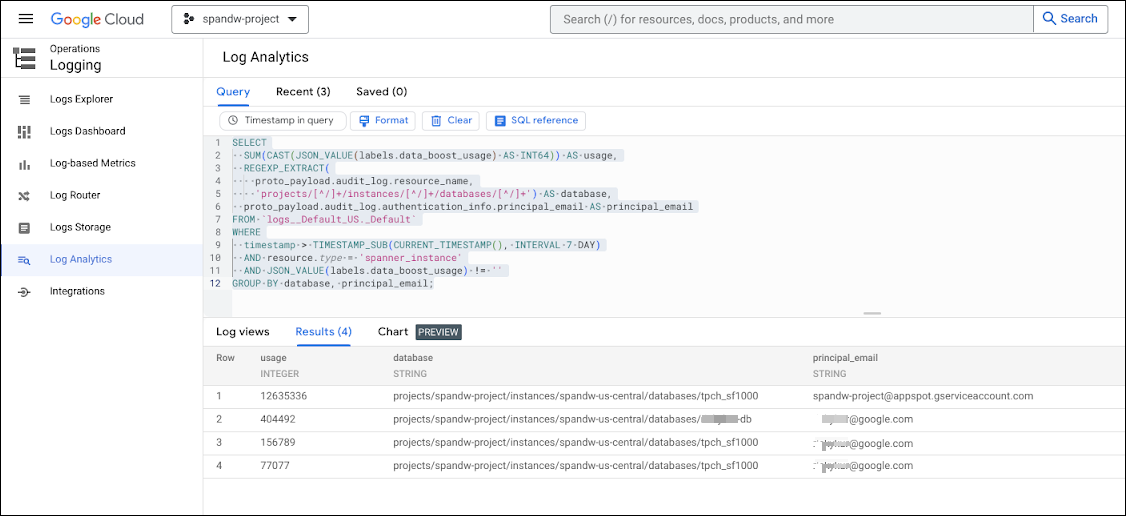
如要顯示過去 7 天內的使用者和資料庫用量,請執行下列查詢。如要變更顯示用量的時間範圍,請修改
WHERE子句中的timestamp運算式。SELECT SUM(CAST(JSON_VALUE(labels.data_boost_usage) AS INT64)) AS usage, REGEXP_EXTRACT( proto_payload.audit_log.resource_name, 'projects/[^/]+/instances/[^/]+/databases/[^/]+') AS database, proto_payload.audit_log.authentication_info.principal_email AS principal_email FROM `PROJECT_NAME.global._Default._AllLogs` WHERE timestamp > TIMESTAMP_SUB(CURRENT_TIMESTAMP(), INTERVAL 7 DAY) AND resource.type = 'spanner_instance' AND operation.last IS NULL AND JSON_VALUE(labels.data_boost_usage) != '' GROUP BY database, principal_email;將
PROJECT_NAME替換為您的專案名稱。
以下範例顯示 4 位主體的處理單元用量。
依 BigQuery 工作 ID 查看用量
如要查詢稽核記錄,查看依資料庫、使用者和 BigQuery 工作 ID 細分的 Data Boost 用量,請按照下列步驟操作:
前往 Google Cloud 控制台的「Logs Explorer」。
在導覽選單中,按一下「記錄分析」。
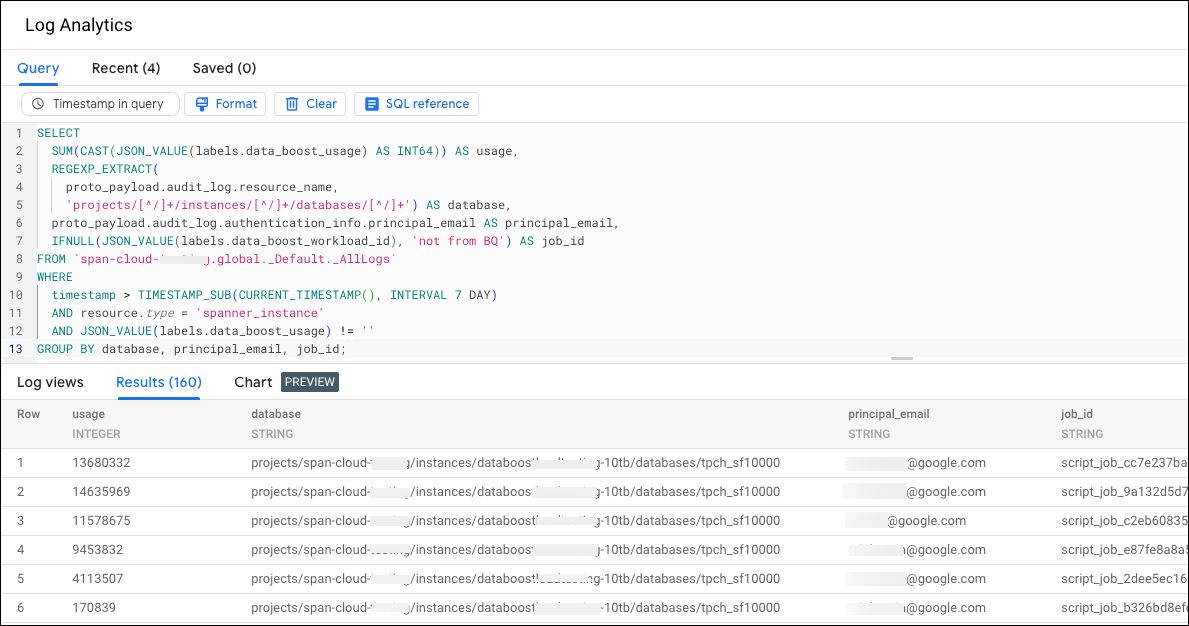
執行以下查詢:
SELECT
  SUM(CAST(JSON_VALUE(labels.data_boost_usage) AS INT64)) AS usage,
  REGEXP_EXTRACT(
    proto_payload.audit_log.resource_name,
    'projects/[^/]+/instances/[^/]+/databases/[^/]+') AS database,
  proto_payload.audit_log.authentication_info.principal_email AS principal_email,
  IFNULL(JSON_VALUE(labels.data_boost_workload_id), 'not from BQ') AS job_id
FROM `PROJECT_NAME.global._Default._AllLogs`
WHERE
  timestamp > TIMESTAMP_SUB(CURRENT_TIMESTAMP(), INTERVAL 7 DAY)
  AND resource.type = 'spanner_instance' AND operation.last IS NULL
  AND JSON_VALUE(labels.data_boost_usage) != ''
GROUP BY database, principal_email, job_id;
將
PROJECT_NAME替換為您的專案名稱。
以下範例顯示依 BigQuery 工作 ID 的用量。
依 BigQuery SQL 文字查看用量
如要查看多項 BigQuery 工作 (依這些工作的 SQL 文字彙整) 的 Data Boost 用量,請按照下列步驟操作:
前往 Google Cloud 控制台的「Logs Explorer」。
在導覽選單中,按一下「記錄分析」。
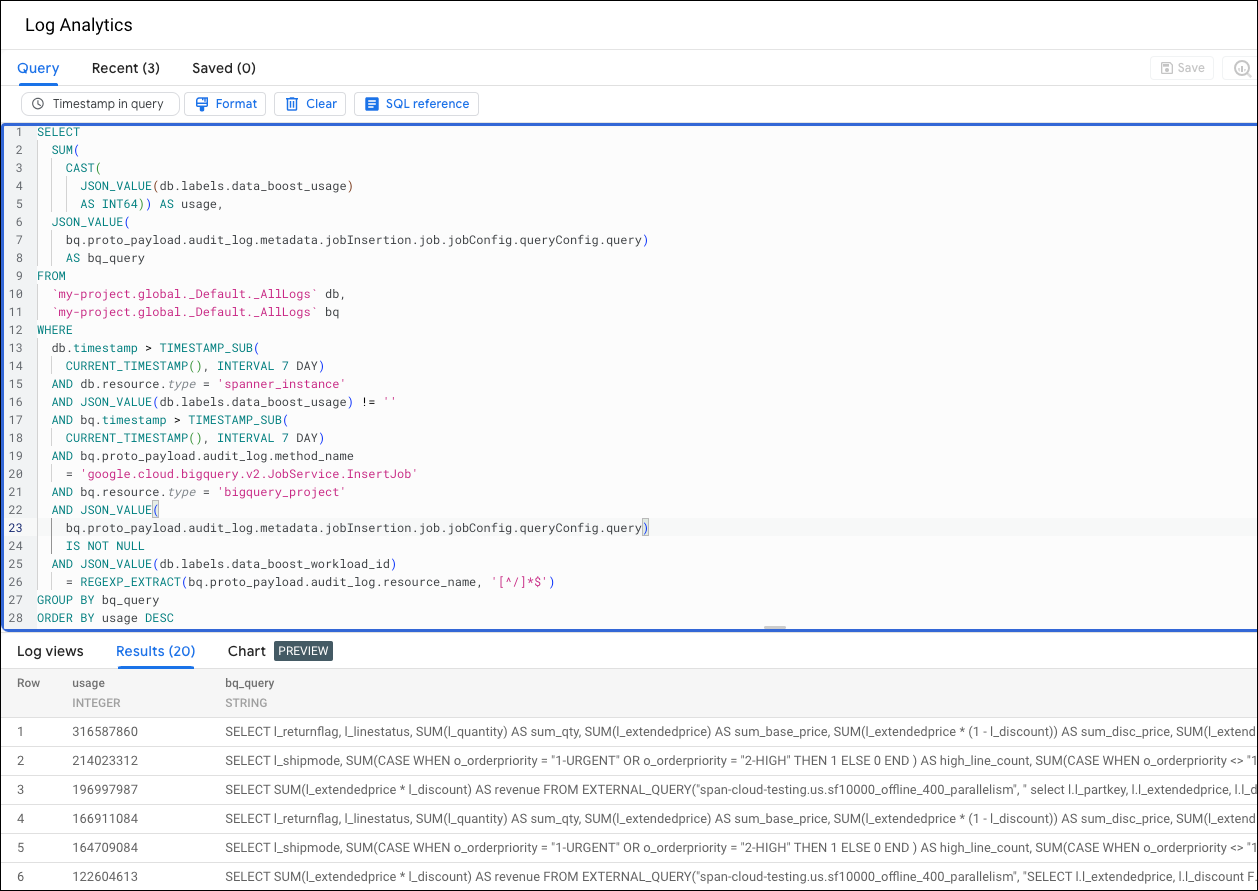
執行以下查詢:
SELECT
  SUM(
    CAST(
      JSON_VALUE(db.labels.data_boost_usage)
      AS INT64)) AS usage,
  JSON_VALUE(
    bq.proto_payload.audit_log.metadata.jobInsertion.job.jobConfig.queryConfig.query)
    AS bq_query
FROM
  `PROJECT_NAME.global._Default._AllLogs` db,
  `PROJECT_NAME.global._Default._AllLogs` bq
WHERE
  db.timestamp > TIMESTAMP_SUB(
    CURRENT_TIMESTAMP(), INTERVAL 7 DAY)
  AND db.resource.type = 'spanner_instance'
  AND JSON_VALUE(db.labels.data_boost_usage) != ''
  AND db.operation.last IS NULL
  AND bq.timestamp > TIMESTAMP_SUB(
    CURRENT_TIMESTAMP(), INTERVAL 7 DAY)
  AND bq.proto_payload.audit_log.method_name
    = 'google.cloud.bigquery.v2.JobService.InsertJob'
  AND bq.resource.type = 'bigquery_project'
  AND JSON_VALUE(
    bq.proto_payload.audit_log.metadata.jobInsertion.job.jobConfig.queryConfig.query)
    IS NOT NULL
  AND JSON_VALUE(db.labels.data_boost_workload_id)
    = REGEXP_EXTRACT(bq.proto_payload.audit_log.resource_name, '[^/]*$')
GROUP BY bq_query
ORDER BY usage DESC
將
PROJECT_NAME替換為您的專案名稱。
以下範例顯示 SQL 文字的 Data Boost 用量。
建立 Data Boost 警報
如要建立快訊,在 Data Boost 用量超過預先定義的門檻時發出通知,請參閱「設定 Data Boost 用量快訊」。
後續步驟
- 請參閱「Data Boost 總覽」一文,瞭解 Data Boost。