이 페이지에서는 Cloud Monitoring 및 Spanner 감사 로그를 사용하여 Spanner Data Boost 사용량을 모니터링하고 분석하는 방법을 설명합니다.
Cloud Monitoring은 시간 경과에 따른 총 사용량을 추적하고 사용량을 사용자별로 분류하는 기능을 제공합니다. Spanner 감사 로그를 사용하면 사용자 또는 BigQuery 작업 ID별로 측정항목을 제공하는 등 사용량을 더욱 유연하게 분석할 수 있습니다.
Cloud Monitoring을 사용하여 Data Boost 사용량 추적
전체 Data Boost 사용량을 추적하려면 다음 단계를 따르세요.
- Google Cloud 콘솔에서 Monitoring으로 이동합니다.
Monitoring으로 이동 - 측정항목 탐색기가 탐색 메뉴에 표시되었으면 이를 선택합니다. 아니면 리소스를 클릭한 다음 측정항목 탐색기를 선택합니다.
- 페이지 상단에서 시간 간격을 선택합니다.
- 측정항목 드롭다운 목록의 리소스 또는 측정항목 이름으로 필터링 필드에
spanner를 입력하고Enter를 눌러 검색 범위를 좁힙니다. 측정항목 선택 목록에서 Cloud Spanner 인스턴스 > 인스턴스 > 처리 단위 초를 선택한 후 적용을 클릭합니다.
이렇게 하면 모든 Spanner 인스턴스의 합산 Data Boost 사용량 선 차트가 생성됩니다.
특정 인스턴스의 사용량을 보려면 다음 단계를 따릅니다.
- 필터 필드를 사용하여 인스턴스 ID와 같은 필터를 추가합니다.
- +를 클릭하여 다른 속성을 추가합니다.
모든 인스턴스별 사용량 분류를 보려면 다음 단계를 따르세요.
- 필터 필드 옆에 있는 X 아이콘을 클릭하여 필터를 지웁니다.
- 집계 연산자 드롭다운 목록에서 합계를 선택한 다음 instance_id를 기준으로 선택합니다.
주 구성원별로 사용량을 분류하려면 집계 연산자 드롭다운에서 Sum을 선택한 다음 credential_id를 선택합니다.
감사 로그를 사용하여 Data Boost 사용량 분석
Spanner 감사 로그를 사용하면 Data Boost 사용량을 더욱 유연하게 분석할 수 있습니다. Cloud Monitoring에서와 같이 인스턴스 또는 주 구성원별로 시간 경과에 따른 사용량을 분류하는 기능 외에도 Spanner 감사 로그가 사용 설정되어 있어 사용할 수 있는 경우 Spanner 감사 로그에서 데이터베이스 또는 BigQuery 작업 ID별로 시간 경과에 따른 사용량을 분류할 수 있습니다.
감사 로그를 사용 설정하면 추가 요금이 발생할 수 있습니다. Logging 가격 책정에 대한 자세한 내용은 Google Cloud Observability 가격 책정: Cloud Logging을 참조하세요.
Data Boost 사용량 감사 로그 사용 설정
Data Boost의 사용량 데이터를 수집하려면 먼저 Spanner에 대한 데이터 액세스 감사 로그를 사용 설정해야 합니다. 단계는 다음과 같습니다.
- Google Cloud 콘솔을 사용하여 데이터 액세스 감사 로그 구성의 안내를 따릅니다.
- Spanner API 서비스에 데이터 읽기 로그 유형을 사용 설정합니다.
- BigQuery 작업 SQL 텍스트별 Data Boost 사용량을 가져오려면 BigQuery의 감사 로그도 사용 설정되어 있어야 합니다.
주 구성원별 사용량 보기
사용자별 Data Boost 사용량을 확인하기 위해 감사 로그를 쿼리하려면 다음 단계를 따르세요.
Google Cloud Console에서 로그 탐색기로 이동합니다.
탐색 메뉴에서 로그 애널리틱스를 클릭합니다.
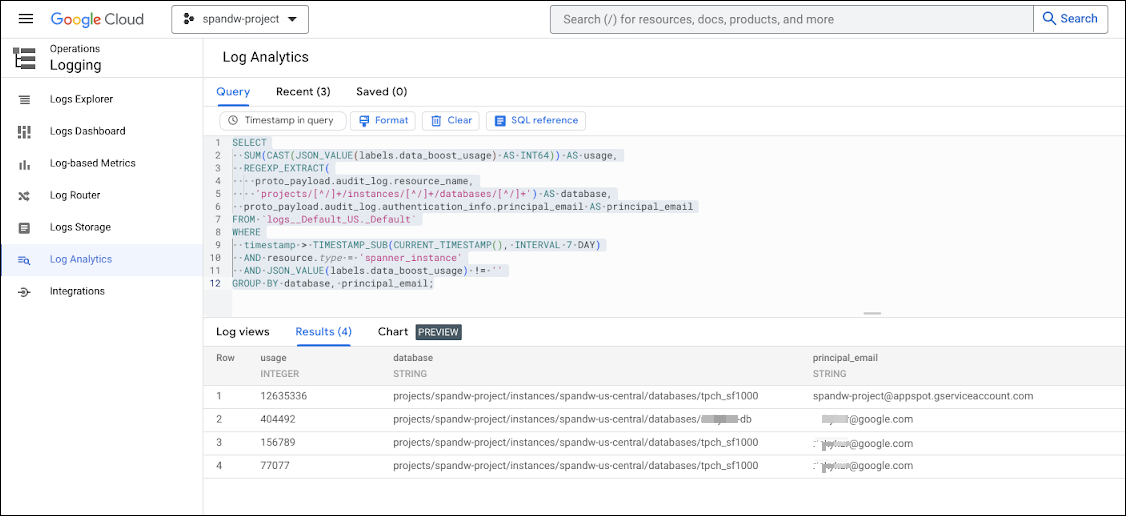
지난 7일 동안의 사용자 및 데이터베이스별 사용량을 표시하려면 다음 쿼리를 실행합니다. 사용량이 표시되는 기간을 변경하려면
WHERE절에서timestamp표현식을 수정합니다.SELECT SUM(CAST(JSON_VALUE(labels.data_boost_usage) AS INT64)) AS usage, REGEXP_EXTRACT( proto_payload.audit_log.resource_name, 'projects/[^/]+/instances/[^/]+/databases/[^/]+') AS database, proto_payload.audit_log.authentication_info.principal_email AS principal_email FROM `PROJECT_NAME.global._Default._AllLogs` WHERE timestamp > TIMESTAMP_SUB(CURRENT_TIMESTAMP(), INTERVAL 7 DAY) AND resource.type = 'spanner_instance' AND operation.last IS NULL AND JSON_VALUE(labels.data_boost_usage) != '' GROUP BY database, principal_email;PROJECT_NAME을 프로젝트 이름으로 바꿉니다.
다음 예시에서는 주 구성원 4명의 처리 단위 사용량을 보여줍니다.
BigQuery 작업 ID별 사용량 보기
데이터베이스, 사용자, BigQuery 작업 ID로 분류된 Data Boost 사용량을 확인하기 위해 감사 로그를 쿼리하려면 다음 단계를 따르세요.
Google Cloud Console에서 로그 탐색기로 이동합니다.
탐색 메뉴에서 로그 애널리틱스를 클릭합니다.
다음 쿼리를 실행합니다.
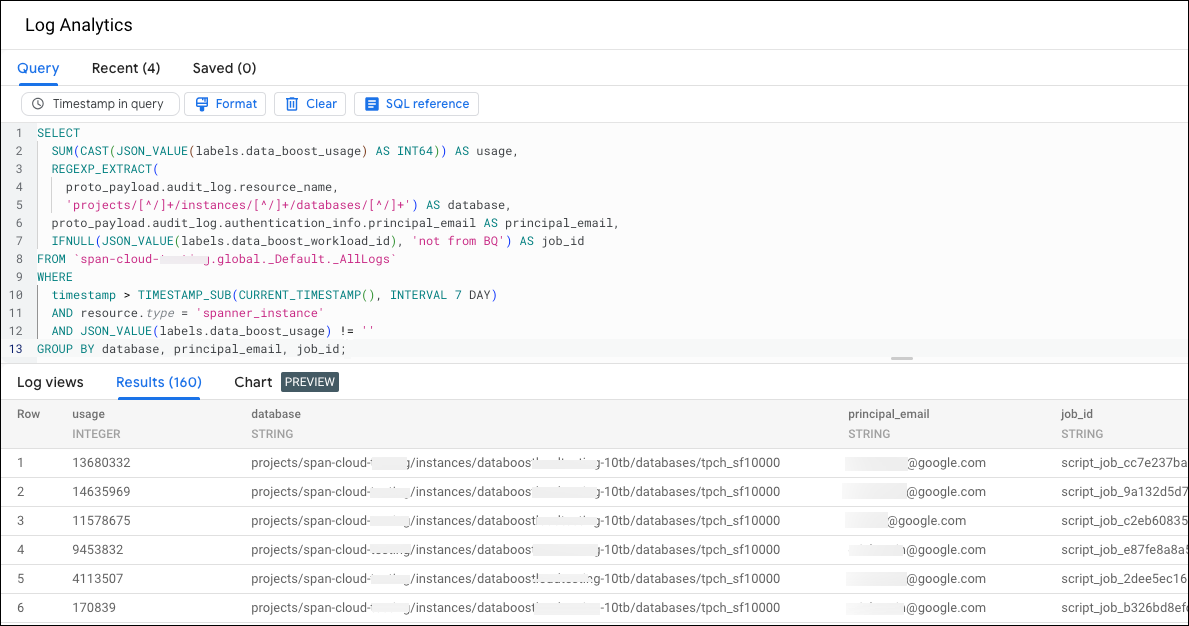
SELECT SUM(CAST(JSON_VALUE(labels.data_boost_usage) AS INT64)) AS usage, REGEXP_EXTRACT( proto_payload.audit_log.resource_name, 'projects/[^/]+/instances/[^/]+/databases/[^/]+') AS database, proto_payload.audit_log.authentication_info.principal_email AS principal_email, IFNULL(JSON_VALUE(labels.data_boost_workload_id), 'not from BQ') AS job_id FROM `PROJECT_NAME.global._Default._AllLogs` WHERE timestamp > TIMESTAMP_SUB(CURRENT_TIMESTAMP(), INTERVAL 7 DAY) AND resource.type = 'spanner_instance' AND operation.last IS NULL AND JSON_VALUE(labels.data_boost_usage) != '' GROUP BY database, principal_email, job_id;PROJECT_NAME을 프로젝트 이름으로 바꿉니다.
다음 예시는 BigQuery 작업 ID별 사용량을 보여줍니다.
BigQuery SQL 텍스트별 사용량 보기
여러 BigQuery 작업의 SQL 텍스트로 집계된 해당 BigQuery 작업의 Data Boost 사용량을 보려면 다음 단계를 따르세요.
Google Cloud Console에서 로그 탐색기로 이동합니다.
탐색 메뉴에서 로그 애널리틱스를 클릭합니다.
다음 쿼리를 실행합니다.
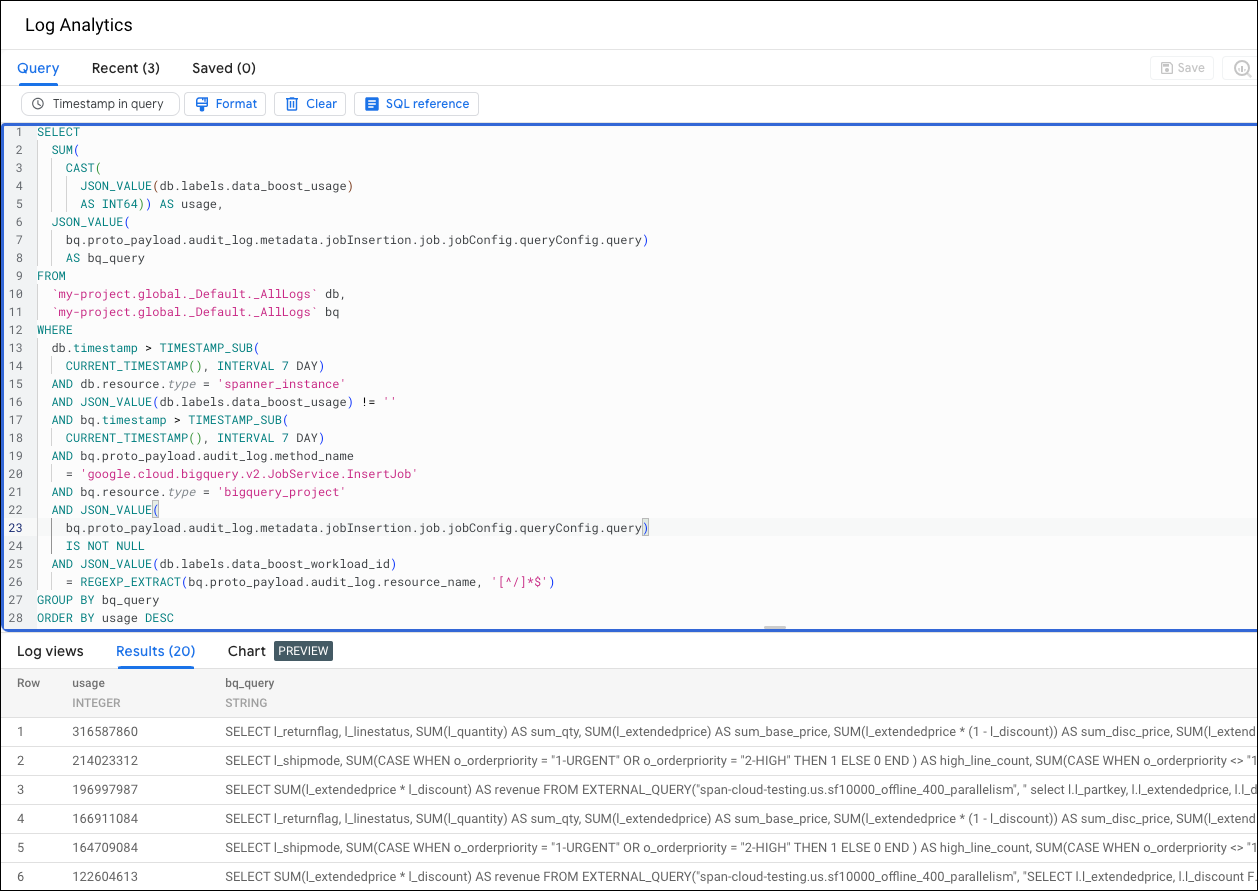
SELECT SUM( CAST( JSON_VALUE(db.labels.data_boost_usage) AS INT64)) AS usage, JSON_VALUE( bq.proto_payload.audit_log.metadata.jobInsertion.job.jobConfig.queryConfig.query) AS bq_query FROM `PROJECT_NAME.global._Default._AllLogs` db, `PROJECT_NAME.global._Default._AllLogs` bq WHERE db.timestamp > TIMESTAMP_SUB( CURRENT_TIMESTAMP(), INTERVAL 7 DAY) AND db.resource.type = 'spanner_instance' AND JSON_VALUE(db.labels.data_boost_usage) != '' AND db.operation.last IS NULL AND bq.timestamp > TIMESTAMP_SUB( CURRENT_TIMESTAMP(), INTERVAL 7 DAY) AND bq.proto_payload.audit_log.method_name = 'google.cloud.bigquery.v2.JobService.InsertJob' AND bq.resource.type = 'bigquery_project' AND JSON_VALUE( bq.proto_payload.audit_log.metadata.jobInsertion.job.jobConfig.queryConfig.query) IS NOT NULL AND JSON_VALUE(db.labels.data_boost_workload_id) = REGEXP_EXTRACT(bq.proto_payload.audit_log.resource_name, '[^/]*$') GROUP BY bq_query ORDER BY usage DESCPROJECT_NAME을 프로젝트 이름으로 바꿉니다.
다음 예시는 SQL 텍스트별 Data Boost 사용량을 보여줍니다.
Data Boost 알림 만들기
Data Boost 사용량이 사전 정의된 기준점을 초과하면 실행되는 알림을 만들려면 Data Boost 사용량 알림 설정을 참조하세요.
다음 단계
- Data Boost 개요에서 Data Boost에 대해 알아보기