Note:
This document describes the recommended solution for collecting AWS
CloudWatch metrics and sending them to Cloud Monitoring.
Use of AWS CloudWatch metrics in Connector projects in Cloud Monitoring was
deprecated on
August 21, 2023 and is no longer supported.
On August 21, 2024 , existing AWS Connector projects
were turned down and metric ingestion was stopped.
For more information about this change, see
Deprecation: AWS CloudWatch metrics in Connector projects .
The legacy Monitoring agent and legacy Logging agent on
Amazon Elastic Compute Cloud (Amazon EC2) are still supported and aren't being
deprecated.
This document describes how to use the open source Prometheus CloudWatch exporter
and the Ops Agent running on a Compute Engine instance to collect AWS
CloudWatch metrics and store them in a Google Cloud project.
This document is intended for developers and system administrators who need
to collect AWS CloudWatch metrics. This document describes how to set up the
Prometheus CloudWatch exporter to collect AWS CloudWatch metrics.
With Cloud Monitoring, you can view your AWS metrics in the same context
as your Google Cloud metrics. For example, you can create a dashboard with
charts that display CPU utilization for your Amazon EC2 instances
and for your Compute Engine instances. You can also create alerting
policies to monitor your AWS metrics. For more information, see the
following sections:
Before you begin
To collect AWS CloudWatch metrics by using the Prometheus CloudWatch exporter, you
need the following:
A Google Cloud project with permissions to do the following:
Create a VM
Write logs to Cloud Logging
Write metrics to Cloud Monitoring
An AWS account with AWS credentials that can be used by the
Prometheus exporter to fetch metrics.
For more information, see
Run the Prometheus exporter .
Create a Compute Engine VM
We recommend creating a Linux Compute Engine VM to use specifically
for running the Ops Agent and the Prometheus CloudWatch exporter. This VM acts as
the collection site for all AWS metrics.
To create a Debian Linux VM named aws-exporter-test in a zone that you
specify, run the following command:
gcloud compute instances create \
  --image-project debian-cloud \
  --image-family debian-11 \
  --zone ZONE \
  aws-exporter-test
Configure the command as follows:
Replace ZONE
Optional. Replace aws-exporter-test
Note: This command creates a VM with the default machine type of
n1-standard-1. This machine type has been sufficient for monitoring
modest projects in our testing, but if you are ingesting a large number
of metrics by using the Prometheus CloudWatch exporter, then you might need to use
a larger machine. We recommend setting up alerting policies on the CPU
and memory usage of this VM to determine whether you need a larger machine.
For information about alerting policies, see Create
metric-threshold alerting policies . For more information about this command, see the
gcloud compute instances create reference
To access your VM so that you can install the Prometheus CloudWatch exporter and the
Ops Agent, you can use the following command:
gcloud compute ssh --zone ZONE --project PROJECT_ID aws-exporter-test
Configure the command as follows:
Replace ZONE with the zone in which you created your VM
Replace PROJECT_ID with ID of your Google Cloud project
Replace aws-exporter-test if you created your VM with a
different name
For more information about this command, see the
gcloud compute ssh reference
Set up the Prometheus CloudWatch exporter
The following sections describe the procedure for downloading, installing,
and configuring the Prometheus CloudWatch exporter on your Compute Engine VM.
Download the Prometheus exporter and the JRE
To run the Prometheus CloudWatch exporter, you need to download the exporter and
the Java Runtime Environment (JRE), version 11 or newer.
To download the JAR file containing the Prometheus CloudWatch exporter, run the
following command on your Compute Engine instance:
curl -sSO https://github.com/prometheus/cloudwatch_exporter/releases/download/v0.15.1/cloudwatch_exporter-0.15.1-jar-with-dependencies.jar
To install the JRE, you can use a command like the following:
sudo apt install default-jre
Configure the Prometheus exporter
To configure the Prometheus CloudWatch exporter, you create a configuration file for
the AWS service or services from which you want to collect metrics.
For general information, see the Prometheus CloudWatch exporter configuration
documentation .
Migrating users : If you are migrating your existing AWS CloudWatch
metrics to the Prometheus CloudWatch exporter, then you can use the configuration files
in Prometheus CloudWatch exporter configurations for migration .
These configuration files are designed to replicate the existing metrics as
closely as possible, but they do not collect all the metrics available
by using the Prometheus CloudWatch exporter for the AWS services.
New users : If you are not migrating existing metrics, we recommend that
you don't use the migration configurations. See the AWS CloudWatch service
documentation for information
about how to define exporter configurations for other services. You can also
find additional samples in the Prometheus CloudWatch exporter
GitHub repository .
You can combine configuration for multiple AWS services into one
configuration file. The examples in this document assume that your
configuration file is named config.yml
Note: The Prometheus CloudWatch exporter defaults to fetching metrics with 10-minute
delay. You can change this value in your exporter configuration; see
Timestamps . AWS CloudWatch
reports eventually consistent metrics, and this delay reduces
the chance of recording metric points that might change. Prometheus
doesn't support duplicate reporting of points, so if you change this
value and new information tries to change older points, then those changes
are rejected. Run the Prometheus exporter
Before you can run the Prometheus CloudWatch exporter, you must provide the
exporter with credentials and authorization.
The Prometheus CloudWatch exporter uses the the AWS Java
SDK , which offers ways to provide credentials
by using the following environment variables:
For more information about providing credentials to the SDK,
see AWS SDK for Java 2.x .
You must also have permission to use the CloudWatch API to retrieve
metrics, You need the following AWS IAM CloudWatch
permissions :
cloudwatch:ListMetricscloudwatch:GetMetricStatisticscloudwatch:GetMetricData
Using the aws_tag_select feature also requires the tag:GetResources
AWS IAM permission.
For more information about authorizing access to AWS services, see
AWS Identity and Access Management .
To run the Prometheus CloudWatch exporter, do the following:
To provide credentials for the exporter, set the access-key environment
variables:
export AWS_ACCESS_KEY=YOUR_ACCESS_KEY
export AWS_SECRET_ACCESS_KEY=YOUR_SECRET_ACCESS_KEY
export AWS_SESSION_TOKEN=YOUR_SESSION_TOKEN
Replace the YOUR_KEY variables with your access keys.
You need to set the AWS_SESSION_TOKEN environment variable only
if you are using temporary credentials .
To test your configuration, start the exporter and load your configuration
file, run the following command:
java -jar cloudwatch_exporter-0.15.1-jar-with-dependencies.jar 9106 config.yml Change the port (9106 config.yml
If you modify your config.yml
curl -X POST localhost:9106 For use in a production environment, you can configure the exporter to
restart if the VM restarts. For example, on Debian systems, you
can use the system and service manager,
systemd .
Set up the Ops Agent
The following sections describe how to install configure, and start
the Ops Agent. These sections provide minimal set-up information for
the Ops Agent for use with the Prometheus CloudWatch exporter.
For more information about these topics, see
Ops Agent overview .
Install the Ops Agent
To install the Ops Agent, use the following commands to download and
run the agent's installation script:
curl -sSO https://dl.google.com/cloudagents/add-google-cloud-ops-agent-repo.sh
sudo bash add-google-cloud-ops-agent-repo.sh --also-install
Configure the Ops Agent
To configure the Ops Agent, you add configuration elements to the
agent's user-configuration file. On Linux, the user-configuration file
is /etc/google-cloud-ops-agent/config.yaml.
When you configure the Ops Agent to collect AWS metrics from the
Prometheus CloudWatch exporter, you use the agent's Prometheus receiver. This
document describes two basic configurations for the Ops Agent.
Select one of the configurations and add it to the
user-configuration file:
sudo vim /etc/google-cloud-ops-agent/config.yaml
Basic configuration for the Ops Agent
The following configuration provides a minimal configuration for the
Ops Agent. This configuration does the following:
Creates a receiver named aws of type prometheus. The receiver is
configured to scrape metrics from the aws_exporter job. The
port specified must match the port on which the Prometheus CloudWatch exporter is
exporting metrics; see Run the Prometheus exporter .
Creates a pipeline named aws_pipeline that uses the aws metrics recevier.
metrics:
receivers:
aws:
type: prometheus
config:
scrape_configs:
- job_name: 'aws_exporter'
scrape_interval: 10s
static_configs:
- targets: ['localhost:9106 Configuration that drops JVM metrics
The following configuration does everything that the basic configuration does,
but it also adds a relabeling config that drops
the JVM metrics generated by the exporter. Dropping these metrics reduces the
ingested metric data, but it can make problems with the exporter more
difficult to debug, because you aren't getting the exporter's own metrics:
metrics:
receivers:
aws:
type: prometheus
config:
scrape_configs:
- job_name: 'aws_exporter'
scrape_interval: 10s
static_configs:
- targets: ['localhost:9106 You can create much more complex configurations for the Ops Agent.
Restart the Ops Agent
To apply configuration changes to the Ops Agent, you must restart the agent.
To restart the agent, run the following command on your instance:
sudo service google-cloud-ops-agent restart
To confirm that the agent restarted, run the following command and
verify that the components "Metrics Agent" and "Logging Agent" started:
sudo systemctl status google-cloud-ops-agent"*"
View metrics in Cloud Monitoring
In Cloud Monitoring, you can query your AWS CloudWatch metrics and
create charts like you do for any other metrics. From the Metrics Explorer
interface, you can use PromQL or a query-builder
interface. For more information, see
Create charts with Metrics Explorer .
If you have created charts you that want to keep, then you can save them to
custom dashboards. For more information, see Dashboards overview .
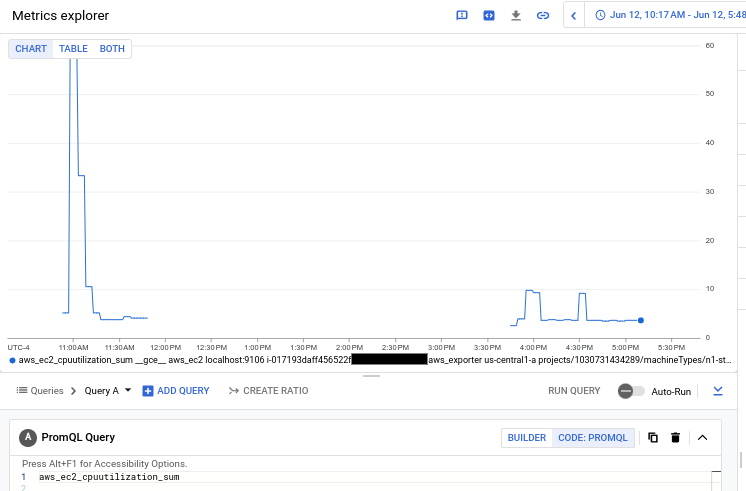
The following chart shows a PromQL query for the
aws_ec2_cpuutilization_sum metric for AWS VMs:
For more information about using PromQL in Cloud Monitoring, see
PromQL for Cloud Monitoring .
Alert on metric behavior
In Cloud Monitoring, you can create alerting policies to
monitor your AWS CloudWatch metrics and notify you of spikes, dips, or trends
in metric values.
Monitor multiple regions
The configuration of the Prometheus CloudWatch exporter supports the use of only one
region per configuration file. If you need to monitor multiple regions, then
we recommend that you run multiple instances of the Prometheus exporter,
one configured for each region you want to monitor. You can run multiple
exporters on a single VM, or you can distribute them across VMs. The
Prometheus exporter Docker images
might be useful in this situation.
You can configure the Ops Agent running on the Compute Engine VM
to scrape multiple Prometheus endpoints. We recommend that, when you
configure multiple instances of the Prometheus exporter, you
use a different job name the scrape config for each, so you
can distinguish the exporter instances if you need to troubleshoot them.
For information about configuring the Ops Agent and the Prometheus
receiver, see Configure the Ops Agent .
Cost
Amazon charges for every CloudWatch API request or for every CloudWatch
metric you request; for current pricing, see Amazon CloudWatch
Pricing . The Prometheus CloudWatch exporter
has the following query
characteristics ,
which can affect your Amazon costs:
When using the GetMetricStatistics method (default), every metric
requires one API request. Each request can include multiple statistics.
When using aws_dimensions, the exporter must perform API requests
to determine which metrics to request. The number of dimensions requests
is typically negligible in comparison to the number of metric requests.
Cloud Monitoring charges for AWS CloudWatch metrics from the
Prometheus exporter by the number of samples
ingested. For current pricing, see the Cloud Monitoring sections of the
Google Cloud Observability pricing page.
Prometheus CloudWatch exporter configurations for migration
This section provides configurations that replicate, as closely as
possible, the AWS service metrics documented in the
AWS metrics list. These configuration
files are intended for use by customers who are migrating to the
Prometheus CloudWatch exporter from the legacy solution. If you are setting up
the Prometheus CloudWatch exporter as a new user rather than a migrating user and
you use these configurations, then you are not collecting all the AWS
metrics that the Prometheus CloudWatch exporter makes available.
To view a sample configuration file for AWS CloudWatch metrics, expand one
of the following sections.
applicationelb.yml
region: us-east-1
metrics:
- aws_namespace: AWS/ApplicationELB
  aws_metric_name: ActiveConnectionCount
  aws_dimensions: [AvailabilityZone, LoadBalancer]
- aws_namespace: AWS/ApplicationELB
  aws_metric_name: ClientTLSNegotiationErrorCount
  aws_dimensions: [AvailabilityZone, LoadBalancer]
- aws_namespace: AWS/ApplicationELB
  aws_metric_name: ConsumedLCUs
  aws_dimensions: [LoadBalancer]
- aws_namespace: AWS/ApplicationELB
  aws_metric_name: DesyncMitigationMode_NonCompliant_Request_Count
  aws_dimensions: [AvailabilityZone, LoadBalancer]
- aws_namespace: AWS/ApplicationELB
  aws_metric_name: DroppedInvalidHeaderRequestCount
  aws_dimensions: [AvailabilityZone, LoadBalancer]
- aws_namespace: AWS/ApplicationELB
  aws_metric_name: DroppedInvalidHeaderRequestCount
  aws_dimensions: [AvailabilityZone, LoadBalancer]
- aws_namespace: AWS/ApplicationELB
  aws_metric_name: ForwardedInvalidHeaderRequestCount
  aws_dimensions: [AvailabilityZone, LoadBalancer]
- aws_namespace: AWS/ApplicationELB
  aws_metric_name: GrpcRequestCount
  aws_dimensions: [AvailabilityZone, LoadBalancer]
- aws_namespace: AWS/ApplicationELB
  aws_metric_name: HTTP_Fixed_Response_Count
  aws_dimensions: [AvailabilityZone, LoadBalancer]
- aws_namespace: AWS/ApplicationELB
  aws_metric_name: HTTP_Redirect_Count
  aws_dimensions: [AvailabilityZone, LoadBalancer]
- aws_namespace: AWS/ApplicationELB
  aws_metric_name: HTTP_Redirect_Url_Limit_Exceeded_Count
  aws_dimensions: [AvailabilityZone, LoadBalancer]
- aws_namespace: AWS/ApplicationELB
  aws_metric_name: HTTPCode_ELB_3XX_Count
  aws_dimensions: [AvailabilityZone, LoadBalancer]
- aws_namespace: AWS/ApplicationELB
  aws_metric_name: HTTPCode_ELB_4XX_Count
  aws_dimensions: [AvailabilityZone, LoadBalancer]
- aws_namespace: AWS/ApplicationELB
  aws_metric_name: HTTPCode_ELB_5XX_Count
  aws_dimensions: [AvailabilityZone, LoadBalancer]
- aws_namespace: AWS/ApplicationELB
  aws_metric_name: HTTPCode_ELB_500_Count
  aws_dimensions: [AvailabilityZone, LoadBalancer]
- aws_namespace: AWS/ApplicationELB
  aws_metric_name: HTTPCode_ELB_502_Count
  aws_dimensions: [AvailabilityZone, LoadBalancer]
- aws_namespace: AWS/ApplicationELB
  aws_metric_name: HTTPCode_ELB_503_Count
  aws_dimensions: [AvailabilityZone, LoadBalancer]
- aws_namespace: AWS/ApplicationELB
  aws_metric_name: HTTPCode_ELB_504_Count
  aws_dimensions: [AvailabilityZone, LoadBalancer]
- aws_namespace: AWS/ApplicationELB
  aws_metric_name: IPv6ProcessedBytes
  aws_dimensions: [AvailabilityZone, LoadBalancer]
- aws_namespace: AWS/ApplicationELB
  aws_metric_name: IPv6RequestCount
  aws_dimensions: [AvailabilityZone, LoadBalancer]
- aws_namespace: AWS/ApplicationELB
  aws_metric_name: NewConnectionCount
  aws_dimensions: [AvailabilityZone, LoadBalancer]
- aws_namespace: AWS/ApplicationELB
  aws_metric_name: NonStickyRequestCount
  aws_dimensions: [AvailabilityZone, LoadBalancer]
- aws_namespace: AWS/ApplicationELB
  aws_metric_name: ProcessedBytes
  aws_dimensions: [AvailabilityZone, LoadBalancer]
- aws_namespace: AWS/ApplicationELB
  aws_metric_name: RejectedConnectionCount
  aws_dimensions: [AvailabilityZone, LoadBalancer]
- aws_namespace: AWS/ApplicationELB
  aws_metric_name: RequestCount
  aws_dimensions: [AvailabilityZone, TargetGroup, LoadBalancer]
- aws_namespace: AWS/ApplicationELB
  aws_metric_name: RuleEvaluations
  aws_dimensions: [LoadBalancer]
- aws_namespace: AWS/ApplicationELB
  aws_metric_name: HealthyHostCount
  aws_dimensions: [AvailabilityZone, TargetGroup, LoadBalancer]
- aws_namespace: AWS/ApplicationELB
  aws_metric_name: HTTPCode_Target_2XX_Count
  aws_dimensions: [AvailabilityZone, TargetGroup, LoadBalancer]
- aws_namespace: AWS/ApplicationELB
  aws_metric_name: HTTPCode_Target_3XX_Count
  aws_dimensions: [AvailabilityZone, TargetGroup, LoadBalancer]
- aws_namespace: AWS/ApplicationELB
  aws_metric_name: HTTPCode_Target_4XX_Count
  aws_dimensions: [AvailabilityZone, TargetGroup, LoadBalancer]
- aws_namespace: AWS/ApplicationELB
  aws_metric_name: HTTPCode_Target_5XX_Count
  aws_dimensions: [AvailabilityZone, TargetGroup, LoadBalancer]
- aws_namespace: AWS/ApplicationELB
  aws_metric_name: RequestCountPerTarget
  aws_dimensions: [AvailabilityZone, TargetGroup, LoadBalancer]
- aws_namespace: AWS/ApplicationELB
  aws_metric_name: TargetConnectionErrorCount
  aws_dimensions: [AvailabilityZone, TargetGroup, LoadBalancer]
- aws_namespace: AWS/ApplicationELB
  aws_metric_name: TargetResponseTime
  aws_dimensions: [AvailabilityZone, TargetGroup, LoadBalancer]
- aws_namespace: AWS/ApplicationELB
  aws_metric_name: TargetTLSNegotiationErrorCount
  aws_dimensions: [AvailabilityZone, TargetGroup, LoadBalancer]
- aws_namespace: AWS/ApplicationELB
  aws_metric_name: UnHealthyHostCount
  aws_dimensions: [AvailabilityZone, TargetGroup, LoadBalancer]
- aws_namespace: AWS/ApplicationELB
  aws_metric_name: HealthyStateDNS
  aws_dimensions: [AvailabilityZone, TargetGroup, LoadBalancer]
- aws_namespace: AWS/ApplicationELB
  aws_metric_name: HealthyStateRouting
  aws_dimensions: [AvailabilityZone, TargetGroup, LoadBalancer]
- aws_namespace: AWS/ApplicationELB
  aws_metric_name: UnhealthyRoutingRequestCount
  aws_dimensions: [AvailabilityZone, TargetGroup, LoadBalancer]
- aws_namespace: AWS/ApplicationELB
  aws_metric_name: UnhealthyStateDNS
  aws_dimensions: [AvailabilityZone, TargetGroup, LoadBalancer]
- aws_namespace: AWS/ApplicationELB
  aws_metric_name: UnhealthyStateRouting
  aws_dimensions: [AvailabilityZone, TargetGroup, LoadBalancer]
- aws_namespace: AWS/ApplicationELB
  aws_metric_name: LambdaInternalError
  aws_dimensions: [TargetGroup, LoadBalancer]
- aws_namespace: AWS/ApplicationELB
  aws_metric_name: LambdaTargetProcessedBytes
  aws_dimensions: [LoadBalancer]
- aws_namespace: AWS/ApplicationELB
  aws_metric_name: LambdaUserError
  aws_dimensions: [TargetGroup, LoadBalancer]
- aws_namespace: AWS/ApplicationELB
  aws_metric_name: ELBAuthError
  aws_dimensions: [AvailabilityZone, LoadBalancer]
- aws_namespace: AWS/ApplicationELB
  aws_metric_name: ELBAuthFailure
  aws_dimensions: [AvailabilityZone, LoadBalancer]
- aws_namespace: AWS/ApplicationELB
  aws_metric_name: ELBAuthLatency
  aws_dimensions: [AvailabilityZone, LoadBalancer]
- aws_namespace: AWS/ApplicationELB
  aws_metric_name: ELBAuthRefreshTokenSuccess
  aws_dimensions: [AvailabilityZone, LoadBalancer]
- aws_namespace: AWS/ApplicationELB
  aws_metric_name: ELBAuthSuccess
  aws_dimensions: [AvailabilityZone, LoadBalancer]
- aws_namespace: AWS/ApplicationELB
  aws_metric_name: ELBAuthUserClaimsSizeExceeded
  aws_dimensions: [AvailabilityZone, LoadBalancer]
cloudfront.yml
region: us-east-1
metrics:
- aws_dimensions:
  - DistributionId
  - Region
  aws_metric_name: Requests
  aws_namespace: AWS/CloudFront
- aws_dimensions:
  - DistributionId
  - Region
  aws_metric_name: BytesDownloaded
  aws_namespace: AWS/CloudFront
- aws_dimensions:
  - DistributionId
  - Region
  aws_metric_name: BytesUploaded
  aws_namespace: AWS/CloudFront
- aws_dimensions:
  - DistributionId
  - Region
  aws_metric_name: 4xxErrorRate
  aws_namespace: AWS/CloudFront
- aws_dimensions:
  - DistributionId
  - Region
  aws_metric_name: 5xxErrorRate
  aws_namespace: AWS/CloudFront
- aws_dimensions:
  - DistributionId
  - Region
  aws_metric_name: TotalErrorRate
  aws_namespace: AWS/CloudFront
dynamodb.yml
region: us-east-1
metrics:
- aws_dimensions:
  - TableName
  - GlobalSecondaryIndexName
  aws_metric_name: ConsumedReadCapacityUnits
  aws_namespace: AWS/DynamoDB
  aws_statistics:
  - Maximum
- aws_dimensions:
  - TableName
  - GlobalSecondaryIndexName
  aws_metric_name: ConsumedWriteCapacityUnits
  aws_namespace: AWS/DynamoDB
  aws_statistics:
  - Maximum
- aws_dimensions:
  - TableName
  - Operation
  aws_metric_name: ThrottledRequests
  aws_namespace: AWS/DynamoDB
  aws_statistics:
  - Sum
- aws_dimensions:
  - TableName
  - Operation
  aws_metric_name: SystemErrors
  aws_namespace: AWS/DynamoDB
  aws_statistics:
  - Sum
- aws_dimensions:
  - TableName
  - Operation
  aws_metric_name: SuccessfulRequestLatency
  aws_namespace: AWS/DynamoDB
  aws_statistics:
  - Maximum
- aws_dimensions:
  - TableName
  - GlobalSecondaryIndexName
  aws_metric_name: WriteThrottleEvents
  aws_namespace: AWS/DynamoDB
  aws_statistics:
  - Sum
- aws_dimensions:
  - TableName
  - GlobalSecondaryIndexName
  aws_metric_name: ReadThrottleEvents
  aws_namespace: AWS/DynamoDB
  aws_statistics:
  - Sum
ebs.yml
region: us-east-1
metrics:
- aws_dimensions:
  - VolumeId
  aws_metric_name: VolumeWriteBytes
  aws_namespace: AWS/EBS
  aws_statistics:
  - Maximum
  - Average
- aws_dimensions:
  - VolumeId
  aws_metric_name: VolumeReadBytes
  aws_namespace: AWS/EBS
  aws_statistics:
  - Maximum
  - Average
- aws_dimensions:
  - VolumeId
  aws_metric_name: VolumeReadOps
  aws_namespace: AWS/EBS
  aws_statistics:
  - Average
- aws_dimensions:
  - VolumeId
  aws_metric_name: VolumeWriteOps
  aws_namespace: AWS/EBS
  aws_statistics:
  - Average
- aws_dimensions:
  - VolumeId
  aws_metric_name: VolumeTotalReadTime
  aws_namespace: AWS/EBS
  aws_statistics:
  - Sum
  - Average
- aws_dimensions:
  - VolumeId
  aws_metric_name: VolumeTotalWriteTime
  aws_namespace: AWS/EBS
  aws_statistics:
  - Sum
  - Average
- aws_dimensions:
  - VolumeId
  aws_metric_name: VolumeQueueLength
  aws_namespace: AWS/EBS
  aws_statistics:
  - Average
- aws_dimensions:
  - VolumeId
  aws_metric_name: BurstBalance
  aws_namespace: AWS/EBS
  aws_statistics:
  - Average
- aws_dimensions:
  - VolumeId
  aws_metric_name: VolumeIdleTime
  aws_namespace: AWS/EBS
  aws_statistics:
  - Sum
ec2.yml
region: us-east-1
metrics:
- aws_dimensions:
  - InstanceId
  aws_metric_name: CPUUtilization
  aws_namespace: AWS/EC2
  aws_tag_select:
    resource_type_selection: ec2:instance
    resource_id_dimension: InstanceId
- aws_dimensions:
  - InstanceId
  aws_metric_name: NetworkIn
  aws_namespace: AWS/EC2
- aws_dimensions:
  - InstanceId
  aws_metric_name: NetworkOut
  aws_namespace: AWS/EC2
- aws_dimensions:
  - InstanceId
  aws_metric_name: NetworkPacketsIn
  aws_namespace: AWS/EC2
- aws_dimensions:
  - InstanceId
  aws_metric_name: NetworkPacketsOut
  aws_namespace: AWS/EC2
- aws_dimensions:
  - InstanceId
  aws_metric_name: DiskWriteBytes
  aws_namespace: AWS/EC2
- aws_dimensions:
  - InstanceId
  aws_metric_name: DiskReadBytes
  aws_namespace: AWS/EC2
- aws_dimensions:
  - InstanceId
  aws_metric_name: CPUCreditBalance
  aws_namespace: AWS/EC2
- aws_dimensions:
  - InstanceId
  aws_metric_name: CPUCreditUsage
  aws_namespace: AWS/EC2
- aws_dimensions:
  - InstanceId
  aws_metric_name: StatusCheckFailed
  aws_namespace: AWS/EC2
- aws_dimensions:
  - InstanceId
  aws_metric_name: StatusCheckFailed_Instance
  aws_namespace: AWS/EC2
- aws_dimensions:
  - InstanceId
  aws_metric_name: StatusCheckFailed_System
  aws_namespace: AWS/EC2
elasticache.yml
region: us-east-1
metrics:
- aws_namespace: AWS/ElastiCache
  aws_metric_name: ActiveDefragHits
  aws_dimensions:
  - CacheNodeId
  - CacheClusterId
- aws_namespace: AWS/ElastiCache
  aws_metric_name: AuthenticationFailures
  aws_dimensions:
  - CacheNodeId
  - CacheClusterId
- aws_namespace: AWS/ElastiCache
  aws_metric_name: BytesReadIntoMemcached
  aws_dimensions:
  - CacheNodeId
  - CacheClusterId
- aws_namespace: AWS/ElastiCache
  aws_metric_name: BytesUsedForCache
  aws_dimensions:
  - CacheNodeId
  - CacheClusterId
- aws_namespace: AWS/ElastiCache
  aws_metric_name: BytesUsedForCacheItems
  aws_dimensions:
  - CacheNodeId
  - CacheClusterId
- aws_namespace: AWS/ElastiCache
  aws_metric_name: BytesUsedForHash
  aws_dimensions:
  - CacheNodeId
  - CacheClusterId
- aws_namespace: AWS/ElastiCache
  aws_metric_name: BytesWrittenOutFromMemcached
  aws_dimensions:
  - CacheNodeId
  - CacheClusterId
- aws_namespace: AWS/ElastiCache
  aws_metric_name: CPUCreditBalance
  aws_dimensions:
  - CacheNodeId
  - CacheClusterId
- aws_namespace: AWS/ElastiCache
  aws_metric_name: CPUCreditUsage
  aws_dimensions:
  - CacheNodeId
  - CacheClusterId
- aws_namespace: AWS/ElastiCache
  aws_metric_name: CPUUtilization
  aws_dimensions:
  - CacheNodeId
  - CacheClusterId
- aws_namespace: AWS/ElastiCache
  aws_metric_name: CacheHits
  aws_dimensions:
  - CacheNodeId
  - CacheClusterId
- aws_namespace: AWS/ElastiCache
  aws_metric_name: CacheMisses
  aws_dimensions:
  - CacheNodeId
  - CacheClusterId
- aws_namespace: AWS/ElastiCache
  aws_metric_name: CasBadval
  aws_dimensions:
  - CacheNodeId
  - CacheClusterId
- aws_namespace: AWS/ElastiCache
  aws_metric_name: CasHits
  aws_dimensions:
  - CacheNodeId
  - CacheClusterId
- aws_namespace: AWS/ElastiCache
  aws_metric_name: CasMisses
  aws_dimensions:
  - CacheNodeId
  - CacheClusterId
- aws_namespace: AWS/ElastiCache
  aws_metric_name: CmdConfigGet
  aws_dimensions:
  - CacheNodeId
  - CacheClusterId
- aws_namespace: AWS/ElastiCache
  aws_metric_name: CmdConfigSet
  aws_dimensions:
  - CacheNodeId
  - CacheClusterId
- aws_namespace: AWS/ElastiCache
  aws_metric_name: CmdFlush
  aws_dimensions:
  - CacheNodeId
  - CacheClusterId
- aws_namespace: AWS/ElastiCache
  aws_metric_name: CmdGet
  aws_dimensions:
  - CacheNodeId
  - CacheClusterId
- aws_namespace: AWS/ElastiCache
  aws_metric_name: CmdSet
  aws_dimensions:
  - CacheNodeId
  - CacheClusterId
- aws_namespace: AWS/ElastiCache
  aws_metric_name: CmdTouch
  aws_dimensions:
  - CacheNodeId
  - CacheClusterId
- aws_namespace: AWS/ElastiCache
  aws_metric_name: CommandAuthorizationFailures
  aws_dimensions:
  - CacheNodeId
  - CacheClusterId
- aws_namespace: AWS/ElastiCache
  aws_metric_name: CrawlerItemsChecked
  aws_dimensions:
  - CacheNodeId
  - CacheClusterId
- aws_namespace: AWS/ElastiCache
  aws_metric_name: CurrConfig
  aws_dimensions:
  - CacheNodeId
  - CacheClusterId
- aws_namespace: AWS/ElastiCache
  aws_metric_name: CurrConnections
  aws_dimensions:
  - CacheNodeId
  - CacheClusterId
- aws_namespace: AWS/ElastiCache
  aws_metric_name: CurrItems
  aws_dimensions:
  - CacheNodeId
  - CacheClusterId
- aws_namespace: AWS/ElastiCache
  aws_metric_name: CurrVolatileItems
  aws_dimensions:
  - CacheNodeId
  - CacheClusterId
- aws_namespace: AWS/ElastiCache
  aws_metric_name: DatabaseMemoryUsageCountedForEvictPercentage
  aws_dimensions:
  - NodeGroupId
  - ReplciationGroupId
- aws_namespace: AWS/ElastiCache
  aws_metric_name: DatabaseMemoryUsagePercentage
  aws_dimensions:
  - CacheNodeId
  - CacheClusterId
- aws_namespace: AWS/ElastiCache
  aws_metric_name: DecrHits
  aws_dimensions:
  - CacheNodeId
  - CacheClusterId
- aws_namespace: AWS/ElastiCache
  aws_metric_name: DecrMisses
  aws_dimensions:
  - CacheNodeId
  - CacheClusterId
- aws_namespace: AWS/ElastiCache
  aws_metric_name: DeleteHits
  aws_dimensions:
  - CacheNodeId
  - CacheClusterId
- aws_namespace: AWS/ElastiCache
  aws_metric_name: DeleteMisses
  aws_dimensions:
  - CacheNodeId
  - CacheClusterId
- aws_namespace: AWS/ElastiCache
  aws_metric_name: EngineCPUUtilization
  aws_dimensions:
  - CacheNodeId
  - CacheClusterId
  - NodeGroupId
  - ReplicationGroupId
  - Role
- aws_namespace: AWS/ElastiCache
  aws_metric_name: EvictedUnfetched
  aws_dimensions:
  - CacheNodeId
  - CacheClusterId
- aws_namespace: AWS/ElastiCache
  aws_metric_name: Evictions
  aws_dimensions:
  - CacheNodeId
  - CacheClusterId
- aws_namespace: AWS/ElastiCache
  aws_metric_name: ExpiredUnfetched
  aws_dimensions:
  - CacheNodeId
  - CacheClusterId
- aws_namespace: AWS/ElastiCache
  aws_metric_name: FreeableMemory
  aws_dimensions:
  - CacheNodeId
  - CacheClusterId
- aws_namespace: AWS/ElastiCache
  aws_metric_name: GetHits
  aws_dimensions:
  - CacheNodeId
  - CacheClusterId
- aws_namespace: AWS/ElastiCache
  aws_metric_name: GetMisses
  aws_dimensions:
  - CacheNodeId
  - CacheClusterId
- aws_namespace: AWS/ElastiCache
  aws_metric_name: IamAuthenticationExpirations
  aws_dimensions:
  - CacheNodeId
  - CacheClusterId
- aws_namespace: AWS/ElastiCache
  aws_metric_name: IamAuthenticationThrottling
  aws_dimensions:
  - CacheNodeId
  - CacheClusterId
- aws_namespace: AWS/ElastiCache
  aws_metric_name: IncrHits
  aws_dimensions:
  - CacheNodeId
  - CacheClusterId
- aws_namespace: AWS/ElastiCache
  aws_metric_name: IncrMisses
  aws_dimensions:
  - CacheNodeId
  - CacheClusterId
- aws_namespace: AWS/ElastiCache
  aws_metric_name: IsMaster
  aws_dimensions:
  - CacheNodeId
  - CacheClusterId
- aws_namespace: AWS/ElastiCache
  aws_metric_name: KeyAuthorizationFailures
  aws_dimensions:
  - CacheNodeId
  - CacheClusterId
- aws_namespace: AWS/ElastiCache
  aws_metric_name: KeyBasedCmds
  aws_dimensions:
  - CacheNodeId
  - CacheClusterId
- aws_namespace: AWS/ElastiCache
  aws_metric_name: ListBasedCmds
  aws_dimensions:
  - CacheNodeId
  - CacheClusterId
- aws_namespace: AWS/ElastiCache
  aws_metric_name: KeysTracked
  aws_dimensions:
  - CacheNodeId
  - CacheClusterId
- aws_namespace: AWS/ElastiCache
  aws_metric_name: MasterLinkHealthStatus
  aws_dimensions:
  - CacheNodeId
  - CacheClusterId
- aws_namespace: AWS/ElastiCache
  aws_metric_name: MemoryFragmentationRatio
  aws_dimensions:
  - CacheNodeId
  - CacheClusterId
- aws_namespace: AWS/ElastiCache
  aws_metric_name: NetworkBandwidthInAllowanceExceeded
  aws_dimensions:
  - CacheNodeId
  - CacheClusterId
- aws_namespace: AWS/ElastiCache
  aws_metric_name: NetworkBandwidthOutAllowanceExceeded
  aws_dimensions:
  - CacheNodeId
  - CacheClusterId
- aws_namespace: AWS/ElastiCache
  aws_metric_name: NetworkBytesIn
  aws_dimensions:
  - CacheNodeId
  - CacheClusterId
- aws_namespace: AWS/ElastiCache
  aws_metric_name: NetworkBytesOut
  aws_dimensions:
  - CacheNodeId
  - CacheClusterId
- aws_namespace: AWS/ElastiCache
  aws_metric_name: NetworkConntrackAllowanceExceeded
  aws_dimensions:
  - CacheNodeId
  - CacheClusterId
- aws_namespace: AWS/ElastiCache
  aws_metric_name: NetworkPacketsIn
  aws_dimensions:
  - CacheNodeId
  - CacheClusterId
- aws_namespace: AWS/ElastiCache
  aws_metric_name: NetworkPacketsOut
  aws_dimensions:
  - CacheNodeId
  - CacheClusterId
- aws_namespace: AWS/ElastiCache
  aws_metric_name: NetworkPacketsPerSecondAllowanceExceeded
  aws_dimensions:
  - CacheNodeId
  - CacheClusterId
- aws_namespace: AWS/ElastiCache
  aws_metric_name: NewConnections
  aws_dimensions:
  - CacheNodeId
  - CacheClusterId
- aws_namespace: AWS/ElastiCache
  aws_metric_name: NewItems
  aws_dimensions:
  - CacheNodeId
  - CacheClusterId
- aws_namespace: AWS/ElastiCache
  aws_metric_name: NonKeyTypeCmds
  aws_dimensions:
  - CacheNodeId
  - CacheClusterId
- aws_namespace: AWS/ElastiCache
  aws_metric_name: NonKeyTypeCmdsLatency
  aws_dimensions:
  - CacheNodeId
  - CacheClusterId
- aws_namespace: AWS/ElastiCache
  aws_metric_name: Reclaimed
  aws_dimensions:
  - CacheNodeId
  - CacheClusterId
- aws_namespace: AWS/ElastiCache
  aws_metric_name: ReplicationBytes
  aws_dimensions:
  - CacheNodeId
  - CacheClusterId
- aws_namespace: AWS/ElastiCache
  aws_metric_name: ReplicationLag
  aws_dimensions:
  - CacheNodeId
  - CacheClusterId
- aws_namespace: AWS/ElastiCache
  aws_metric_name: SetBasedCmds
  aws_dimensions:
  - CacheNodeId
  - CacheClusterId
- aws_namespace: AWS/ElastiCache
  aws_metric_name: SetTypeCmds
  aws_dimensions:
  - CacheNodeId
  - CacheClusterId
- aws_namespace: AWS/ElastiCache
  aws_metric_name: SlabsMoved
  aws_dimensions:
  - CacheNodeId
  - CacheClusterId
- aws_namespace: AWS/ElastiCache
  aws_metric_name: SortedSetBasedCmds
  aws_dimensions:
  - CacheNodeId
  - CacheClusterId
- aws_namespace: AWS/ElastiCache
  aws_metric_name: StringBasedCmds
  aws_dimensions:
  - CacheNodeId
  - CacheClusterId
- aws_namespace: AWS/ElastiCache
  aws_metric_name: SaveInProgress
  aws_dimensions:
  - CacheNodeId
  - CacheClusterId
- aws_namespace: AWS/ElastiCache
  aws_metric_name: SwapUsage
  aws_dimensions:
  - CacheNodeId
  - CacheClusterId
- aws_namespace: AWS/ElastiCache
  aws_metric_name: TouchHits
  aws_dimensions:
  - CacheNodeId
  - CacheClusterId
- aws_namespace: AWS/ElastiCache
  aws_metric_name: TouchMisses
  aws_dimensions:
  - CacheNodeId
  - CacheClusterId
- aws_namespace: AWS/ElastiCache
  aws_metric_name: TrafficManagementActive
  aws_dimensions:
  - CacheNodeId
  - CacheClusterId
- aws_namespace: AWS/ElastiCache
  aws_metric_name: UnusedMemory
  aws_dimensions:
  - CacheNodeId
  - CacheClusterId
elb.yml
region: us-east-1
metrics:
- aws_dimensions:
  - AvailabilityZone
  aws_metric_name: BackendConnectionErrors
  aws_namespace: AWS/ELB
- aws_dimensions:
  - AvailabilityZone
  aws_metric_name: HTTPCode_Backend_5XX
  aws_namespace: AWS/ELB
- aws_dimensions:
  - AvailabilityZone
  aws_metric_name: HTTPCode_Backend_4XX
  aws_namespace: AWS/ELB
- aws_dimensions:
  - AvailabilityZone
  aws_metric_name: HTTPCode_Backend_3XX
  aws_namespace: AWS/ELB
- aws_dimensions:
  - AvailabilityZone
  aws_metric_name: HTTPCode_Backend_2XX
  aws_namespace: AWS/ELB
- aws_dimensions:
  - AvailabilityZone
  aws_metric_name: HTTPCode_ELB_5XX
  aws_namespace: AWS/ELB
- aws_dimensions:
  - AvailabilityZone
  aws_metric_name: RequestCount
  aws_namespace: AWS/ELB
- aws_dimensions:
  - AvailabilityZone
  aws_metric_name: HTTPCode_ELB_4XX
  aws_namespace: AWS/ELB
- aws_dimensions:
  - AvailabilityZone
  aws_metric_name: Latency
  aws_namespace: AWS/ELB
- aws_dimensions:
  - AvailabilityZone
  aws_metric_name: SurgeQueueLength
  aws_namespace: AWS/ELB
- aws_dimensions:
  - AvailabilityZone
  aws_metric_name: ActiveFlowCount
  aws_namespace: AWS/ELB
- aws_dimensions:
  - AvailabilityZone
  aws_metric_name: ActiveFlowCount_TLS
  aws_namespace: AWS/ELB
- aws_dimensions:
  - AvailabilityZone
  aws_metric_name: ProcessedBytes
  aws_namespace: AWS/ELB
- aws_dimensions:
  - AvailabilityZone
  aws_metric_name: ProcessedBytes_TLS
  aws_namespace: AWS/ELB
- aws_dimensions:
  - AvailabilityZone
  aws_metric_name: HealthyHostCount
  aws_namespace: AWS/ELB
- aws_dimensions:
  - AvailabilityZone
  aws_metric_name: UnHealthyHostCount
  aws_namespace: AWS/ELB
- aws_dimensions:
  - AvailabilityZone
  aws_metric_name: NewFlowCount
  aws_namespace: AWS/ELB
- aws_dimensions:
  - AvailabilityZone
  aws_metric_name: NewFlowCount_TLS
  aws_namespace: AWS/ELB
- aws_dimensions:
  - AvailabilityZone
  aws_metric_name: TCP_Client_Reset_Count
  aws_namespace: AWS/ELB
- aws_dimensions:
  - AvailabilityZone
  aws_metric_name: TCP_Target_Reset_Count
  aws_namespace: AWS/ELB
- aws_dimensions:
  - AvailabilityZone
  aws_metric_name: TCP_ELB_Reset_Count
  aws_namespace: AWS/ELB
- aws_dimensions:
  - AvailabilityZone
  aws_metric_name: ClientTLSNegotiationErrorCount
  aws_namespace: AWS/ELB
- aws_dimensions:
  - AvailabilityZone
  aws_metric_name: TargetTLSNegotiationErrorCount
  aws_namespace: AWS/ELB
- aws_dimensions:
  - AvailabilityZone
  aws_metric_name: ConsumedLCUs
  aws_namespace: AWS/ELB
- aws_dimensions:
  - AvailabilityZone
  aws_metric_name: SpilloverCount
  aws_namespace: AWS/ELB
kinesis.yml
region: us-east-2
metrics:
- aws_dimensions:
  - StreamName
  aws_metric_name: IncomingBytes
  aws_namespace: AWS/Kinesis
- aws_dimensions:
  - StreamName
  aws_metric_name: PutRecord.Bytes
  aws_namespace: AWS/Kinesis
- aws_dimensions:
  - StreamName
  aws_metric_name: PutRecords.Bytes
  aws_namespace: AWS/Kinesis
- aws_dimensions:
  - StreamName
  aws_metric_name: GetRecords.Latency
  aws_namespace: AWS/Kinesis
- aws_dimensions:
  - StreamName
  aws_metric_name: PutRecord.Success
  aws_namespace: AWS/Kinesis
- aws_dimensions:
  - StreamName
  aws_metric_name: PutRecords.Success
  aws_namespace: AWS/Kinesis
- aws_dimensions:
  - StreamName
  aws_metric_name: GetRecords.Latency
  aws_namespace: AWS/Kinesis
- aws_dimensions:
  - StreamName
  aws_metric_name: PutRecord.Latency
  aws_namespace: AWS/Kinesis
- aws_dimensions:
  - StreamName
  aws_metric_name: PutRecords.Latency
  aws_namespace: AWS/Kinesis
- aws_dimensions:
  - StreamName
  aws_metric_name: GetRecords.Latency
  aws_namespace: AWS/Kinesis
- aws_dimensions:
  - StreamName
  aws_metric_name: GetRecords.Records
  aws_namespace: AWS/Kinesis
- aws_dimensions:
  - StreamName
  aws_metric_name: GetRecords.Bytes
  aws_namespace: AWS/Kinesis
- aws_dimensions:
  - StreamName
  aws_metric_name: GetRecords.Success
  aws_namespace: AWS/Kinesis
- aws_dimensions:
  - StreamName
  aws_metric_name: GetRecords.IteratorAgeMilliseconds
  aws_namespace: AWS/Kinesis
- aws_dimensions:
  - StreamName
  aws_metric_name: IncomingRecords
  aws_namespace: AWS/Kinesis
- aws_dimensions:
  - StreamName
  aws_metric_name: IncomingBytes
  aws_namespace: AWS/Kinesis
- aws_dimensions:
  - StreamName
  aws_metric_name: WriteProvisionedThroughputExceeded
  aws_namespace: AWS/Kinesis
- aws_dimensions:
  - StreamName
  aws_metric_name: ReadProvisionedThroughputExceeded
  aws_namespace: AWS/Kinesis
lambda.yml
region: us-east-1
metrics:
- aws_dimensions:
  - FunctionName
  - Resource
  aws_metric_name: Invocations
  aws_namespace: AWS/Lambda
- aws_dimensions:
  - FunctionName
  - Resource
  aws_metric_name: Errors
  aws_namespace: AWS/Lambda
- aws_dimensions:
  - FunctionName
  - Resource
  aws_metric_name: Duration
  aws_namespace: AWS/Lambda
- aws_dimensions:
  - FunctionName
  - Resource
  aws_metric_name: Throttles
  aws_namespace: AWS/Lambda
- aws_dimensions:
  - FunctionName
  - Resource
  aws_metric_name: ConcurrentExecutions
  aws_namespace: AWS/Lambda
- aws_dimensions:
  - FunctionName
  - Resource
  aws_metric_name: UnreservedConcurrentExecutions
  aws_namespace: AWS/Lambda
networkelb.yml
region: us-east-1
metrics:
- aws_dimensions:
  - AvailabilityZone
  - LoadBalancer
  - TargetGroup
  aws_metric_name: ActiveFlowCount
  aws_namespace: AWS/NetworkELB
  aws_statistics:
  - Average
- aws_dimensions:
  - AvailabilityZone
  - LoadBalancer
  - TargetGroup
  aws_metric_name: ActiveFlowCount_TCP
  aws_namespace: AWS/NetworkELB
  aws_statistics:
  - Average
- aws_dimensions:
  - AvailabilityZone
  - LoadBalancer
  - TargetGroup
  aws_metric_name: ActiveFlowCount_UDP
  aws_namespace: AWS/NetworkELB
  aws_statistics:
  - Average
- aws_dimensions:
  - AvailabilityZone
  - LoadBalancer
  - TargetGroup
  aws_metric_name: ClientTLSNegotiationErrorCount
  aws_namespace: AWS/NetworkELB
  aws_statistics:
  - Sum
- aws_dimensions:
  - LoadBalancer
  aws_metric_name: ConsumedLCUs
  aws_namespace: AWS/NetworkELB
  aws_statistics:
  - Average
- aws_dimensions:
  - LoadBalancer
  aws_metric_name: ConsumedLCUs_TCP
  aws_namespace: AWS/NetworkELB
  aws_statistics:
  - Average
- aws_dimensions:
  - LoadBalancer
  aws_metric_name: ConsumedLCUs_TLS
  aws_namespace: AWS/NetworkELB
  aws_statistics:
  - Average
- aws_dimensions:
  - LoadBalancer
  aws_metric_name: ConsumedLCUs_UDP
  aws_namespace: AWS/NetworkELB
  aws_statistics:
  - Average
- aws_dimensions:
  - AvailabilityZone
  - LoadBalancer
  - TargetGroup
  aws_metric_name: HealthyHostCount
  aws_namespace: AWS/NetworkELB
  aws_statistics:
  - Minimum
- aws_dimensions:
  - AvailabilityZone
  - LoadBalancer
  - TargetGroup
  aws_metric_name: NewFlowCount
  aws_namespace: AWS/NetworkELB
  aws_statistics:
  - Sum
- aws_dimensions:
  - AvailabilityZone
  - LoadBalancer
  - TargetGroup
  aws_metric_name: NewFlowCount_TCP
  aws_namespace: AWS/NetworkELB
  aws_statistics:
  - Sum
- aws_dimensions:
  - AvailabilityZone
  - LoadBalancer
  - TargetGroup
  aws_metric_name: NewFlowCount_TLS
  aws_namespace: AWS/NetworkELB
  aws_statistics:
  - Sum
- aws_dimensions:
  - AvailabilityZone
  - LoadBalancer
  - TargetGroup
  aws_metric_name: NewFlowCount_UDP
  aws_namespace: AWS/NetworkELB
  aws_statistics:
  - Sum
- aws_dimensions:
  - AvailabilityZone
  - LoadBalancer
  - TargetGroup
  aws_metric_name: ProcessedBytes
  aws_namespace: AWS/NetworkELB
  aws_statistics:
  - Sum
- aws_dimensions:
  - AvailabilityZone
  - LoadBalancer
  - TargetGroup
  aws_metric_name: ProcessedBytes_TLS
  aws_namespace: AWS/NetworkELB
  aws_statistics:
  - Sum
- aws_dimensions:
  - AvailabilityZone
  - LoadBalancer
  - TargetGroup
  aws_metric_name: ProcessedBytes_UDP
  aws_namespace: AWS/NetworkELB
  aws_statistics:
  - Sum
- aws_dimensions:
  - AvailabilityZone
  - LoadBalancer
  - TargetGroup
  aws_metric_name: ProcessedPackets
  aws_namespace: AWS/NetworkELB
  aws_statistics:
  - Sum
- aws_dimensions:
  - AvailabilityZone
  - LoadBalancer
  - TargetGroup
  aws_metric_name: TargetTLSNegotiationErrorCount
  aws_namespace: AWS/NetworkELB
  aws_statistics:
  - Sum
- aws_dimensions:
  - AvailabilityZone
  - LoadBalancer
  - TargetGroup
  aws_metric_name: TCP_Client_Reset_Count
  aws_namespace: AWS/NetworkELB
  aws_statistics:
  - Sum
- aws_dimensions:
  - AvailabilityZone
  - LoadBalancer
  - TargetGroup
  aws_metric_name: TCP_Target_Reset_Count
  aws_namespace: AWS/NetworkELB
  aws_statistics:
  - Sum
- aws_dimensions:
  - AvailabilityZone
  - LoadBalancer
  - TargetGroup
  aws_metric_name: UnHealthyHostCount
  aws_namespace: AWS/NetworkELB
  aws_statistics:
  - Maximum
rds.yml
region: us-east-1
metrics:
- aws_dimensions:
  - DBInstanceIdentifier
  aws_metric_name: BinLogDiskUsage
  aws_namespace: AWS/RDS
- aws_dimensions:
  - DBInstanceIdentifier
  aws_metric_name: DatabaseConnections
  aws_namespace: AWS/RDS
- aws_dimensions:
  - DBInstanceIdentifier
  aws_metric_name: FreeStorageSpace
  aws_namespace: AWS/RDS
- aws_dimensions:
  - DBInstanceIdentifier
  aws_metric_name: FreeableMemory
  aws_namespace: AWS/RDS
- aws_dimensions:
  - DBInstanceIdentifier
  aws_metric_name: ReadIOPS
  aws_namespace: AWS/RDS
- aws_dimensions:
  - DBInstanceIdentifier
  aws_metric_name: WriteIOPS
  aws_namespace: AWS/RDS
- aws_dimensions:
  - DBInstanceIdentifier
  aws_metric_name: ReadLatency
  aws_namespace: AWS/RDS
- aws_dimensions:
  - DBInstanceIdentifier
  aws_metric_name: WriteLatency
  aws_namespace: AWS/RDS
- aws_dimensions:
  - DBInstanceIdentifier
  aws_metric_name: ReadThroughput
  aws_namespace: AWS/RDS
- aws_dimensions:
  - DBInstanceIdentifier
  aws_metric_name: WriteThroughput
  aws_namespace: AWS/RDS
- aws_dimensions:
  - DBInstanceIdentifier
  aws_metric_name: CPUCreditUsage
  aws_namespace: AWS/RDS
- aws_dimensions:
  - DBInstanceIdentifier
  aws_metric_name: ReplicaLag
  aws_namespace: AWS/RDS
- aws_dimensions:
  - DBInstanceIdentifier
  aws_metric_name: CPUUtilization
  aws_namespace: AWS/RDS
- aws_dimensions:
  - DBInstanceIdentifier
  aws_metric_name: CPUCreditBalance
  aws_namespace: AWS/RDS
- aws_dimensions:
  - DBInstanceIdentifier
  aws_metric_name: DiskQueueDepth
  aws_namespace: AWS/RDS
- aws_dimensions:
  - DBInstanceIdentifier
  aws_metric_name: NetworkTransmitThroughput
  aws_namespace: AWS/RDS
- aws_dimensions:
  - DBInstanceIdentifier
  aws_metric_name: NetworkReceiveThroughput
  aws_namespace: AWS/RDS
- aws_dimensions:
  - DBInstanceIdentifier
  aws_metric_name: TransactionLogsDiskUsage
  aws_namespace: AWS/RDS
- aws_dimensions:
  - DBInstanceIdentifier
  aws_metric_name: SwapUsage
  aws_namespace: AWS/RDS
- aws_dimensions:
  - EngineName
  aws_metric_name: BinLogDiskUsage
  aws_namespace: AWS/RDS
- aws_dimensions:
  - EngineName
  aws_metric_name: DatabaseConnections
  aws_namespace: AWS/RDS
- aws_dimensions:
  - EngineName
  aws_metric_name: FreeStorageSpace
  aws_namespace: AWS/RDS
- aws_dimensions:
  - EngineName
  aws_metric_name: FreeableMemory
  aws_namespace: AWS/RDS
- aws_dimensions:
  - EngineName
  aws_metric_name: ReadIOPS
  aws_namespace: AWS/RDS
- aws_dimensions:
  - EngineName
  aws_metric_name: WriteIOPS
  aws_namespace: AWS/RDS
- aws_dimensions:
  - EngineName
  aws_metric_name: ReadLatency
  aws_namespace: AWS/RDS
- aws_dimensions:
  - EngineName
  aws_metric_name: WriteLatency
  aws_namespace: AWS/RDS
- aws_dimensions:
  - EngineName
  aws_metric_name: ReadThroughput
  aws_namespace: AWS/RDS
- aws_dimensions:
  - EngineName
  aws_metric_name: WriteThroughput
  aws_namespace: AWS/RDS
- aws_dimensions:
  - EngineName
  aws_metric_name: CPUCreditUsage
  aws_namespace: AWS/RDS
- aws_dimensions:
  - EngineName
  aws_metric_name: ReplicaLag
  aws_namespace: AWS/RDS
- aws_dimensions:
  - EngineName
  aws_metric_name: CPUUtilization
  aws_namespace: AWS/RDS
- aws_dimensions:
  - EngineName
  aws_metric_name: CPUCreditBalance
  aws_namespace: AWS/RDS
- aws_dimensions:
  - EngineName
  aws_metric_name: DiskQueueDepth
  aws_namespace: AWS/RDS
- aws_dimensions:
  - EngineName
  aws_metric_name: NetworkTransmitThroughput
  aws_namespace: AWS/RDS
- aws_dimensions:
  - EngineName
  aws_metric_name: NetworkReceiveThroughput
  aws_namespace: AWS/RDS
- aws_dimensions:
  - EngineName
  aws_metric_name: TransactionLogsDiskUsage
  aws_namespace: AWS/RDS
- aws_dimensions:
  - EngineName
  aws_metric_name: SwapUsage
  aws_namespace: AWS/RDS
- aws_dimensions:
  - DatabaseClass
  aws_metric_name: BinLogDiskUsage
  aws_namespace: AWS/RDS
- aws_dimensions:
  - DatabaseClass
  aws_metric_name: DatabaseConnections
  aws_namespace: AWS/RDS
- aws_dimensions:
  - DatabaseClass
  aws_metric_name: FreeStorageSpace
  aws_namespace: AWS/RDS
- aws_dimensions:
  - DatabaseClass
  aws_metric_name: FreeableMemory
  aws_namespace: AWS/RDS
- aws_dimensions:
  - DatabaseClass
  aws_metric_name: ReadIOPS
  aws_namespace: AWS/RDS
- aws_dimensions:
  - DatabaseClass
  aws_metric_name: WriteIOPS
  aws_namespace: AWS/RDS
- aws_dimensions:
  - DatabaseClass
  aws_metric_name: ReadLatency
  aws_namespace: AWS/RDS
- aws_dimensions:
  - DatabaseClass
  aws_metric_name: WriteLatency
  aws_namespace: AWS/RDS
- aws_dimensions:
  - DatabaseClass
  aws_metric_name: ReadThroughput
  aws_namespace: AWS/RDS
- aws_dimensions:
  - DatabaseClass
  aws_metric_name: WriteThroughput
  aws_namespace: AWS/RDS
- aws_dimensions:
  - DatabaseClass
  aws_metric_name: CPUCreditUsage
  aws_namespace: AWS/RDS
- aws_dimensions:
  - DatabaseClass
  aws_metric_name: ReplicaLag
  aws_namespace: AWS/RDS
- aws_dimensions:
  - DatabaseClass
  aws_metric_name: CPUUtilization
  aws_namespace: AWS/RDS
- aws_dimensions:
  - DatabaseClass
  aws_metric_name: CPUCreditBalance
  aws_namespace: AWS/RDS
- aws_dimensions:
  - DatabaseClass
  aws_metric_name: DiskQueueDepth
  aws_namespace: AWS/RDS
- aws_dimensions:
  - DatabaseClass
  aws_metric_name: NetworkTransmitThroughput
  aws_namespace: AWS/RDS
- aws_dimensions:
  - DatabaseClass
  aws_metric_name: NetworkReceiveThroughput
  aws_namespace: AWS/RDS
- aws_dimensions:
  - DatabaseClass
  aws_metric_name: TransactionLogsDiskUsage
  aws_namespace: AWS/RDS
- aws_dimensions:
  - DatabaseClass
  aws_metric_name: SwapUsage
  aws_namespace: AWS/RDS
redshift.yml
region: us-east-2
metrics:
- aws_dimensions:
  - ClusterIdentifier
  - NodeID
  aws_metric_name: HealthStatus
  aws_namespace: AWS/Redshift
- aws_dimensions:
  - ClusterIdentifier
  - NodeID
  aws_metric_name: CPUUtilization
  aws_namespace: AWS/Redshift
- aws_dimensions:
  - ClusterIdentifier
  - NodeID
  aws_metric_name: DatabaseConnections
  aws_namespace: AWS/Redshift
- aws_dimensions:
  - ClusterIdentifier
  - NodeID
  aws_metric_name: MaintenanceMode
  aws_namespace: AWS/Redshift
- aws_dimensions:
  - ClusterIdentifier
  - NodeID
  aws_metric_name: NetworkReceiveThroughput
  aws_namespace: AWS/Redshift
- aws_dimensions:
  - ClusterIdentifier
  - NodeID
  aws_metric_name: NetworkTransmitThroughput
  aws_namespace: AWS/Redshift
- aws_dimensions:
  - ClusterIdentifier
  - NodeID
  aws_metric_name: ReadIOPS
  aws_namespace: AWS/Redshift
- aws_dimensions:
  - ClusterIdentifier
  - NodeID
  aws_metric_name: WriteIOPS
  aws_namespace: AWS/Redshift
- aws_dimensions:
  - ClusterIdentifier
  - NodeID
  aws_metric_name: ReadLatency
  aws_namespace: AWS/Redshift
- aws_dimensions:
  - ClusterIdentifier
  - NodeID
  aws_metric_name: WriteLatency
  aws_namespace: AWS/Redshift
- aws_dimensions:
  - ClusterIdentifier
  - NodeID
  aws_metric_name: ReadThroughput
  aws_namespace: AWS/Redshift
- aws_dimensions:
  - ClusterIdentifier
  - NodeID
  aws_metric_name: WriteThroughput
  aws_namespace: AWS/Redshift
- aws_dimensions:
  - ClusterIdentifier
  - NodeID
  aws_metric_name: QueryDuration
  aws_namespace: AWS/Redshift
- aws_dimensions:
  - ClusterIdentifier
  - NodeID
  aws_metric_name: QueriesCompletedPerSecond
  aws_namespace: AWS/Redshift
- aws_dimensions:
  - ClusterIdentifier
  - NodeID
  aws_metric_name: PercentageDiskSpaceUsed
  aws_namespace: AWS/Redshift
s3.yml
region: us-east-1
metrics:
- aws_dimensions:
  - BucketName
  - FilterId
  aws_metric_name: 4xxErrors
  aws_namespace: AWS/S3
- aws_dimensions:
  - BucketName
  - FilterId
  aws_metric_name: 5xxErrors
  aws_namespace: AWS/S3
- aws_dimensions:
  - BucketName
  - FilterId
  aws_metric_name: AllRequests
  aws_namespace: AWS/S3
- aws_dimensions:
  - BucketName
  - FilterId
  aws_metric_name: FirstByteLatency
  aws_namespace: AWS/S3
- aws_dimensions:
  - BucketName
  - FilterId
  aws_metric_name: TotalRequestLatency
  aws_namespace: AWS/S3
- aws_dimensions:
  - BucketName
  - FilterId
  aws_metric_name: BytesDownloaded
  aws_namespace: AWS/S3
- aws_dimensions:
  - BucketName
  - FilterId
  aws_metric_name: BytesUploaded
  aws_namespace: AWS/S3
- aws_dimensions:
  - BucketName
  - FilterId
  aws_metric_name: PutRequests
  aws_namespace: AWS/S3
- aws_dimensions:
  - BucketName
  - FilterId
  aws_metric_name: ListRequests
  aws_namespace: AWS/S3
- aws_dimensions:
  - BucketName
  - FilterId
  aws_metric_name: HeadRequests
  aws_namespace: AWS/S3
- aws_dimensions:
  - BucketName
  - FilterId
  aws_metric_name: GetRequests
  aws_namespace: AWS/S3
- aws_namespace: AWS/S3
  aws_metric_name: BucketSizeBytes
  aws_dimensions: [BucketName, StorageType]
  range_seconds: 172800
  period_seconds: 86400
  set_timestamp: false
- aws_namespace: AWS/S3
  aws_metric_name: NumberOfObjects
  aws_dimensions: [BucketName, StorageType]
  range_seconds: 172800
  period_seconds: 86400
  set_timestamp: false
  # In case you want to use some bucket level Tag to select buckets to monitor,
  # or to have additional `info` metric with all bucket Tags as labels, use `aws_tag_select`:
  aws_tag_select:
    tag_selections:
      Monitoring: ["enabled"]
    resource_type_selection: "s3:"
    resource_id_dimension: BucketName
ses.yml
region: us-east-1
metrics:
- aws_namespace: AWS/SES
  aws_metric_name: Bounce
  aws_dimensions: []
  aws_statistics: []
- aws_namespace: AWS/SES
  aws_metric_name: Complaint
  aws_dimensions: []
  aws_statistics: []
- aws_namespace: AWS/SES
  aws_metric_name: Delivery
  aws_dimensions: []
  aws_statistics: []
- aws_namespace: AWS/SES
  aws_metric_name: Reputation.BounceRate
  aws_dimensions: []
  aws_statistics: []
- aws_namespace: AWS/SES
  aws_metric_name: Reputation.ComplaintRate
  aws_dimensions: []
  aws_statistics: []
- aws_namespace: AWS/SES
  aws_metric_name: Send
  aws_dimensions: []
  aws_statistics: []
- aws_namespace: AWS/SES
  aws_metric_name: Reject
  aws_dimensions: []
  aws_statistics: []
sns.yml
region: us-east-1
metrics:
- aws_dimensions:
  - TopicName
  - Platform
  aws_metric_name: NumberOfMessagesPublished
  aws_namespace: AWS/SNS
  aws_statistics:
  - Sum
- aws_dimensions:
  - TopicName
  - Platform
  aws_metric_name: NumberOfNotificationsDelivered
  aws_namespace: AWS/SNS
  aws_statistics:
  - Sum
- aws_dimensions:
  - TopicName
  - Platform
  aws_metric_name: NumberOfNotificationsFailed
  aws_namespace: AWS/SNS
  aws_statistics:
  - Sum
- aws_dimensions:
  - TopicName
  - Platform
  aws_metric_name: PublishSize
  aws_namespace: AWS/SNS
  aws_statistics:
  - Average
  - Sum
  - Maximum
  - Minimum
  - Count
- aws_dimensions:
  - TopicName
  - Platform
  aws_metric_name: NumberOfNotificationsFilteredOut
  aws_namespace: AWS/SNS
  aws_statistics:
  - Sum
sqs.yml
region: us-east-1
metrics:
- aws_dimensions:
  - QueueName
  aws_metric_name: NumberOfMessagesSent
  aws_namespace: AWS/SQS
  aws_statistics:
  - Average
  - Minimum
  - Maximum
  - SampleCount
  - Sum
- aws_dimensions:
  - QueueName
  aws_metric_name: NumberOfMessagesReceived
  aws_namespace: AWS/SQS
  aws_statistics:
  - Average
  - Minimum
  - Maximum
  - SampleCount
  - Sum
- aws_dimensions:
  - QueueName
  aws_metric_name: NumberOfEmptyReceives
  aws_namespace: AWS/SQS
  aws_statistics:
  - Average
  - Minimum
  - Maximum
  - SampleCount
  - Sum
- aws_dimensions:
  - QueueName
  aws_metric_name: NumberOfMessagesDeleted
  aws_namespace: AWS/SQS
  aws_statistics:
  - Average
- aws_dimensions:
  - QueueName
  aws_metric_name: ApproximateNumberOfMessagesDelayed
  aws_namespace: AWS/SQS
  aws_statistics:
  - Average
  - Minimum
  - Maximum
  - SampleCount
  - Sum
- aws_dimensions:
  - QueueName
  aws_metric_name: ApproximateAgeOfOldestMessage
  aws_namespace: AWS/SQS
  aws_statistics:
  - Average
  - Minimum
  - Maximum
  - SampleCount
  - Sum
- aws_dimensions:
  - QueueName
  aws_metric_name: ApproximateNumberOfMessagesNotVisible
  aws_namespace: AWS/SQS
  aws_statistics:
  - Average
  - Minimum
  - Maximum
  - SampleCount
  - Sum
- aws_dimensions:
  - QueueName
  aws_metric_name: ApproximateNumberOfMessagesVisible
  aws_namespace: AWS/SQS
  aws_statistics:
  - Average
  - Minimum
  - Maximum
  - SampleCount
  - Sum
- aws_dimensions:
  - QueueName
  aws_metric_name: SentMessageSize
  aws_namespace: AWS/SQS
  aws_statistics:
  - Average
  - Minimum
  - Maximum
  - SampleCount
  - Sum