This document describes the configuration and use of an Ops Agent metrics receiver that you can use to collect metrics from Prometheus on Compute Engine. This document also describes an example that you can use to try the receiver.
Users of Google Kubernetes Engine have been able to collect Prometheus metrics by using Google Cloud Managed Service for Prometheus. The Ops Agent Prometheus receiver gives users of Compute Engine the same capability.
You can use all of the tools provided by Cloud Monitoring, including PromQL, to view and analyze the data collected by the Prometheus receiver. For example, you can use Metrics Explorer, as described in Google Cloud console for Monitoring, to query your data. You can also create Cloud Monitoring dashboards and alerting policies to monitor your Prometheus metrics. We recommend using PromQL as the query language for your Prometheus metrics.
You can also view your Prometheus metrics in interfaces outside Cloud Monitoring, like the Prometheus UI and Grafana.
Choose the right receiver
Before you decide to use the Prometheus receiver, determine if there is already an Ops Agent integration for the application you are using. For information on the existing integrations with the Ops Agent, see Monitoring third-party applications. If there is an existing integration, we recommend using it. For more information, see Choosing an existing integration.
We recommend using the Ops Agent Prometheus receiver when the following are true:
You have experience using Prometheus, rely on the Prometheus standard, and understand how factors like scraping interval and cardinality can affect your costs. For more information, see Choosing the Prometheus receiver.
The software you are monitoring isn't already part of the set of existing Ops Agent integrations.
Existing integrations
The Ops Agent provides integrations for a number of third-party applications. These integrations provide the following for you:
- A set of selected
workload.googleapis.commetrics for the application - A dashboard for visualizing the metrics.
The metrics ingested by using an existing integration are subject to byte-based pricing for agent-collected metrics. For information about this pricing, see Metrics charged by bytes ingested. The number and types of the metrics is known in advance, and you can use that information to estimate costs.
For example, if you are using the Apache Web Server (httpd) integration, the Ops Agent collects five scalar metrics; each data point counts as 8 bytes. If you keep the Ops Agent default sampling frequency of 60 seconds, the number of bytes ingested per day is 57,600 * the number of hosts:
- 8 (bytes) * 1440 (minutes per day) * 5 (metrics) * n (hosts), or
- 57,600 * n (hosts)
For more information about estimating costs, see Pricing examples based on bytes ingested.
The Prometheus receiver
When you use the Ops Agent to collect Prometheus metrics, the following apply:
The number and cardinality of metrics emitted by your application are under your control. There is no curated set of metrics. How much data you ingest is determined by the configuration of your Prometheus application and the Ops Agent Prometheus receiver.
Metrics are ingested into Cloud Monitoring as
prometheus.googleapis.commetrics. These metrics are classified as a type of "custom" metrics when ingested into Cloud Monitoring and are subject to the quotas and limits for custom metrics.You must design and create any Cloud Monitoring dashboards you need, based on the set of metrics you are ingesting and on your business needs. For information about creating dashboards, see Dashboards and charts.
Pricing for metric ingestion is based on the number of Metrics charged by samples ingested. To estimate your costs when using the Prometheus receiver, you need to determine the number of samples you are likely to collect during a billing cycle. The estimate is based on the following factors:
- Number of scalar metrics; each value is one sample
- Number of distribution metrics; each histogram counts as (2 + number of buckets in the histogram) samples
- Sampling frequency of each metric
- Number of hosts from which the metrics are sampled
For more information about counting samples and estimating costs, see Pricing examples based on samples ingested.
Prerequisites
To collect Prometheus metrics by using the Prometheus receiver, you must install the Ops Agent version 2.25.0 or higher.
The Ops Agent receiver requires an endpoint that emits Prometheus metrics. Therefore, your application must either provide such an endpoint directly or use a Prometheus library or exporter to expose an endpoint. Many libraries and language frameworks like Spring and DropWizard, or applications like StatsD, DogStatsD, and Graphite, that emit non-Prometheus metrics can use Prometheus client libraries or exporters to emit Prometheus-style metrics. For example, to emit Prometheus metrics:
- Spring users can use the Spring Metrics library.
- StatsD users can use the
statsd_exporterpackage. - Graphite users can use the
graphite_exporterpackage.
When Prometheus metrics are emitted by an application, directly or by using a library or exporter, the metrics can then be collected by an Ops Agent configured with a Prometheus receiver.
Configure the Ops Agent
The Ops Agent configuration model typically involves defining the following:
- Receivers, which determine which metrics are collected.
- Processors, which describe how the Ops Agent can modify the metrics.
- Pipelines, which link receivers and processors together into a service.
The configuration for ingesting Prometheus metrics is slightly different: there are no processors involved.
Configuration for Prometheus metrics
Configuring the Ops Agent to ingest Prometheus metrics differs from the usual configuration as follows:
You don't create an Ops Agent processor for Prometheus metrics. The Prometheus receiver supports nearly all of the configuration options specified by the Prometheus
scrape_configspecification, including relabeling options.Instead of using an Ops Agent processor, any metrics processing is done by using the
relabel_configsandmetric_relabel_configssections of the scape config, as specified in the Prometheus receiver. For more information, see Relabeling: Modifying the data being scraped.You define the Prometheus pipeline in terms of the Prometheus receiver only. You don't specify any processors. You also can't use any non-Prometheus receivers in the pipeline for Prometheus metrics.
The majority of the receiver configuration is the specification of scrape-config options. Omitting those options for brevity, the following shows the structure of an Ops Agent configuration that uses a Prometheus receiver. You specify the values of the RECEIVER_ID and PIPELINE_ID.
metrics:
  receivers:
    RECEIVER_ID:
      type: prometheus
      config:
        scrape_configs:
          [... omitted for brevity ...]

  service:
    pipelines:
      PIPELINE_ID:
        receivers: [RECEIVER_ID]
The following section describes the Prometheus receiver in more detail. For a functional example of a receiver and pipeline, see Add the Ops Agent receiver and pipeline.
The Prometheus receiver
To specify a receiver for Prometheus metrics, you create a metrics
receiver of type prometheus and specify a set of scrape_config options.
The receiver supports all of the Prometheus
scrape_config options,
with the exception of the following:
- The service-discovery sections,
*_sd_config. - The
honor_labelssetting.
Therefore, you can copy over existing scrape configs and use them for the Ops Agent with little or no modification.
The full structure of the Prometheus receiver is shown in the following:
metrics:
  receivers:
    prom_application:
      type: prometheus
      config:
        scrape_configs:
          - job_name: 'STRING' # must be unique across all Prometheus receivers
              scrape_interval: # duration, like 10m or 15s
              scrape_timeout:  # duration, like 10m or 15s
              metrics_path: # resource path for metrics, default = /metrics
              honor_timestamps: # boolean, default = false
              scheme: # http or https, default = http
              params:
                - STRING: STRING
              basic_auth:
                username: STRING
                password: SECRET
                password_file: STRING
              authorization:
                type: STRING # default = Bearer
                credentials: SECRET
                credentials_file: FILENAME

              oauth2: OAUTH2 # See Prometheus oauth2
              follow_redirects: # boolean, default = true
              enable_http2: # boolean, default = true
              tls_config: TLS_CONFIG # See Prometheus tls_config
              proxy_url: STRING

              static_configs:
                STATIC_CONFIG # See Prometheus static_config
              relabel_configs:
                RELABEL_CONFIG # See Prometheus relabel_config
              metric_relabel_configs:
                METRIC_RELABEL_CONFIGS # See Prometheus metric_relabel_configs
For examples of relabeling configs, see Additional receiver configuration.
Example: Configure the Ops Agent for Prometheus
This section shows an example of how to configure the Ops Agent to collect
Prometheus metrics from an application. This example uses the Prometheus
community-provided JSON Exporter
(json_exporter), which
exposes Prometheus metrics on port 7979.
Setting up the example requires the following resources, which you might have to install:
gitcurlmakepython3- Go language, version 1.19 or higher
Create or configure your application
To obtain and run the JSON Exporter, use the following procedure:
Clone the
json_exporterrepository and check out the exporter by running the following commands:git clone https://github.com/prometheus-community/json_exporter.git cd json_exporter git checkout v0.5.0
Build the exporter by running the following command:
make build
Start the Python HTTP server by running the following command:
python3 -m http.server 8000 &
Start the JSON Exporter by running the following command:
./json_exporter --config.file examples/config.yml &
Query the JSON Exporter to verify that it is running and exposing metrics on port 7979:
curl "http://localhost:7979/probe?module=default&target=http://localhost:8000/examples/data.json"
If the query was successful, then you see output that resembles the following:
# HELP example_global_value Example of a top-level global value scrape in the json
# TYPE example_global_value untyped
example_global_value{environment="beta",location="planet-mars"} 1234
# HELP example_value_active Example of sub-level value scrapes from a json
# TYPE example_value_active untyped
example_value_active{environment="beta",id="id-A"} 1
example_value_active{environment="beta",id="id-C"} 1
# HELP example_value_boolean Example of sub-level value scrapes from a json
# TYPE example_value_boolean untyped
example_value_boolean{environment="beta",id="id-A"} 1
example_value_boolean{environment="beta",id="id-C"} 0
# HELP example_value_count Example of sub-level value scrapes from a json
# TYPE example_value_count untyped
example_value_count{environment="beta",id="id-A"} 1
example_value_count{environment="beta",id="id-C"} 3
In this output, the strings like
example_value_activeare the metric names, with labels and values in braces. The data value follows the label set.
Add the Ops Agent receiver and pipeline
To configure the Ops Agent to ingest metrics from the JSON Exporter application, you must modify the agent's configuration to add a Prometheus receiver and pipeline. For the JSON Exporter example, use the following procedure:
Edit the Ops Agent configuration file,
/etc/google-cloud-ops-agent/config.yaml, and add the following Prometheus receiver and pipeline entries:metrics: receivers: prometheus: type: prometheus config: scrape_configs: - job_name: 'json_exporter' scrape_interval: 10s metrics_path: /probe params: module: [default] target: [http://localhost:8000/examples/data.json] static_configs: - targets: ['localhost:7979'] service: pipelines: prometheus_pipeline: receivers: - prometheusIf you have other configuration entries in this file already, add the Prometheus receiver and pipeline to the existing
metricsandserviceentries. For more information, see Metrics configurations.For examples of relabeling configs in the receiver, see Additional receiver configuration.
Restart the Ops Agent
To apply your configuration changes, you must restart the Ops Agent.
LINUX
To restart the agent, run the following command on your instance:
sudo service google-cloud-ops-agent restart
To confirm that the agent restarted, run the following command and verify that the components "Metrics Agent" and "Logging Agent" started:
sudo systemctl status google-cloud-ops-agent"*"
Windows
Connect to your instance using RDP or a similar tool and login to Windows.
Open a PowerShell terminal with administrator privileges by right-clicking the PowerShell icon and selecting Run as Administrator.
To restart the agent, run the following PowerShell command:
Restart-Service google-cloud-ops-agent -Force
To confirm that the agent restarted, run the following command and verify that the components "Metrics Agent" and "Logging Agent" started:
Get-Service google-cloud-ops-agent*
Prometheus metrics in Cloud Monitoring
You can use the tools provided by Cloud Monitoring with the data collected by the Prometheus receiver. For example, you can chart data by using Metrics Explorer, as described in Google Cloud console for Monitoring. The following sections describe the query tools available in Cloud Monitoring with Metrics Explorer:
You can create Cloud Monitoring dashboards and alerting policies for your metrics. For information about dashboards and the types of charts you can use, see Dashboards and charts. For information about alerting policies, see Using alerting policies.
You can also view your metrics in other interfaces, like the Prometheus UI and Grafana. For information about setting up these interfaces, see the following sections in the Google Cloud Managed Service for Prometheus documentation:
Use PromQL
PromQL is the recommended query language for metrics ingested by using the Prometheus receiver.
The simplest way to verify that your Prometheus data is being ingested is to use the Cloud Monitoring Metrics Explorer page in the Google Cloud console:
-
In the Google Cloud console, go to the leaderboard Metrics explorer page:
If you use the search bar to find this page, then select the result whose subheading is Monitoring.
In the toolbar of the query-builder pane, select the button whose name is either code MQL or code PromQL.
Verify that PromQL is selected in the Language toggle. The language toggle is in the same toolbar that lets you format your query.
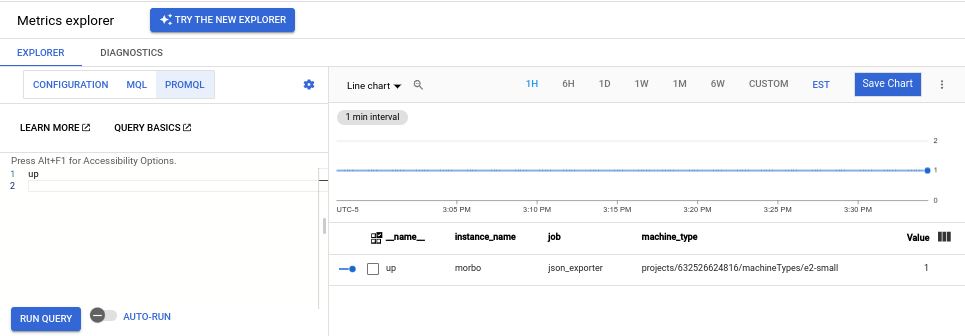
Enter the following query into the editor, and then click Run query:
up
If your data is being ingested, then you see a chart like the following:
If you are running the JSON Exporter example, then you can also issue queries like the following:
Query all data for a specific exported metric by name, for example:
example_value_count
The following shows a chart for the
example_value_count, including labels defined by the JSON Exporter application and labels added by the Ops Agent: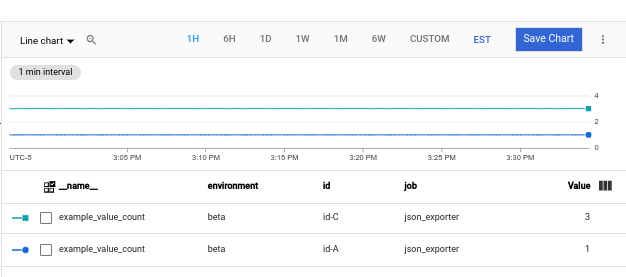
Query data for an exported metric that originated in a specific namespace. The value of the
namespacelabel is the Compute Engine instance ID, a long number like5671897148133813325, assigned to the VM. A query looks like the following:example_value_count{namespace="INSTANCE_ID"}Query data that matches a specific regular expression. The JSON Exporter emits metrics with an
idlabel that has values likeid-A,id-B,id-C. To filter for any metrics with anidlabel matching this pattern, use the following query:example_value_count{id=~"id.*"}
For more information about using PromQL in Metrics Explorer and Cloud Monitoring charts, see PromQL in Cloud Monitoring.
View metric usage and diagnostics in Cloud Monitoring
The Cloud Monitoring Metrics Management page provides information that can help you control the amount you spend on billable metrics without affecting observability. The Metrics Management page reports the following information:
- Ingestion volumes for both byte- and sample-based billing, across metric domains and for individual metrics.
- Data about labels and cardinality of metrics.
- Number of reads for each metric.
- Use of metrics in alerting policies and custom dashboards.
- Rate of metric-write errors.
You can also use the Metrics Management page to exclude unneeded metrics, eliminating the cost of ingesting them.
To view the Metrics Management page, do the following:
-
In the Google Cloud console, go to the Metrics management page:
If you use the search bar to find this page, then select the result whose subheading is Monitoring.
- In the toolbar, select your time window. By default, the Metrics Management page displays information about the metrics collected in the previous one day.
For more information about the Metrics Management page, see View and manage metric usage.
Relabeling: Modifying the data being scraped
You can use relabeling to modify the label set of the scrape target or its metrics before the target is scraped. If you have multiple steps in a relabeling config, they are applied in the order in which they appear in the configuration file.
The Ops Agent creates a set of meta labels (labels prefixed with the
string __meta_. These meta labels record information about the
Compute Engine instance on which the Ops Agent
is running. Labels prefixed with the __ string, including the meta labels,
are available only during relabeling. You can use relabeling to capture the
values of these labels in labels that are scraped.
Metric relabeling is applied to samples; it is the last step before ingestion. You can use metric relabeling to drop time series that you don't need to ingest; dropping these time series reduces the number of samples ingested, which can lower costs.
For more information about relabeling, see the Prometheus documentation
for relabel_config and
metric_relabel_configs.
Compute Engine meta labels available during relabeling
When the Ops Agent scrapes metrics, it includes a set of meta labels whose
values are based on the configuration of the Compute Engine VM on which
the agent is running. You can use these labels and the Prometheus receiver's
relabel_configs section to add additional metadata to your metrics about
the VM from which they were ingested. For an example, see
Additional receiver configuration.
The following meta labels are available on targets for you to use in the
relabel_configs section:
__meta_gce_instance_id: the numeric ID of the Compute Engine instance (local)__meta_gce_instance_name: the name of the Compute Engine instance (local); the Ops Agent automatically places this value in the mutableinstance_namelabel on your metrics.__meta_gce_machine_type: full or partial URL of the machine type of the instance; the Ops Agent automatically places this value in the mutablemachine_typelabel on your metrics.__meta_gce_metadata_NAME: each metadata item of the instance__meta_gce_network: the network URL of the instance__meta_gce_private_ip: the private IP address of the instance__meta_gce_interface_ipv4_NAME: IPv4 address of each named interface__meta_gce_project: the Google Cloud project in which the instance is running (local)__meta_gce_public_ip: the public IP address of the instance, if present__meta_gce_tags: comma separated list of instance tags__meta_gce_zone: the Compute Engine zone URL in which the instance is running
The values of these labels are set when the Ops Agent starts. If you modify the values, then you have to restart the Ops Agent to refresh the values.
Additional receiver configuration
This section provides examples that use the relabel_configs and
metric_relabel_configs sections of the Prometheus receiver to modify
the number and structure of the metrics ingested. This section also includes
a modified version of the receiver for the JSON Exporter example that uses
the relabeling options.
Add VM metadata
You can use the relabel_configs section to add labels to metrics.
For example, the following uses a meta label, __meta_gce_zone,
provided by the Ops Agent to create a metric label, zone, that
is preserved after relabeling, because zone does not have
the __ prefix.
For a list of available meta labels, see Compute Engine meta labels available during relabeling. Some of the meta labels are relabelled for you by the default Ops Agent configuration.
relabel_configs:
  - source_labels: [__meta_gce_zone]
    regex: '(.+)'
    replacement: '${1}'
    target_label: zone
The Prometheus receiver shown in Example: Configure the Ops Agent for Prometheus includes the addition of this label.
Drop metrics
You can use the metrics_relabel_configs section to drop metrics that
you do not want to ingest; this pattern is useful for cost containment.
For example, you can use the following pattern to drop any metric with
a namesthat matches METRIC_NAME_REGEX_1 or METRIC_NAME_REGEX_2:
metric_relabel_configs:
  - source_labels: [ __name__ ]
    regex: 'METRIC_NAME_REGEX_1'
    action: drop
  - source_labels: [ __name__ ]
    regex: 'METRIC_NAME_REGEX_2'
    action: drop
Add static labels
You can use the metrics_relabel_configs section to add static labels to
all metrics ingested by the Prometheus receiver. You can use the following
pattern to add labels staticLabel1 and staticLabel2 to all ingested metrics:
metric_relabel_configs:
  - source_labels: [ __address__ ]
    action: replace
    replacement: 'STATIC_VALUE_1'
    target_label: staticLabel1
  - source_labels: [ __address__ ]
    action: replace
    replacement: 'STATIC_VALUE_2'
    target_label: staticLabel2
The following version of the Prometheus receiver for the JSON Exporter example uses these configuration patterns to do the following:
- Set the
zonelabel from the value of the__meta_gce_zonemeta label provided by the Ops Agent. - Drop the exporter's
example_global_valuemetric. - Add the
staticLabellabel with the value "A static value" to all ingested metrics.
metrics:
  receivers:
    prometheus:
        type: prometheus
        config:
          scrape_configs:
            - job_name: 'json_exporter'
              scrape_interval: 10s
              metrics_path: /probe
              params:
                module: [default]
                target: [http://localhost:8000/examples/data.json]
              static_configs:
                - targets: ['localhost:7979']
              relabel_configs:
                - source_labels: [__meta_gce_zone]
                  regex: '(.+)'
                  replacement: '${1}'
                  target_label: zone
              metric_relabel_configs:
                - source_labels: [ __name__ ]
                  regex: 'example_global_value'
                  action: drop
                - source_labels: [ __address__ ]
                  action: replace
                  replacement: 'A static value'
                  target_label: staticLabel