After you have deployed Google Cloud Managed Service for Prometheus, you can query the data sent to the managed service and display the results in charts and dashboards.
This document describes metrics scopes, which determine the data you can query, and how to use Grafana to retrieve and use the data you've collected.
All query interfaces for Managed Service for Prometheus are configured to retrieve data from Monarch using the Cloud Monitoring API. By querying Monarch instead of querying data from local Prometheus servers, you get global monitoring at scale.
Before you begin
If you have not already deployed the managed service, then set up managed collection or self-deployed collection. You can skip this if you're only interested in querying Cloud Monitoring metrics using PromQL.
Configure your environment
To avoid repeatedly entering your project ID or cluster name, perform the following configuration:
Configure the command-line tools as follows:
Configure the gcloud CLI to refer to the ID of your Google Cloud project:
gcloud config set project PROJECT_ID
Configure the
kubectlCLI to use your cluster:kubectl config set-cluster CLUSTER_NAME
For more information about these tools, see the following:
Set up a namespace
Create the NAMESPACE_NAME Kubernetes namespace for resources you create
as part of the example application:
kubectl create ns NAMESPACE_NAME
Verify service account credentials
If your Kubernetes cluster has Workload Identity Federation for GKE enabled, then you can skip this section.
When running on GKE, Managed Service for Prometheus
automatically retrieves credentials from the environment based on the
Compute Engine default service account. The default service account has the
necessary permissions, monitoring.metricWriter and monitoring.viewer, by
default. If you don't use Workload Identity Federation for GKE, and you have previously
removed either of those roles from the default node service account, you will
have to re-add those missing permissions before continuing.
Configure a service account for Workload Identity Federation for GKE
If your Kubernetes cluster doesn't have Workload Identity Federation for GKE enabled, then you can skip this section.
Managed Service for Prometheus captures metric data by using the Cloud Monitoring API. If your cluster is using Workload Identity Federation for GKE, you must grant your Kubernetes service account permission to the Monitoring API. This section describes the following:
- Creating a dedicated Google Cloud service account,
gmp-test-sa. - Binding the Google Cloud service account to the default Kubernetes
service account in a test namespace,
NAMESPACE_NAME. - Granting the necessary permission to the Google Cloud service account.
Create and bind the service account
This step appears in several places in the Managed Service for Prometheus documentation. If you have already performed this step as part of a prior task, then you don't need to repeat it. Skip ahead to Authorize the service account.
The following command sequence creates the gmp-test-sa service account
and binds it to the default Kubernetes service account in the
NAMESPACE_NAME namespace:
gcloud config set project PROJECT_ID \
&&
gcloud iam service-accounts create gmp-test-sa \
&&
gcloud iam service-accounts add-iam-policy-binding \
  --role roles/iam.workloadIdentityUser \
  --member "serviceAccount:PROJECT_ID.svc.id.goog[NAMESPACE_NAME/default]" \
  gmp-test-sa@PROJECT_ID.iam.gserviceaccount.com \
&&
kubectl annotate serviceaccount \
  --namespace NAMESPACE_NAME \
  default \
  iam.gke.io/gcp-service-account=gmp-test-sa@PROJECT_ID.iam.gserviceaccount.com
If you are using a different GKE namespace or service account, adjust the commands appropriately.
Authorize the service account
Groups of related permissions are collected into roles, and you grant the roles to a principal, in this example, the Google Cloud service account. For more information about Monitoring roles, see Access control.
The following command grants the Google Cloud service account,
gmp-test-sa, the Monitoring API roles it needs to
read
metric data.
If you have already granted the Google Cloud service account a specific role as part of prior task, then you don't need to do it again.
To authorize your service account to read from a multi-project metrics scope, follow these instructions and then see Change the queried project.gcloud projects add-iam-policy-binding PROJECT_ID \ --member=serviceAccount:gmp-test-sa@PROJECT_ID.iam.gserviceaccount.com \ --role=roles/monitoring.viewer \ && \ gcloud projects add-iam-policy-binding PROJECT_ID \ --member=serviceAccount:gmp-test-sa@PROJECT_ID.iam.gserviceaccount.com \ --role=roles/iam.serviceAccountTokenCreator
Debug your Workload Identity Federation for GKE configuration
If you are having trouble getting Workload Identity Federation for GKE to work, see the documentation for verifying your Workload Identity Federation for GKE setup and the Workload Identity Federation for GKE troubleshooting guide.
As typos and partial copy-pastes are the most common sources of errors when configuring Workload Identity Federation for GKE, we strongly recommend using the editable variables and clickable copy-paste icons embedded in the code samples in these instructions.
Workload Identity Federation for GKE in production environments
The example described in this document binds the Google Cloud service account to the default Kubernetes service account and gives the Google Cloud service account all necessary permissions to use the Monitoring API.
In a production environment, you might want to use a finer-grained approach, with a service account for each component, each with minimal permissions. For more information on configuring service accounts for workload-identity management, see Using Workload Identity Federation for GKE.
Queries and metrics scopes
The data you can query is determined by the Cloud Monitoring construct metrics scope, regardless of the method you use to query the data. For example, if you use Grafana to query Managed Service for Prometheus data, then each metrics scope must be configured as a separate data source.
A Monitoring metrics scope is a read-time-only construct that lets you query metric data belonging to multiple Google Cloud projects. Every metrics scope is hosted by a designated Google Cloud project, called the scoping project.
By default, a project is the scoping project for its own metrics scope, and the metrics scope contains the metrics and configuration for that project. A scoping project can have more than one monitored project in its metrics scope, and the metrics and configurations from all the monitored projects in the metrics scope are visible to the scoping project. A monitored project can also belong to more than one metrics scope.
When you query the metrics in a scoping project, and if that scoping project hosts a multi-project metrics scope, you can retrieve data from multiple projects. If your metrics scope contains all your projects, then your queries and rules evaluate globally.
For more information about scoping projects and metrics scope, see Metrics scopes. For information about configuring multi-project metrics scope, see View metrics for multiple projects.
Managed Service for Prometheus data in Cloud Monitoring
The simplest way to verify that your Prometheus data is being exported is to use the Cloud Monitoring Metrics Explorer page in the Google Cloud console, which supports PromQL. For instructions, see Querying using PromQL in Cloud Monitoring.
You can also import your Grafana dashboards into Cloud Monitoring. This enables you to keep using community-created or personal Grafana dashboards without having to configure or deploy a Grafana instance.
Grafana
Managed Service for Prometheus uses the built-in Prometheus data source for Grafana, meaning that you can keep using any community-created or personal Grafana dashboards without any changes.
Deploy Grafana, if needed
If you don't have a running Grafana deployment in your cluster, then you can create an ephemeral test deployment to experiment with.
To create an ephemeral Grafana deployment, apply the
Managed Service for Prometheus grafana.yaml manifest to your
cluster, and port-forward the grafana service to your local machine. Due
to CORS restrictions, you can't access a Grafana deployment using
Cloud Shell.
Apply the
grafana.yamlmanifest:kubectl -n NAMESPACE_NAME apply -f https://raw.githubusercontent.com/GoogleCloudPlatform/prometheus-engine/v0.15.3/examples/grafana.yaml
Port-forward the
grafanaservice to your local machine. This example forwards the service to port 3000:kubectl -n NAMESPACE_NAME port-forward svc/grafana 3000
This command does not return, and while it is running, it reports accesses to the URL.
You can access Grafana in your browser at the URL
http://localhost:3000with the username:passwordadmin:admin.
Then add a new Prometheus data source to Grafana by doing the following:
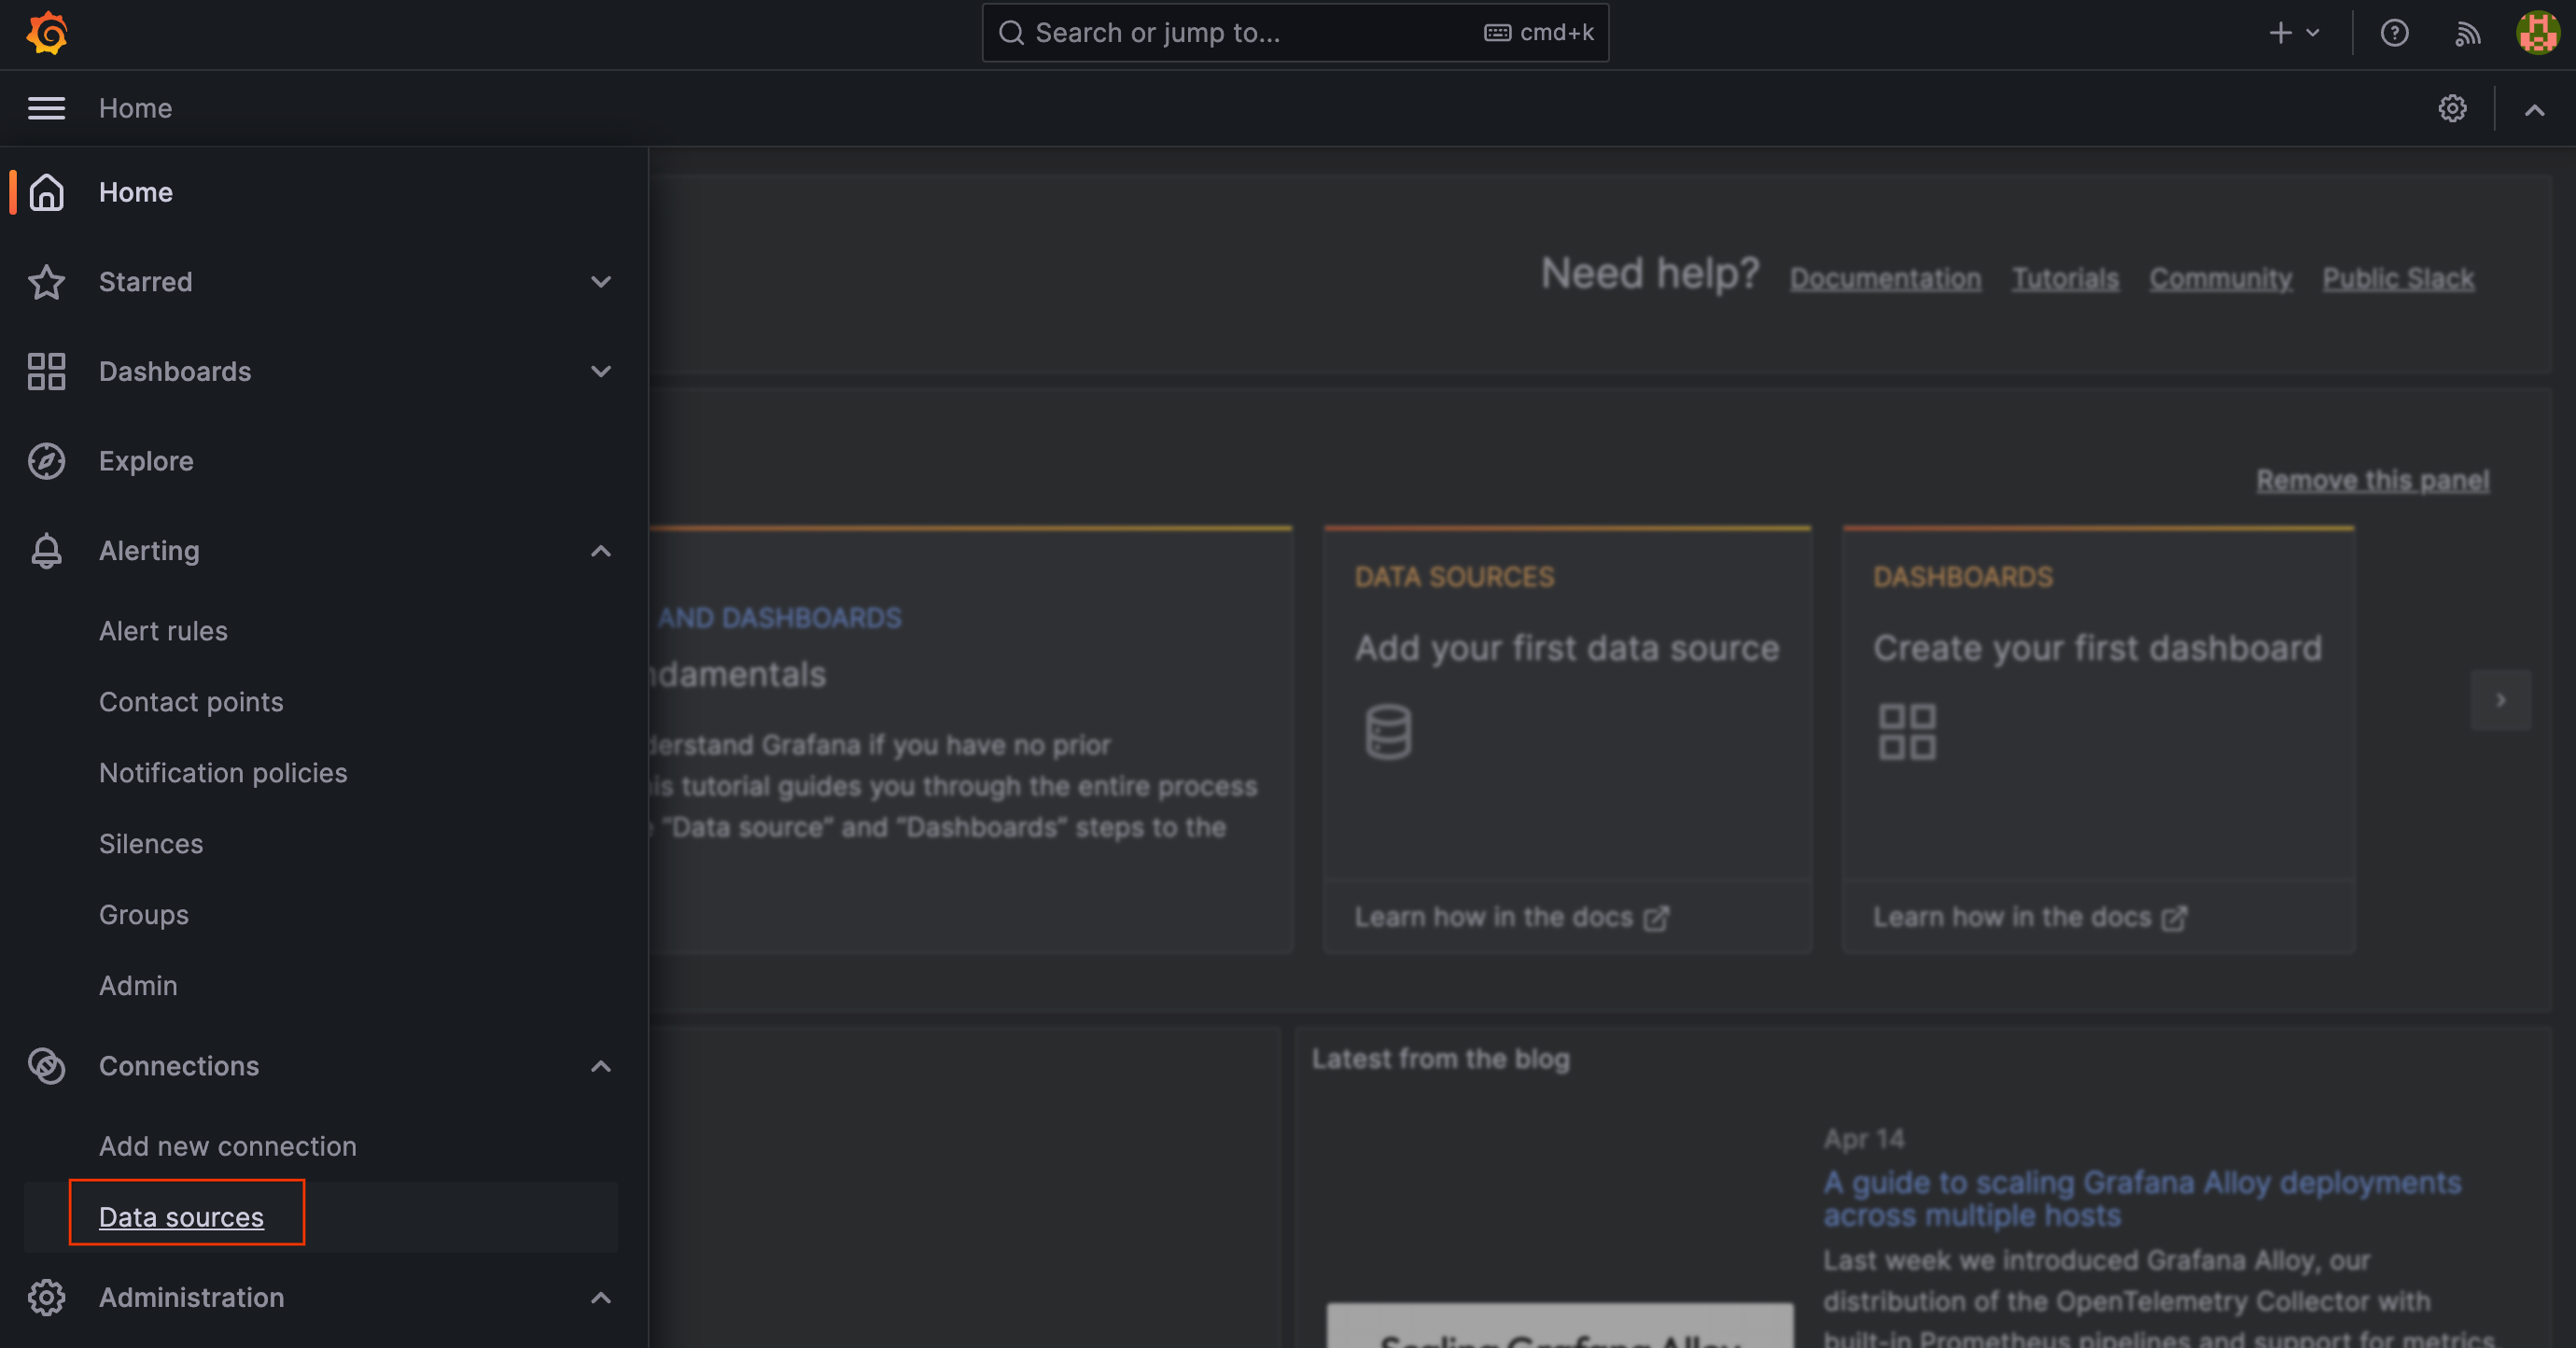
Go to your Grafana deployment, for example, by browsing to the URL
http://localhost:3000to reach the Grafana welcome page.Select Connections from the main Grafana menu, then select Data Sources.
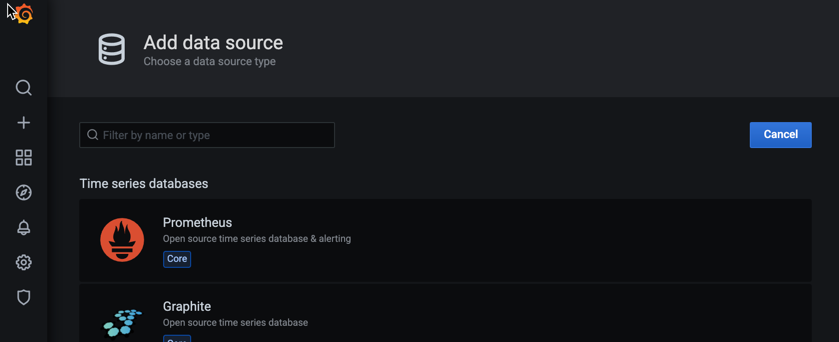
Select Add data source, and select Prometheus as the time series database.
Give the data source a name, set the
URLfield tohttp://localhost:9090, then select Save & Test. You can ignore any errors saying that the data source is not configured correctly.Copy down the local service URL for your deployment, which will look like the following:
http://grafana.NAMESPACE_NAME.svc:3000
Configure and authenticate the Grafana data source
Google Cloud APIs all require authentication using OAuth2; however, Grafana doesn't support OAuth2 authentication for service accounts used with Prometheus data sources. To use Grafana with Managed Service for Prometheus, you use the data source syncer to generate OAuth2 credentials for your service account and sync them to Grafana through the Grafana data source API.
You must use the data source syncer to configure and authorize Grafana to query data globally. If you don't follow these steps, then Grafana only executes queries against data in the local Prometheus server.
The data source syncer is a command-line interface tool that remotely sends configuration values to a given Grafana Prometheus data source. This ensures that your Grafana data source has the following configured correctly:
- Authentication, done by refreshing an OAuth2 access token periodically
- The Cloud Monitoring API set as the Prometheus server URL
- The HTTP method set to GET
- The Prometheus type and version set to a minimum of 2.40.x
- The HTTP and Query timeout values set to 2 minutes
The data source syncer must run repeatedly. As service account access tokens have a default lifetime of one hour, running the data source syncer every 10 minutes ensures you have an uninterrupted authenticated connection between Grafana and the Cloud Monitoring API.
You can choose to run the data source syncer either by using a Kubernetes CronJob or by using Cloud Run and Cloud Scheduler for a fully serverless experience. If you are deploying Grafana locally such as with open-source Grafana or Grafana Enterprise, we recommend running the data source syncer in the same cluster where Grafana is running. If you are using Grafana Cloud, we recommend choosing the fully serverless option.
Use Serverless
To deploy and run a serverless data source syncer by using Cloud Run and Cloud Scheduler, do the following:
Choose a project to deploy the data source syncer in. We recommend choosing the scoping project of a multi-project metrics scope. The data source syncer uses the configured Google Cloud project as the scoping project.
Next, configure and authorize a service account for the data source syncer. The following command sequence creates a service account and grants it several IAM roles. The first two roles let the service account read from the Cloud Monitoring API and generate service account tokens. The last two roles allow the service account to read the Grafana service account token from Secret Manager and to invoke Cloud Run:
gcloud config set project PROJECT_ID \ && gcloud iam service-accounts create gmp-ds-syncer-sa \ && gcloud projects add-iam-policy-binding PROJECT_ID \ --member=serviceAccount:gmp-ds-syncer-sa@PROJECT_ID.iam.gserviceaccount.com \ --role=roles/monitoring.viewer \ && \ gcloud projects add-iam-policy-binding PROJECT_ID \ --member=serviceAccount:gmp-ds-syncer-sa@PROJECT_ID.iam.gserviceaccount.com \ --role=roles/iam.serviceAccountTokenCreator \ && \ gcloud projects add-iam-policy-binding PROJECT_ID \ --member=serviceAccount:gmp-ds-syncer-sa@PROJECT_ID.iam.gserviceaccount.com \ --role=roles/secretmanager.secretAccessor && \ gcloud projects add-iam-policy-binding PROJECT_ID \ --member=serviceAccount:gmp-ds-syncer-sa@PROJECT_ID.iam.gserviceaccount.com \ --role=roles/run.invoker
Determine the URL of your Grafana instance, for example
https://yourcompanyname.grafana.netfor a Grafana Cloud deployment. Your Grafana instance needs to be accessible from Cloud Run, meaning it needs to be accessible from the wider internet.If your Grafana instance is not accessible from the wider internet, we recommend deploying the data source syncer on Kubernetes instead.
Choose the Grafana Prometheus data source to use for Managed Service for Prometheus, which can be either a new or a pre-existing Prometheus data source, and then find and write down the data source UID. The data source UID can be found in the last part of the URL when exploring or configuring a data source, for example
https://yourcompanyname.grafana.net/connections/datasources/edit/GRAFANA_DATASOURCE_UID. Do not copy the entire datasource URL. Copy only the unique identifier in the URL.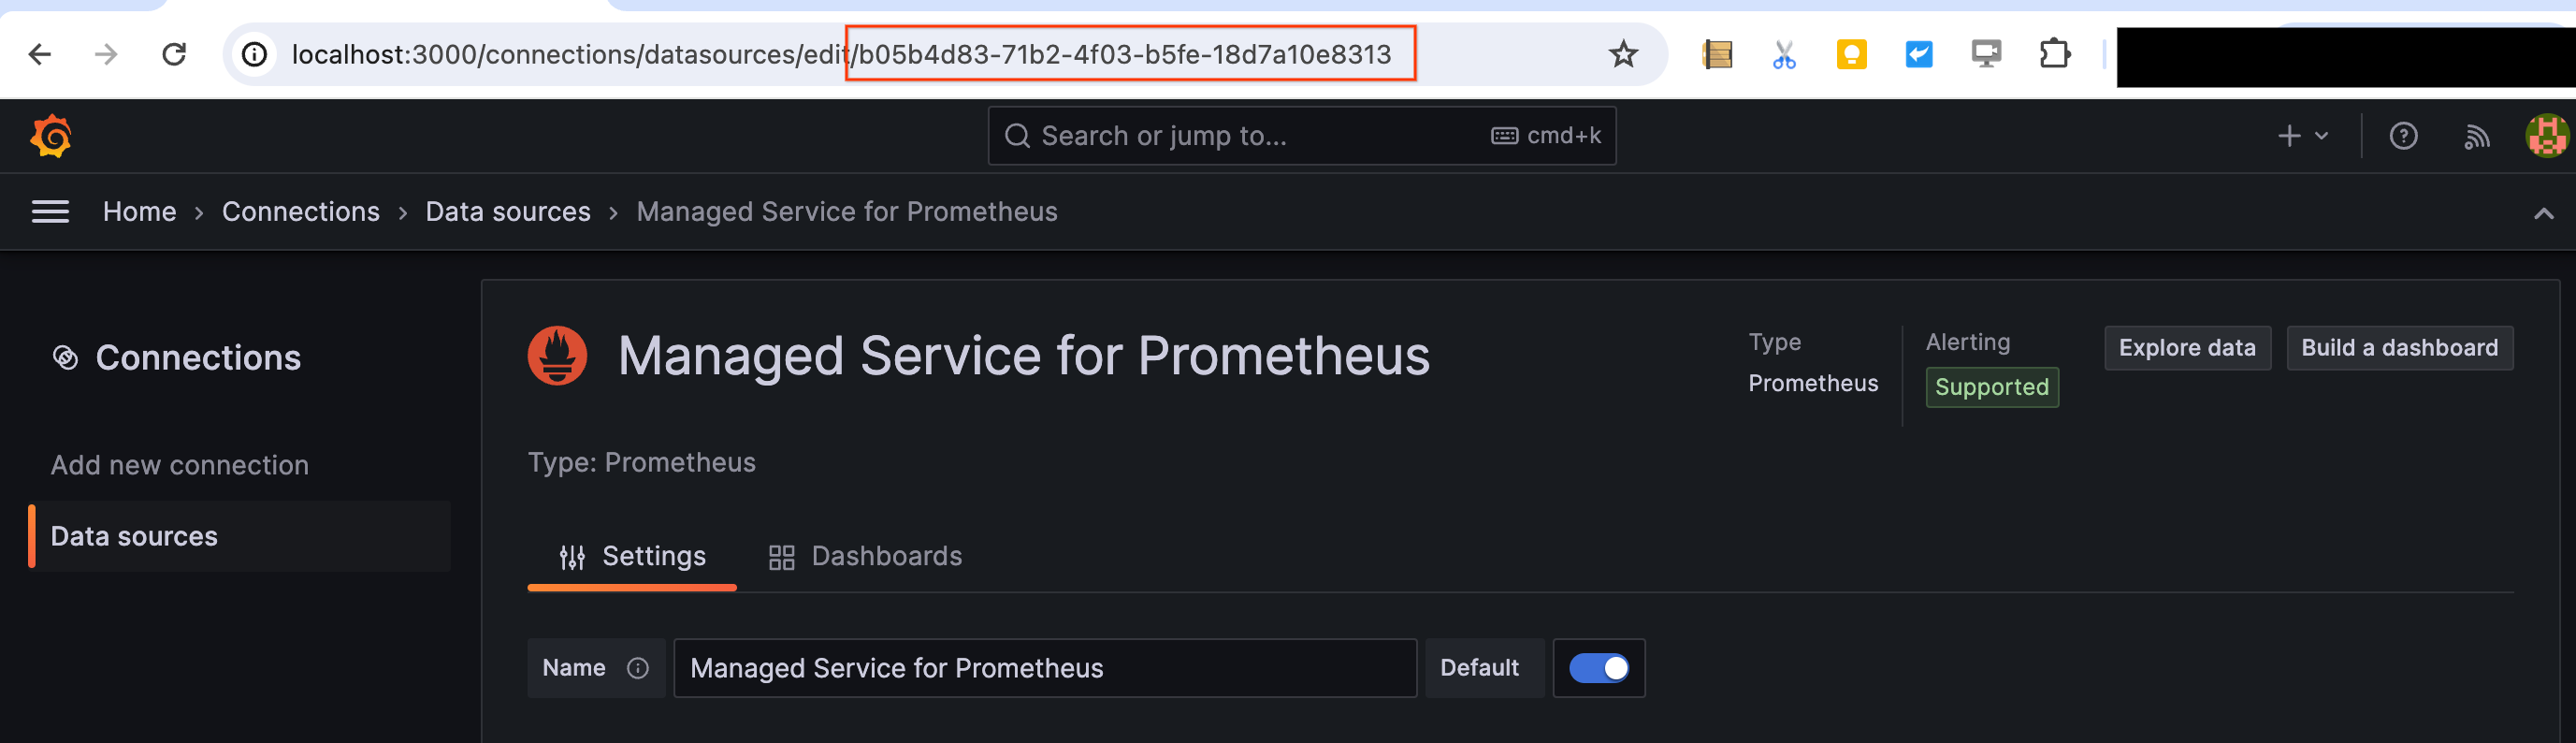
Set up a Grafana service account by creating the service account and generating a token for the account to use:
In the Grafana navigation sidebar, click Administration > Users and Access > Service Accounts.
Create the service account in Grafana by clicking Add service account, giving it a name, and granting it the "Data Sources > Writer" role. Make sure you hit the Apply button to assign the role. In older versions of Grafana, you can use the "Admin" role instead.
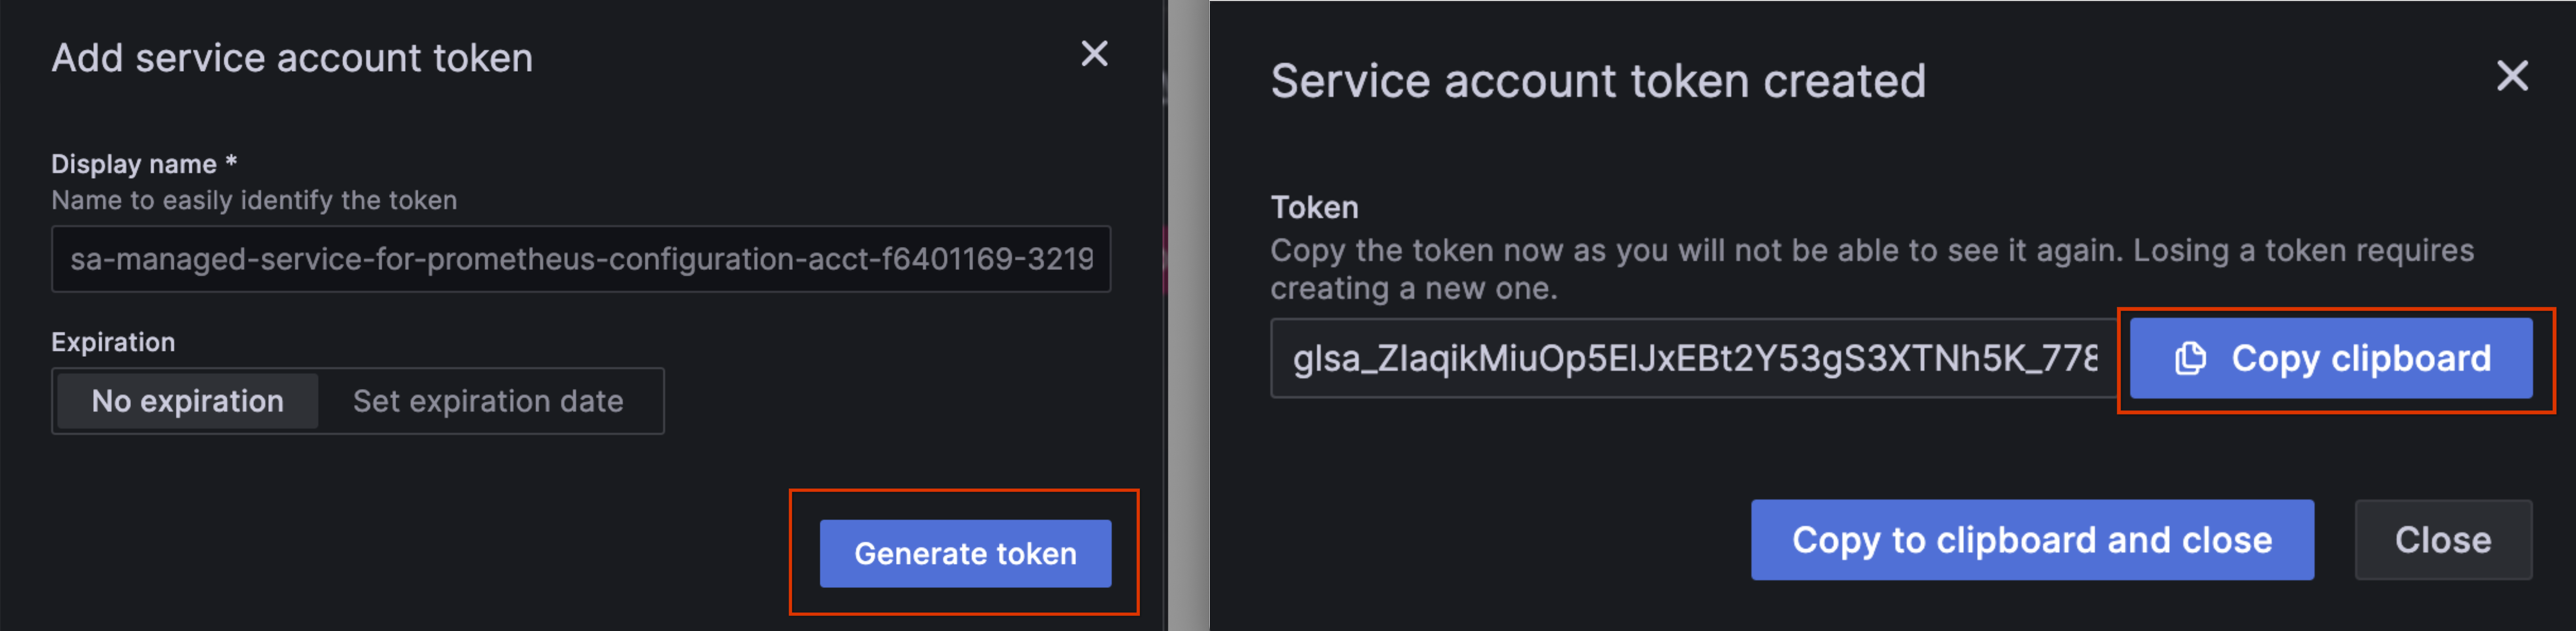
Click Add service account token.
Set the token expiration to "No expiration" and click Generate token, then copy the generated token to the clipboard for use as GRAFANA_SERVICE_ACCOUNT_TOKEN in the next step:
Set the following documentation variables using the results of the previous steps. You do not have to paste this into a terminal:
# These values are required. REGION # The Google Cloud region where you want to run your Cloud Run job, such as us-central1. PROJECT_ID # The Project ID from Step 1. GRAFANA_INSTANCE_URL # The Grafana instance URL from step 2. This is a URL. Include "http://" or "https://". GRAFANA_DATASOURCE_UID # The Grafana data source UID from step 3. This is not a URL. GRAFANA_SERVICE_ACCOUNT_TOKEN # The Grafana service account token from step 4.
Create a secret in Secret Manager:
gcloud secrets create datasource-syncer --replication-policy="automatic" && \ echo -n GRAFANA_SERVICE_ACCOUNT_TOKEN | gcloud secrets versions add datasource-syncer --data-file=-
Create the following YAML file and name it
cloud-run-datasource-syncer.yaml:apiVersion: run.googleapis.com/v1 kind: Job metadata: name: datasource-syncer-job spec: template: spec: taskCount: 1 template: spec: containers: - name: datasource-syncer image: gke.gcr.io/prometheus-engine/datasource-syncer:v0.15.3-gke.0 args: - "--datasource-uids=GRAFANA_DATASOURCE_UID" - "--grafana-api-endpoint=GRAFANA_INSTANCE_URL" - "--project-id=PROJECT_ID" env: - name: GRAFANA_SERVICE_ACCOUNT_TOKEN valueFrom: secretKeyRef: key: latest name: datasource-syncer serviceAccountName: gmp-ds-syncer-sa@PROJECT_ID.iam.gserviceaccount.comThen run the following command to create a Cloud Run job using the YAML file:
gcloud run jobs replace cloud-run-datasource-syncer.yaml --region REGION
Create a schedule in Cloud Scheduler to run the Cloud Run job every 10 minutes:
gcloud scheduler jobs create http datasource-syncer \ --location REGION \ --schedule="*/10 * * * *" \ --uri="https://REGION-run.googleapis.com/apis/run.googleapis.com/v1/namespaces/PROJECT_ID/jobs/datasource-syncer-job:run" \ --http-method POST \ --oauth-service-account-email=gmp-ds-syncer-sa@PROJECT_ID.iam.gserviceaccount.com
Then force run the scheduler you just created:
gcloud scheduler jobs run datasource-syncer --location REGION
It can take up to 15 seconds for the data source to be updated.
Go to your newly configured Grafana data source and verify the Prometheus server URL value starts with
https://monitoring.googleapis.com. You might have to refresh the page. Once verified, go to the bottom of the page, select Save & test, and ensure you see a green checkmark saying that the datasource is properly configured. You need to select Save & test at least once to ensure that label autocompletion in Grafana works.
Use Kubernetes
To deploy and run the data source syncer in a Kubernetes cluster, do the following:
Choose a project, cluster, and namespace to deploy the data source syncer in. We recommend deploying the data source syncer in a cluster belonging to the scoping project of a multi-project metrics scope. The data source syncer uses the configured Google Cloud project as the scoping project.
Next, make sure you properly configure and authorize the data source syncer:
- If you're using Workload Identity Federation for GKE, then follow the instructions to create and authorize a service account. Make sure to bind it to the Kubernetes namespace in which you want to run the data source syncer.
- If you're not using Workload Identity Federation for GKE, then verify you have not modified the default Compute Engine service account.
- If you're not running on GKE, then see Running the data source syncer outside of GKE.
Then, determine if you have to further authorize the data source syncer for multi-project querying:
- If your local project is your scoping project, and you have followed the instructions for verifying or configuring a service account for the local project, then multi-project querying should work with no further configuration.
- If your local project is not your scoping project, then you need to authorize the data source syncer to execute queries against the scoping project. For instructions, see authorize the data source syncer to get multi-project monitoring.
Determine the URL of your Grafana instance, for example
https://yourcompanyname.grafana.netfor a Grafana Cloud deployment orhttp://grafana.NAMESPACE_NAME.svc:3000for a local instance configured using the test deployment YAML.If you deploy Grafana locally and your cluster is configured to secure all in-cluster traffic by using TLS, you need to use
https://in your URL and authenticate using one of the supported TLS authentication options.Choose the Grafana Prometheus data source that you would like to use for Managed Service for Prometheus, which can be either a new or a pre-existing data source, and then find and write down the data source UID. The data source UID can be found in the last part of the URL when exploring or configuring a data source, for example
https://yourcompanyname.grafana.net/connections/datasources/edit/GRAFANA_DATASOURCE_UID.Do not copy the entire datasource URL. Copy only the unique identifier in the URL.Set up a Grafana service account by creating the service account and generating a token for the account to use:
- In the Grafana navigation sidebar, click Administration > Users and Access > Service Accounts.
Create the service account by clicking Add service account, giving it a name, and granting it the "Admin" role in Grafana. If your version of Grafana allows more granular permissions, then you can use the Data Sources > Writer role.
Click Add service account token.
Set the token expiration set to "No expiration" and click Generate token, then copy the generated token to the clipboard for use as GRAFANA_SERVICE_ACCOUNT_TOKEN in the next step.
Set up the following environment variables using the results of the previous steps:
# These values are required. PROJECT_ID=SCOPING_PROJECT_ID # The value from Step 1. GRAFANA_API_ENDPOINT=GRAFANA_INSTANCE_URL # The value from step 2. This is a URL. DATASOURCE_UIDS=GRAFANA_DATASOURCE_UID # The value from step 3. This is not a URL. GRAFANA_API_TOKEN=GRAFANA_SERVICE_ACCOUNT_TOKEN # The value from step 4.
Run the following command to create a CronJob that refreshes the data source on initialization and then every 10 minutes. If you're using Workload Identity Federation for GKE, then the value of NAMESPACE_NAME should be the same namespace that you previously bound to the service account.
curl https://raw.githubusercontent.com/GoogleCloudPlatform/prometheus-engine/v0.15.3/cmd/datasource-syncer/datasource-syncer.yaml \ | sed 's|$DATASOURCE_UIDS|'"$DATASOURCE_UIDS"'|; s|$GRAFANA_API_ENDPOINT|'"$GRAFANA_API_ENDPOINT"'|; s|$GRAFANA_API_TOKEN|'"$GRAFANA_API_TOKEN"'|; s|$PROJECT_ID|'"$PROJECT_ID"'|;' \ | kubectl -n NAMESPACE_NAME apply -f -
Go to your newly configured Grafana data source and verify the Prometheus server URL value starts with
https://monitoring.googleapis.com. You might have to refresh the page. Once verified, go to the bottom of the page and select Save & test. You need to select this button at least once to ensure that label autocompletion in Grafana works.
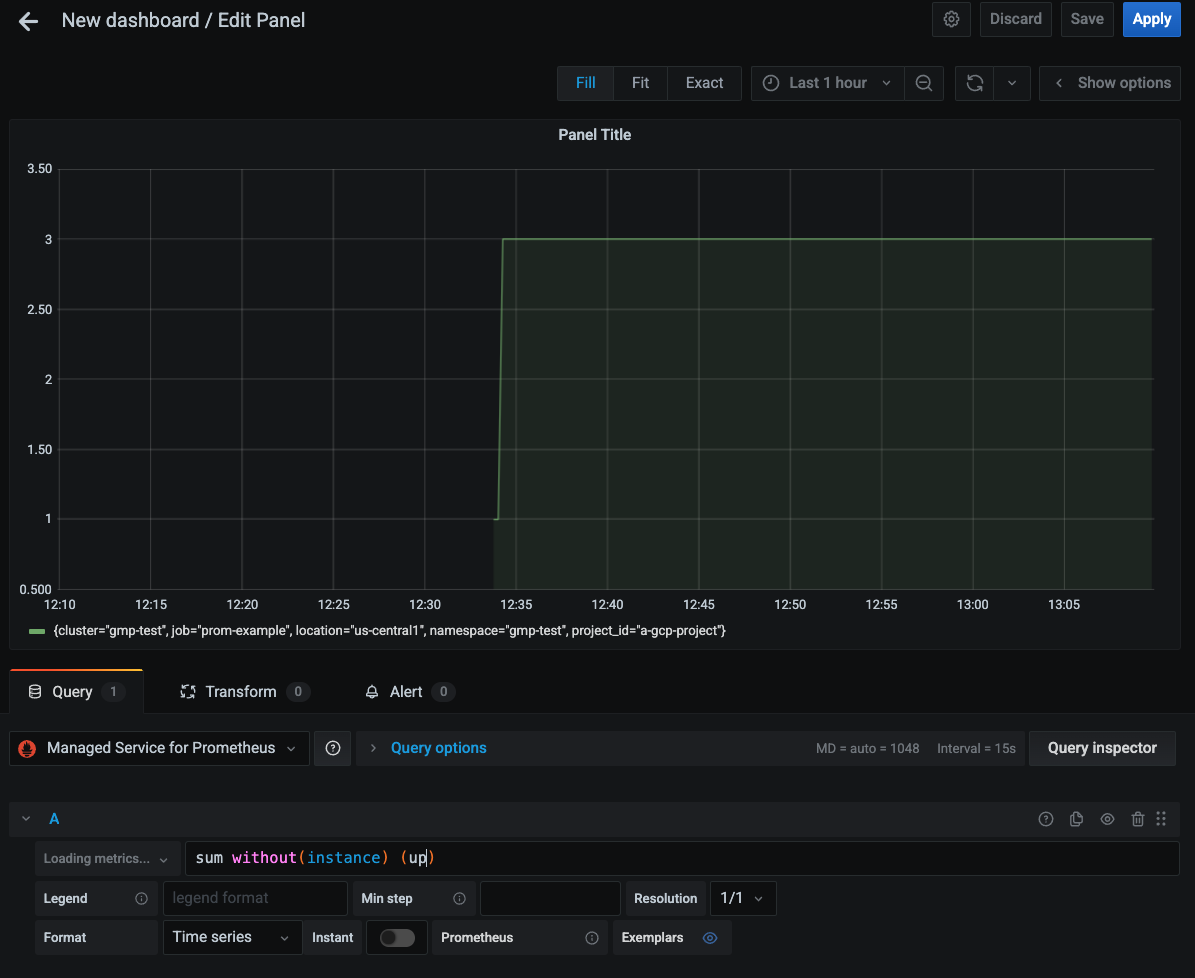
Run queries by using Grafana
You can now create Grafana dashboards and run queries using the configured data
source. The following screenshot shows a Grafana chart that displays the up
metric:
For information about querying Google Cloud system metrics using PromQL, see PromQL for Cloud Monitoring metrics.
Running the data source syncer outside of GKE
If you are running the data source syncer in a Google Kubernetes Engine cluster or if you are using the serverless option, then you can skip this section. If you are having authentication issues on GKE, see Verify service account credentials.
When running on GKE, the data source syncer
automatically retrieves credentials from the environment based on the
node's service account or the Workload Identity Federation for GKE setup.
In non-GKE Kubernetes clusters, credentials must be explicitly
provided to the data source syncer by using the
GOOGLE_APPLICATION_CREDENTIALS environment variable.
Set the context to your target project:
gcloud config set project PROJECT_ID
Create a service account:
gcloud iam service-accounts create gmp-test-sa
This step creates the service account that you might have already created in the Workload Identity Federation for GKE instructions.
Grant the required permissions to the service account:
gcloud projects add-iam-policy-binding PROJECT_ID \
  --member=serviceAccount:gmp-test-sa@PROJECT_ID.iam.gserviceaccount.com \
  --role=roles/monitoring.viewer \
&& \
gcloud projects add-iam-policy-binding PROJECT_ID \
  --member=serviceAccount:gmp-test-sa@PROJECT_ID.iam.gserviceaccount.com \
  --role=roles/iam.serviceAccountTokenCreator
Create and download a key for the service account:
gcloud iam service-accounts keys create gmp-test-sa-key.json \
  --iam-account=gmp-test-sa@PROJECT_ID.iam.gserviceaccount.com
Set the key-file path by using the
GOOGLE_APPLICATION_CREDENTIALSenvironment variable.
Authorize the data source syncer to get multi-project monitoring
Managed Service for Prometheus supports multi-project monitoring by using metrics scopes.
For those using the serverless option, you get multi-project querying if your chosen project is the scoping project of a multi-project metric scope.
For those deploying the data source syncer on Kubernetes, if your local project is your scoping project, and you have followed the instructions for verifying or configuring a service account for the local project, then multi-project querying should work with no further configuration.
If your local project is not your scoping project, then you need to authorize
either the local project's default compute service account or
your Workload Identity Federation for GKE service account to have
monitoring.viewer access to the scoping project. Then pass in the scoping
project's ID as the value of the PROJECT_ID environment
variable.
If you use the Compute Engine default service account,
you can do one of the following:
Deploy the data source syncer in a cluster that belongs to your scoping project.
Enable Workload Identity Federation for GKE for your cluster and follow the configuration steps.
Provide an explicit service-account key.
To grant a service account the permissions needed to access a different Google Cloud project, do the following:
Grant the service account permission to read from the target project you want to query:
gcloud projects add-iam-policy-binding SCOPING_PROJECT_ID \
  --member=serviceAccount:gmp-test-sa@PROJECT_ID.iam.gserviceaccount.com \
  --role=roles/monitoring.viewer
When configuring the data source syncer, pass in the scoping project's ID as the value of the
PROJECT_IDenvironment variable.
Inspect the Kubernetes CronJob
If you are deploying the data source syncer on Kubernetes, you can inspect the CronJob and ensure that all variables are correctly set by running the following command:
kubectl describe cronjob datasource-syncer
To see logs for the Job that initially configures Grafana, run the following
command immediately after applying the datasource-syncer.yaml file:
kubectl logs job.batch/datasource-syncer-init
Teardown
To disable the data source syncer Cronjob on Kubernetes, run the following command:
kubectl delete -f https://raw.githubusercontent.com/GoogleCloudPlatform/prometheus-engine/v0.15.3/cmd/datasource-syncer/datasource-syncer.yaml
Disabling the data source syncer stops updating the linked Grafana with fresh authentication credentials, and as a consequence querying Managed Service for Prometheus no longer works.
API compatibility
The following Prometheus HTTP API endpoints are
supported by Managed Service for Prometheus under the URL prefixed by
https://monitoring.googleapis.com/v1/projects/PROJECT_ID/location/global/prometheus/api/v1/.
For full documentation, see the Cloud Monitoring API reference documentation. The Promethus HTTP endpoints aren't available in the Cloud Monitoring language-specific client libraries.
For information about PromQL compatibility, see PromQL support.
The following endpoints are fully supported:
The
/api/v1/label/<label_name>/valuesendpoint only works if the__name__label is provided either by using it as the<label_name>value or by exactly matching on it using a series selector. For example, the following calls are fully supported:/api/v1/label/__name__/values/api/v1/label/__name__/values?match[]={__name__=~".*metricname.*"}/api/v1/label/labelname/values?match[]={__name__="metricname"}
This limitation causes
label_values($label)variable queries in Grafana to fail. Instead, you can uselabel_values($metric, $label). This type of query is recommended because it avoids fetching values for labels on metrics that are not relevant to the given dashboard.The
/api/v1/seriesendpoint is supported forGETbut notPOSTrequests. When you use the data source syncer or frontend proxy, this restriction is managed for you. You can also configure your Prometheus data sources in Grafana to issue onlyGETrequests. Thematch[]parameter does not support regular expression matching on the__name__label.
What's next
- Use PromQL alerts in Cloud Monitoring.
- Set up managed rule evaluation.
- Set up commonly used exporters.