히트맵에 밝고 어두운 색상이 고운 결로 혼합되어 표시되는 경우에는 테이블 전반에서 읽기 및 쓰기가 고르게 분포된 것입니다. 이 히트맵은 Bigtable의 효율적인 사용 패턴을 의미하므로 조치를 취할 필요가 없습니다.
주기적 사용
히트맵에서 키 범위 안에 밝고 어두운 색상의 밴드가 번갈아 표시되는 경우는 해당 키 범위를 특정 기간 동안만 액세스하고 그 외 기간에는 액세스하지 않는 것입니다. 예를 들어 특정 시간대에 키 범위에 액세스하는 일괄 작업을 실행 중인 것일 수도 있습니다.
이 사용 패턴은 과도한 CPU 사용이나 지연 시간을 초래하지 않으며 이러한 방식으로 데이터를 액세스하는 것이 원래의 의도일 경우에 한하여 문제가 되지 않습니다.
이 패턴으로 인해 과도한 CPU 사용이 발생할 경우에는 최대 사용 기간 동안 클러스터에 노드를 추가해야 합니다.
특정 시간대에 훨씬 더 많이 데이터에 액세스할 의도가 없었다면 애플리케이션을 조사하여 어떤 것들이 제대로 작동하고 있지 않은지를 찾아내세요.
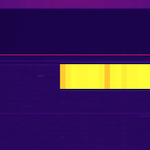
핫 키 범위
히트맵에서 밝은 색상의 가로 밴드가 어두운 색상에 의해 분리되어 있으면 밝은 색상의 키 범위에 다음 중 하나의 문제가 있는 것입니다.
읽기 압력 지수 또는 쓰기 압력 지수 측정항목을 보고 있는 경우, 핫 키 범위는 높은 CPU 사용량이나 긴 지연 시간을 일으키고 있는 것일 수 있습니다. 이러한 문제는 대량의 읽기 또는 쓰기를 수행하거나 256MB 넘게 연속으로 저장하는 경우에 발생할 수 있습니다. 여러 행이 아닌 단일 행에 의해 이 경고가 트리거될 경우에 특히 주의하세요.
큰 행 측정항목을 보고 있는 경우 256MB가 넘는 데이터 또는 행당 평균 200MB가 넘는 데이터가 있는 행이 키 범위에 포함됩니다.
다른 측정항목을 보고 있는 경우에는 해당 키 범위에 있는 행을 다른 행보다 훨씬 더 많이 액세스하고 있는 것일 가능성이 높습니다.
많이 사용되는 행이나 과도하게 큰 행에 있는 데이터가 여러 행에 분산되도록 스키마 설계 또는 애플리케이션을 변경합니다.
Bigtable의 읽기 결과를 캐시하도록 애플리케이션을 업데이트합니다.
Bigtable에 일괄적으로 쓰고 중복 쓰기를 삭제하도록 애플리케이션을 업데이트합니다.
급격한 증가
히트맵에 어두운 색상에서 밝은 색상으로 갑자기 바뀌는 키 범위가 표시되는 경우에는 다음 변경사항 중 하나가 발생한 것입니다.
큰 행 측정항목을 보고 있는 경우에는 짧은 기간 동안 해당 키 범위에 있는 행에 대량의 데이터를 추가한 것입니다.
큰 행에서 데이터를 삭제하거나, 이러한 행에 데이터가 덜 저장되도록 스키마 설계를 변경하세요.
다른 측정항목을 보고 있는 경우에는 특정 시점에 해당 행에 대한 액세스를 평소보다 훨씬 더 많이 시작한 것일 가능성이 높습니다.
이 사용 패턴은 과도한 CPU 사용이나 지연 시간을 초래하지 않으며 이러한 방식으로 데이터를 액세스하는 것이 원래의 의도일 경우에 한하여 문제가 되지 않습니다.
이 패턴으로 인해 과도한 CPU 사용이 발생할 경우에는 최대 사용 기간 동안 클러스터에 노드를 추가해야 합니다.
특정 시점에 훨씬 더 많은 데이터 액세스를 시작할 의도가 없었다면 애플리케이션을 조사하여 어떤 것들이 제대로 작동하고 있지 않은지를 찾아내세요.
순차적 읽기 및 쓰기
히트맵에 밝은 대각선이 표시되면 테이블 내에서 인접한 키 범위에 순차적으로 액세스하고 있는 것입니다. 예를 들어 테이블의 행 키를 반복적으로 처리하는 일괄 작업을 실행한 것일 수도 있습니다.
이 사용 패턴은 과도한 CPU 사용이나 지연 시간을 초래하지 않으며 이러한 방식으로 데이터를 액세스하는 것이 원래의 의도일 경우에 한하여 문제가 되지 않습니다.
이 패턴으로 인해 과도한 CPU 사용이 발생할 경우에는 최대 사용 기간 동안 클러스터에 노드를 추가해야 합니다.
테이블 내의 행에 순차적으로 액세스할 의도가 없었다면 애플리케이션을 조사하여 어떤 것들이 제대로 작동하고 있지 않은지를 찾아내세요.
[[["이해하기 쉬움","easyToUnderstand","thumb-up"],["문제가 해결됨","solvedMyProblem","thumb-up"],["기타","otherUp","thumb-up"]],[["이해하기 어려움","hardToUnderstand","thumb-down"],["잘못된 정보 또는 샘플 코드","incorrectInformationOrSampleCode","thumb-down"],["필요한 정보/샘플이 없음","missingTheInformationSamplesINeed","thumb-down"],["번역 문제","translationIssue","thumb-down"],["기타","otherDown","thumb-down"]],["최종 업데이트: 2025-09-04(UTC)"],[[["\u003cp\u003eKey Visualizer heatmaps display patterns that can indicate performance issues with Bigtable, and this page explains how to interpret these patterns.\u003c/p\u003e\n"],["\u003cp\u003eEvenly distributed reads and writes are optimal and appear as a fine-grained mix of dark and bright colors in the heatmap, indicating no action is needed.\u003c/p\u003e\n"],["\u003cp\u003ePeriodic usage, showing as alternating bands of colors, is acceptable unless it causes high CPU usage or latency, in which case adding nodes may be necessary.\u003c/p\u003e\n"],["\u003cp\u003eHot key ranges, shown as horizontal bright bands, suggest high CPU usage, latency, or overly large rows, and resolution includes using filters, modifying schema design, caching, or batching writes.\u003c/p\u003e\n"],["\u003cp\u003eSudden increases in the heatmap indicate a sudden change to a specific key range, whether it be due to data being added or accessed, which may require adding nodes or deleting data.\u003c/p\u003e\n"]]],[],null,["Heatmap patterns\n\nThis page shows examples of patterns that you might see in the heatmap for a Key\nVisualizer scan, then explains the meaning of each pattern. Use this information\nto help you diagnose performance issues with Bigtable.\n\n- To learn how to open a Key Visualizer scan, see [Viewing the scan for a time\n period](/bigtable/docs/keyvis-getting-started#viewing-scan).\n- To find out how to explore a Key Visualizer scan in detail, see [Exploring\n Heatmaps](/bigtable/docs/keyvis-exploring-heatmaps).\n\n\nBefore you read this page, you should be familiar with the\n[overview of Key Visualizer](/bigtable/docs/keyvis-overview).\n\nOverview of common patterns\n\nThis page explains how to interpret the following Key Visualizer patterns. \n[Even distribution](#even-distribution) [Periodic usage](#periodic-usage) [Hot key ranges](#hot-key-ranges) \n\n[Sudden increases](#sudden-increases) [Sequential reads/writes](#sequential-ops)\n\nEvenly distributed reads and writes\n\nIf a heatmap shows a fine-grained mix of dark and bright colors, then reads and\nwrites are evenly distributed throughout the table. This heatmap represents an\neffective usage pattern for Bigtable, so you do not need to take\nany action. \n\nPeriodic usage\n\nIf a heatmap shows alternating bands of dark and bright colors within a key\nrange, then you are accessing that key range during certain periods but not\nothers. For example, you might be running a batch job that accesses the key\nrange at specific times of day.\n\n\nThis usage pattern is not a problem as long as it does not result in excessive CPU utilization or\nlatency, and as long as you intended to access your data in this way.\n\nIf this pattern results in excessive CPU usage, you might need to\n[add nodes to your cluster](/bigtable/docs/modifying-instance#nodes) during peak usage\nperiods.\nIf you did not intend to\naccess your data much more heavily during specific periods of time, examine your\napplications to find out which ones are not behaving correctly. \n\nHot key ranges\n\nIf a heatmap shows horizontal bands of bright color, separated by dark colors,\nthen the brightly colored key ranges have one of the following issues:\n\n- If you are viewing the **Read pressure index** or **Write pressure index** metrics, the hot key range might be causing high CPU utilization or high latency. These issues can occur if you perform a large number of reads or writes, or if you store more than 256 MB in a row. Pay special attention if this warning is triggered by a single row, rather than a range of rows.\n- If you are viewing the **Large rows** metric, the key range includes rows that contain more than 256 MB of data or an average of more than 200 MB per row.\n- If you are viewing another metric, it's likely that you are accessing rows in that key range much more heavily than other rows.\n\nTake at least one of the following actions to address the issue:\n\n- Use [filters](/bigtable/docs/filters) to reduce the amount of data that you read.\n- Change your [schema design](/bigtable/docs/schema-design) or your application so that the data in a heavily used row, or in an excessively large row, is spread across multiple rows.\n- Update your application to cache the results of reads from Bigtable.\n- Update your application to batch and deduplicate writes to Bigtable.\n\nSudden increases\n\nIf a heatmap shows a key range that suddenly changes from dark to bright, then\none of the following changes occurred:\n\n- If you are viewing the **Large rows** metric, you added a large amount of data\n to rows in that key range during a short period of time.\n\n Delete data from the large rows, or change your [schema\n design](/bigtable/docs/schema-design) so that less data is stored in those rows.\n- If you are viewing another metric, it's likely that you started to access\n those rows much more heavily than usual at a specific point in time.\n\n\n This usage pattern is not a problem as long as it does not result in excessive CPU utilization or\n latency, and as long as you intended to access your data in this way.\n\n If this pattern results in excessive CPU usage, you might need to\n [add nodes to your cluster](/bigtable/docs/modifying-instance#nodes) during peak usage\n periods.\n If you did not intend\n to start accessing your data much more heavily at a specific point in time,\n examine your applications to find out which ones are not behaving correctly.\n\nSequential reads and writes\n\nIf a heatmap shows a bright diagonal line, then you are accessing contiguous key\nranges within a table in sequential order. For example, you might have run a\nbatch job that iterates over the table's row keys.\n\n\nThis usage pattern is not a problem as long as it does not result in excessive CPU utilization or\nlatency, and as long as you intended to access your data in this way.\n\nIf this pattern results in excessive CPU usage, you might need to\n[add nodes to your cluster](/bigtable/docs/modifying-instance#nodes) during peak usage\nperiods.\nIf you did not intend to\naccess rows within your table in sequential order, examine your applications to\nfind out which ones are not behaving correctly. \n\nWhat's next\n\n- Learn how to [get started with Key Visualizer](/bigtable/docs/keyvis-getting-started).\n- Find out how to [explore a heatmap in detail](/bigtable/docs/keyvis-exploring-heatmaps).\n- Read about the [metrics you can view in a heatmap](/bigtable/docs/keyvis-metrics)."]]