이 페이지에서는 Bigtable의 Key Visualizer 진단 도구를 간략하게 설명합니다.
Key Visualizer란 무엇인가요?
Key Visualizer는 Bigtable 사용 패턴을 분석하는 데 도움이 되는 도구입니다. 액세스하는 row key를 기반으로 사용량을 세분화하여 테이블에 대한 시각적 보고서를 생성합니다.
다른 방법으로는 사용 패턴을 확장된 규모로 이해하기 어려운데 Key Visualizer를 활용하면 도움이 될 수 있습니다. Key Visualizer 용도는 다음과 같습니다.
스키마를 반복적으로 설계하거나 기존 스키마의 설계 개선.
각 반복에서 Key Visualizer를 확인하여 스키마로 인해 발생할 수 있는 문제를 찾아 스키마를 조정하고 다시 확인합니다.
성능 문제 해결
Bigtable에 저장한 데이터에 액세스하는 방법을 자세히 파악
위 목표를 달성하기 위해 Key Visualizer를 통해 다음 태스크를 수행할 수 있습니다.
읽기 또는 쓰기가 특정 행에 핫스팟을 만들고 있는지 확인
너무 많은 데이터가 포함된 행 찾기
테이블의 모든 행에서 액세스 패턴이 균형을 이루고 있는지 확인
Key Visualizer는 다양한 측정항목을 표시하지만 Bigtable의 성능에 영향을 줄 수 있는 모든 측정항목을 표시하지는 않습니다. 예를 들어 애플리케이션과 Google Cloud사이에 네트워크 문제가 있는 경우 해당 네트워크 문제가 표시되지 않거나 Key Visualizer의 모든 키에서 수직 밴드로 표시되어 문제가 발생한 시점에 대한 힌트만 제공합니다. Key Visualizer 검사를 통해 성능 문제의 원인을 식별할 수 없는 경우 추가적인 문제해결 과정이 필요합니다.
Key Visualizer 검사
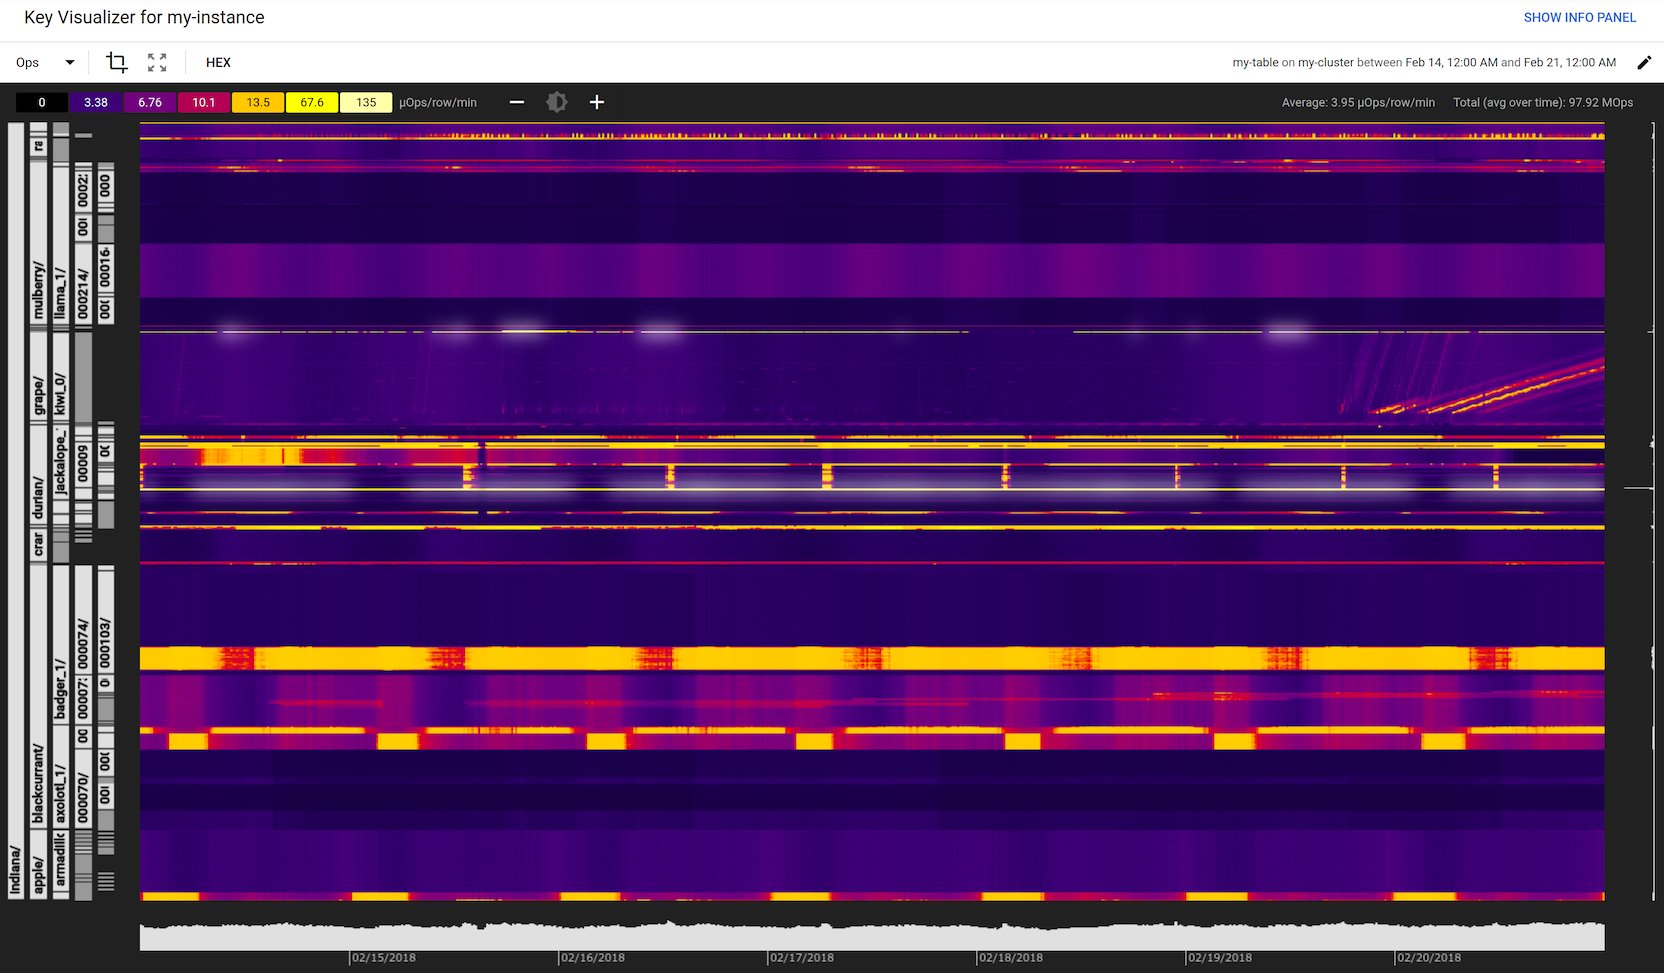
다음 이미지는 Key Visualizer 검사를 보여줍니다. 각 검사에는 다음과 같은 몇 가지 유형의 정보가 포함되어 있습니다.
Key Visualizer는 각 검사의 데이터를 이해하는 데 도움이 되는 도구도 제공합니다.
이전에 Key Visualizer를 사용한 적이 없는 경우 Key Visualizer 시작하기의 안내를 참조하세요. 충분한 경험이 있는 사용자의 경우 자세한 내용은 히트맵 탐색을 참조하세요.
히트맵
Key Visualizer 검사의 핵심은 히트맵입니다. 히트맵은 시간 경과에 따른 측정항목 값을 인접한 범위의 row key로 세분화하여 표시합니다. 히트맵의 x축은 시간을 나타내고 y축은 row key를 나타냅니다. 특정 시점에서 측정항목의 row key 그룹에 대한 값이 낮은 경우 해당 측정항목은 '콜드' 상태이며 어두운 색으로 표시됩니다. 높은 값은 '핫' 상태이며 밝은 색으로 표시됩니다. 가장 높은 값은 흰색으로 표시됩니다.
사용 유형이 달라지면 히트맵의 시각적 패턴이 달라지므로 한눈에 문제를 진단할 수 있습니다. 일반적인 패턴의 예시는 히트맵 패턴을 참조하세요.
기본적으로 Key Visualizer 히트맵은 결합된 읽기 및 쓰기 수를 나타내는 작업 측정항목을 표시합니다. 언제든지 다른 측정항목에 대한 히트맵으로 전환할 수 있습니다. 자세한 내용은 측정항목 전환을 참조하세요.
row key는 종종 값의 계층 구조로 구성되며, 각각의 값이 구분 기호로 분리되어 있습니다. 예를 들어 row key memusage#1423523569918에는 메모리 사용을 캡처하는 모든 행의 식별자가 포함되어 있으며, 그 뒤에는 해당 그룹 내에서 특정 데이터 집합을 식별하는 타임스탬프가 있습니다.
Key Visualizer는 위 예시의 왼쪽에 표시된 것처럼 이러한 유형의 row key를 자동으로 인식하여 탭 계층으로 분할합니다. 이 기능을 사용하면 데이터 및 액세스 패턴이 테이블 행 전체에 분산되는 방식을 이해할 수 있습니다. 또한 특정 row key 범위에 대한 데이터를 더 빠르고 자세히 확인할 수 있습니다.
row key가 여러 값으로 구성되지 않은 경우 Key Visualizer는 여전히 검사의 왼쪽에 탭을 표시하지만 탭은 명확한 계층 구조를 제공하는 대신 예기치 않은 방식으로 row key를 분할할 수 있습니다.
키 버킷
Bigtable 테이블에는 몇 조 개의 행이 있을 수 있으므로 각 행에 대한 측정항목을 보고하는 것이 항상 실용적인 것은 아닙니다. 대신 Key Visualizer는 모든 row key를 1,000개의 연속 범위로 나누어 각 범위에 거의 같은 수의 row key가 포함되도록 합니다. 이러한 범위를 키 버킷이라고 합니다.
Key Visualizer는 대부분의 측정항목을 각 키 버킷의 평균 또는 각 키 버킷 내 최댓값으로 보고합니다. 경고 측정항목과 성능 측정항목의 경우 Key Visualizer는 개별 row key 또는 키 버킷 내 특정 키 범위에 대한 측정항목을 보고하여 정확도를 높입니다.
내부적으로 Key Visualizer는 15분마다 새 검사 데이터를 생성합니다. 연속 기간의 데이터를 연결할 수 있도록 Key Visualizer는 이전 15분과 동일한 키 버킷을 유지하려 합니다. 삭제된 키가 버킷 경계로 계속 표시될 수도 있습니다. 테이블은 시간이 경과함에 따라 데이터 추가 및 삭제로 인해 변경되므로 키 버킷이 균형 유지를 위해 다시 계산됩니다.
또한 Key Visualizer는 테이블이 많이 변경되지 않았더라도 2주마다 새로운 키 버킷 집합을 생성하여 삭제된 키에서 남은 버킷 경계를 삭제합니다. 따라서 테이블이 안정적이더라도 키 버킷이 가끔 업데이트됩니다.
집계 값
히트맵 외에도 Key Visualizer 검사에는 히트맵의 하단과 오른쪽에 막대 그래프로 집계 값이 포함됩니다. 집계 값 위로 마우스를 가져가면 Key Visualizer는 히트맵의 좁은 영역을 강조표시하고 다음 정보를 표시합니다.
x축의 경우 Key Visualizer는 합계값 또는 최댓값과 함께 현재 측정항목의 평균값을 표시합니다. 이 값은 모든 표시된 키 범위에 대해 15분 간격으로 나타납니다.
y축의 경우 Key Visualizer는 키 범위로 세분화된 공개 시간 범위의 현재 측정항목 평균값을 표시합니다.
한도
검사용 최소 테이블 크기
Key Visualizer는 데이터가 클러스터당 최소 1GB 이상 포함된 테이블에 사용할 수 있습니다. 테이블이 해당 크기에 도달한 후 최대 1시간이 지나야 스캔할 수 있습니다.
시간 범위
최솟값: Key Visualizer에 표시할 수 있는 가장 짧은 시간 범위는 15분입니다.
최댓값: 표시할 수 있는 가장 긴 시간 범위는 14일입니다.
증분 크기: Key Visualizer 데이터는 15분 단위로 제공됩니다.
데이터 기간
Key Visualizer에는 지난 14일간의 데이터가 제공됩니다. 예를 들어 12월 19일 오후 12시 45분에 Key Visualizer를 실행한 경우 시간 범위에 선택할 수 있는 가장 빠른 시작 시간은 12월 5일 오후 12시 45분입니다.
또한 이 한도는 Key Visualizer 검사의 URL을 북마크하거나 공유할 경우 URL의 최대 수명이 14일이라는 의미입니다.
[[["이해하기 쉬움","easyToUnderstand","thumb-up"],["문제가 해결됨","solvedMyProblem","thumb-up"],["기타","otherUp","thumb-up"]],[["이해하기 어려움","hardToUnderstand","thumb-down"],["잘못된 정보 또는 샘플 코드","incorrectInformationOrSampleCode","thumb-down"],["필요한 정보/샘플이 없음","missingTheInformationSamplesINeed","thumb-down"],["번역 문제","translationIssue","thumb-down"],["기타","otherDown","thumb-down"]],["최종 업데이트: 2025-09-04(UTC)"],[[["\u003cp\u003eKey Visualizer is a diagnostic tool for Bigtable that generates visual reports to analyze data usage patterns based on accessed row keys.\u003c/p\u003e\n"],["\u003cp\u003eThis tool helps with schema design, troubleshooting performance, and understanding data access within Bigtable tables by identifying hotspots, overly large rows, and unbalanced access.\u003c/p\u003e\n"],["\u003cp\u003eKey Visualizer uses heatmaps, showing metric values over time and across row key ranges, where colors indicate the intensity of usage, alongside aggregate values to understand overall usage.\u003c/p\u003e\n"],["\u003cp\u003eThe tool breaks down row keys into a hierarchy of tabs, where applicable, and uses "key buckets," which are contiguous ranges of row keys, to manage and display metrics efficiently for large tables.\u003c/p\u003e\n"],["\u003cp\u003eKey Visualizer has limitations such as requiring at least 1 GB of data per cluster, data is only available within the past 14 days, and the shortest time span that can be viewed is 15 minutes.\u003c/p\u003e\n"]]],[],null,["# Overview of Key Visualizer\n==========================\n\nThis page provides an overview of the Key Visualizer diagnostic tool for\nBigtable.\n\nWhat is Key Visualizer?\n-----------------------\n\nKey Visualizer is a tool that helps you analyze your Bigtable\nusage patterns. It generates visual reports for your tables that break down your\nusage based on the row keys that you access.\n\nKey Visualizer can provide insights into usage patterns at scale that are\ndifficult to understand otherwise. Uses for Key Visualizer include the\nfollowing:\n\n- Iteratively designing a schema or improving the design of an existing schema. In each iteration, you check Key Visualizer to spot problems your schema may be causing, then tweak your schema and check again.\n- Troubleshooting performance issues.\n- Getting a better understanding of how you access the data that you store in Bigtable.\n\nTo accomplish these goals, Key Visualizer can help you complete the\nfollowing tasks:\n\n- Check whether your reads or writes are creating hotspots on specific rows\n- Find rows that contain too much data\n- Look at whether your access patterns are balanced across all of the rows in a table\n\nAlthough Key Visualizer shows a variety of metrics, it doesn't display every\nsingle metric that can affect the performance of Bigtable. For\nexample, if there are network issues between your application and Google Cloud,\nthose network issues might not be visible, or they might appear as vertical\nbands across all keys in Key Visualizer, which only gives you hints about\n*when* the problems occurred. If you can't identify the cause of a performance\nissue by looking at your Key Visualizer scans, you'll need to do additional\ntroubleshooting.\n\nKey Visualizer scans\n--------------------\n\nThe following image shows a Key Visualizer scan. Each scan includes a few\ndifferent types of information:\n\n- A large [heatmap](#heatmaps), which shows access patterns for a group of row keys over time.\n- [Aggregate values](#aggregate-values) along each axis of the heatmap, including average values and either total or maximum values.\n\nKey Visualizer also provides tools to help you understand the data in each scan.\nIf you haven't used Key Visualizer before, see [Getting Started with Key\nVisualizer](/bigtable/docs/keyvis-getting-started) for instructions. If you're a more\nexperienced user, see [Exploring Heatmaps](/bigtable/docs/keyvis-exploring-heatmaps) for\ndetails.\n\nHeatmaps\n--------\n\nThe core of a Key Visualizer scan is the heatmap, which shows the value of a\nmetric over time, broken down into contiguous ranges of row keys. The x-axis of\nthe heatmap represents time, and the y-axis represents row keys. If the metric\nhad a low value for a group of row keys at a point in time, the metric is\n\"cold,\" and it appears in a dark color. A high value is \"hot,\" and it appears in\na bright color; the highest values appear in white.\n\nDifferent types of usage result in different visual patterns within the heatmap,\nwhich can make it possible to diagnose issues at a glance. See [Heatmap\nPatterns](/bigtable/docs/keyvis-patterns) for examples of some common patterns.\n\nBy default, a Key Visualizer heatmap shows the **Ops** metric, which represents\nthe combined number of reads and writes. You can switch to the heatmap for a\ndifferent metric at any time. See [Switching metrics](/bigtable/docs/keyvis-exploring-heatmaps#switching-metrics)\nfor details.\n\nYou can also [view more than one metric at a time](/bigtable/docs/keyvis-exploring-heatmaps#finding-connections),\nwhich can help you find connections between different metrics.\n\n### Hierarchical row keys\n\n\nRow keys are often composed of a hierarchy of values, with each value separated by a delimiter. For\nexample, the row key `memusage#1423523569918` contains an identifier for all rows that\ncapture memory usage, followed by a timestamp that identifies a specific set of data within that\ngroup.\n\nKey Visualizer automatically recognizes this type of row key and breaks it down\ninto a hierarchy of tabs, as shown on the left side of the example above. This\nfeature helps you understand how your data and access patterns are distributed\nacross the table's rows. It also enables you to drill down into the data for\nspecific ranges of row keys more quickly.\n\nIf your row keys are not composed of multiple values, Key Visualizer still\ndisplays tabs on the left side of the scan, but the tabs might split up your row\nkeys in unexpected ways rather than presenting a clear hierarchy.\n\n### Key buckets\n\n\nA Bigtable table can have trillions of rows, so it's not always practical to report\nmetrics for each individual row. Instead, Key Visualizer divides all of the row keys into 1,000\ncontiguous ranges, with roughly the same number of row keys in each range. These ranges are known\nas *key buckets*.\n\n\nKey Visualizer reports most metrics as averages over each key bucket, or as maximum values within\neach key bucket. For [**Warnings** metrics](/bigtable/docs/keyvis-metrics#warnings)\nand [**Performance** metrics](/bigtable/docs/keyvis-metrics#performance), Key\nVisualizer provides higher precision by reporting metrics for individual row keys or for specific\nkey ranges within the key bucket.\n\n\u003cbr /\u003e\n\nBehind the scenes, Key Visualizer generates new scan data every 15 minutes. In\norder to be able to concatenate data in contiguous time periods, Key Visualizer\ntries to keep the same key buckets as the previous 15-minute period. It is also\npossible that keys that are deleted still show up as bucket boundaries. Because\ntables change over time as data is added and removed, key buckets are\nsometimes recalculated so that they are balanced.\n| **Note:** If the keys in the table change rapidly, expect to see many bucket boundaries. This effect may go away over time as the key space grows in size.\n\nKey Visualizer also generates a new set of key buckets every two weeks, even if\nthe table has not changed a lot, just to remove any residual bucket boundaries\nfrom deleted keys. As a result, even if your table is stable, you will notice\nthat your key buckets are updated occasionally.\n\nAggregate values\n----------------\n\nIn addition to the heatmap, a Key Visualizer scan includes aggregate values in\nbar charts along the bottom and right sides of the heatmap. When you hover over\nthe aggregate values, Key Visualizer highlights a narrow area in the heatmap and\nshows the following information:\n\n- For the x-axis, Key Visualizer shows the average value for the current metric, along with either the total or maximum value. These values appear for all of the visible key ranges in 15-minute intervals.\n- For the y-axis, Key Visualizer shows the average value for the current metric across the visible time range, broken down into key ranges.\n\nLimits\n------\n\n### Minimum table size for scans\n\n\nKey Visualizer is available for tables that contain at least 1 GB of data per cluster. It can\ntake up to an hour after a table reaches that size for scans to be available.\n\n\u003cbr /\u003e\n\n### Time spans\n\n- **Minimum**: The shortest time span you can view in Key Visualizer is 15 minutes.\n- **Maximum**: The longest time span you can view is 14 days.\n- **Increment size**: Key Visualizer data is available in 15-minute increments.\n\n### Data duration\n\nKey Visualizer data is available for the last 14 days. For example, if you\nlaunch Key Visualizer on December 19 at 12:45 PM, the earliest start time you\ncan choose for a time span is December 5 at 12:45 PM.\n\nThis limit also means that if you bookmark or share the URL for a Key Visualizer\nscan, the URL has a maximum life of 14 days.\n\nWhat's next\n-----------\n\n- Learn how to [get started with Key Visualizer](/bigtable/docs/keyvis-getting-started).\n- Understand the [patterns you might see in Key Visualizer\n heatmaps](/bigtable/docs/keyvis-patterns).\n- Find out how to [explore a heatmap in detail](/bigtable/docs/keyvis-exploring-heatmaps).\n- Read about the [metrics you can view in a heatmap](/bigtable/docs/keyvis-metrics).\n- Watch a video about how [Twitter used Key Visualizer](https://youtu.be/3QHGhnHx5HQ) to design its Bigtable schema."]]