このドキュメントでは、マイクロサービスについて紹介し、Cloud Monitoring でサポートされているマイクロサービスの種類について説明します。
マイクロサービスという用語は、人によってとらえる意味が変わります。システム アーキテクチャについて語った場合に、マイクロサービスをホワイトボード上に描かれる「箱」と捉える人もいます。一方で、より公式的な定義、つまり、システム内の他のマイクロサービスとは無関係に開発、デプロイ、運用できる外向きの API により確定される機能を持つ、ネットワーク アドレスが割り振り可能なエンドポイントと解釈する人もいます。App Engine サービスまたは Cloud Service Mesh サービスなどの開発プラットフォームによりもたらされるマイクロサービスのコンセプトに沿った理解をする人もまだいます。
Google では、マイクロサービスに関する定義を強制することはありません。Google は、お客様とお客様のアーキテクチャをサポートするサービス指向のモニタリング ツールを提供することにより、お客様がデジタル トランスフォーメーションでシステムのモニタリングを大規模に行えるよう支援したいと考えています。コードを 1 行も変更せずに、お客様がシステムをモニタリングするためのベスト プラクティスを採用できるよう Google がサポートします。
マイクロサービスをモニタリングするために、Cloud Monitoring は次の処理を行います。
- 可能であればマイクロサービスを自動検出する
- Google Kubernetes Engine と Cloud Run ベースのマイクロサービスを定義するガイドを提供する
- 最大の柔軟性を実現する完全なカスタム ソリューションを提供する
自動検出されたマイクロサービス
一部の最新の開発フレームワークでは、マイクロサービスについて独自のコンセプトを提供しています。このようなフレームワークを使用するアーキテクチャでは、Cloud Monitoring は、サービスがデプロイ、更新、削除されたタイミングを自動的に検出します。Monitoring は、プロジェクトによって生成されたメタデータ ストリームの定数分析を通じて、この検出を示現します。
Cloud Monitoring は、以下の開発フレームワークを適用して構築されたマイクロサービスを自動的に検出できます。
App Engine: App Engine には、App Engine サービス(旧称「モジュール」)と呼ばれるマイクロサービスの色濃い概念が反映されています。各サービスは、独自の
app.yaml構成ファイルによって区別されます。Cloud Service Mesh: Cloud Monitoring は、単一の GKE クラスタ上に構築されたサービス メッシュをサポートしています。この構成では、Cloud Service Mesh サービスは GKE サービスに直接対応します。ユーザー管理型とシステム管理型の両方の Cloud Service Mesh サービスすべてが自動的に検出されます。
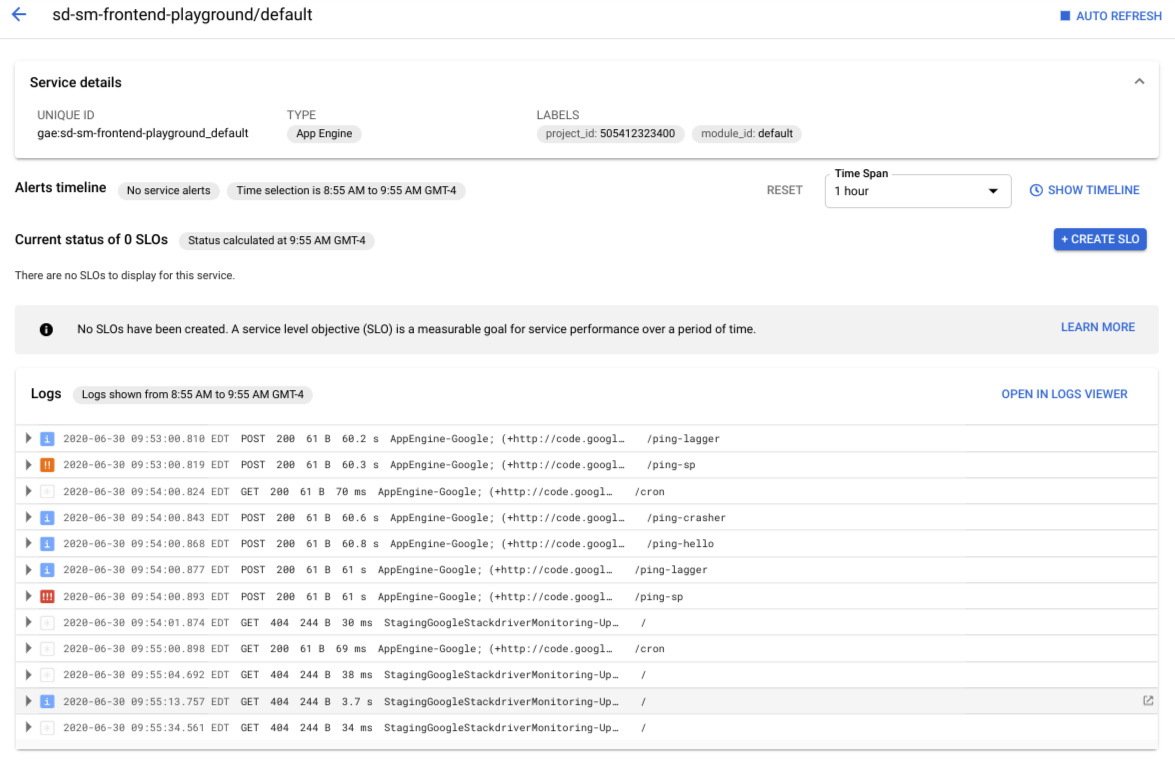
自動検出されたマイクロサービスのダッシュボード
自動検出されたすべてのマイクロサービスに対して、サービス ダッシュボードが自動的に作成されます。ダッシュボードには、サービスのメタデータの詳細、アラートのタイムライン、サービスレベル目標(SLO)のステータス、サービスに関連するログが表示されます。これらの各コンポーネントの詳細については、マイクロサービス ダッシュボードの使用をご覧ください。
GKE、Cloud Run、カスタム サービス
Cloud Monitoring では、次のタイプの潜在的または候補となるサービスを特定できます。
- GKE Namespace
- GKE サービス
- GKE ワークロード
- Cloud Run サービス
ただし、このような候補は多数あり、必ずしもそれらのすべてに SLO を作成するとは限りません。Monitoring は候補となるサービスのリストを作成します。リストからサービスを選択することで、Monitoring サービスとして扱うサービスを指定します。Monitoring はサービス インフラストラクチャを作成します。
SLO を作成するアプリケーションに対応できる既存のサービスタイプがない場合は、カスタム サービスを定義できます。
候補となるサービスの特定とカスタム サービスの作成の詳細については、マイクロサービスの定義をご覧ください。