Google Cloud Managed Service for Prometheus is Google Cloud's fully managed, multi-cloud, cross-project solution for Prometheus and OpenTelemetry metrics. It lets you globally monitor and alert on your workloads, using Prometheus and OpenTelemetry, without having to manually manage and operate Prometheus at scale.
Managed Service for Prometheus collects metrics from Prometheus exporters and lets you query the data globally using PromQL, meaning that you can keep using any existing Grafana dashboards, PromQL-based alerts, and workflows. It is hybrid- and multi-cloud compatible, can monitor Kubernetes, VMs, and serverless workloads on Cloud Run, retains data for 24 months, and maintains portability by staying compatible with upstream Prometheus. You can also supplement your Prometheus monitoring by querying over 6,500 free metrics in Cloud Monitoring, including free GKE system metrics, using PromQL.
This document gives an overview of the managed service, and further documents describe how to set up and run the service. To receive regular updates about new features and releases, submit the optional sign-up form.
Hear how The Home Depot uses Managed Service for Prometheus to get unified observability across 2,200 stores running on-prem Kubernetes clusters:
System overview
Google Cloud Managed Service for Prometheus gives you the familiarity of Prometheus backed by the global, multi-cloud, and cross-project infrastructure of Cloud Monitoring.
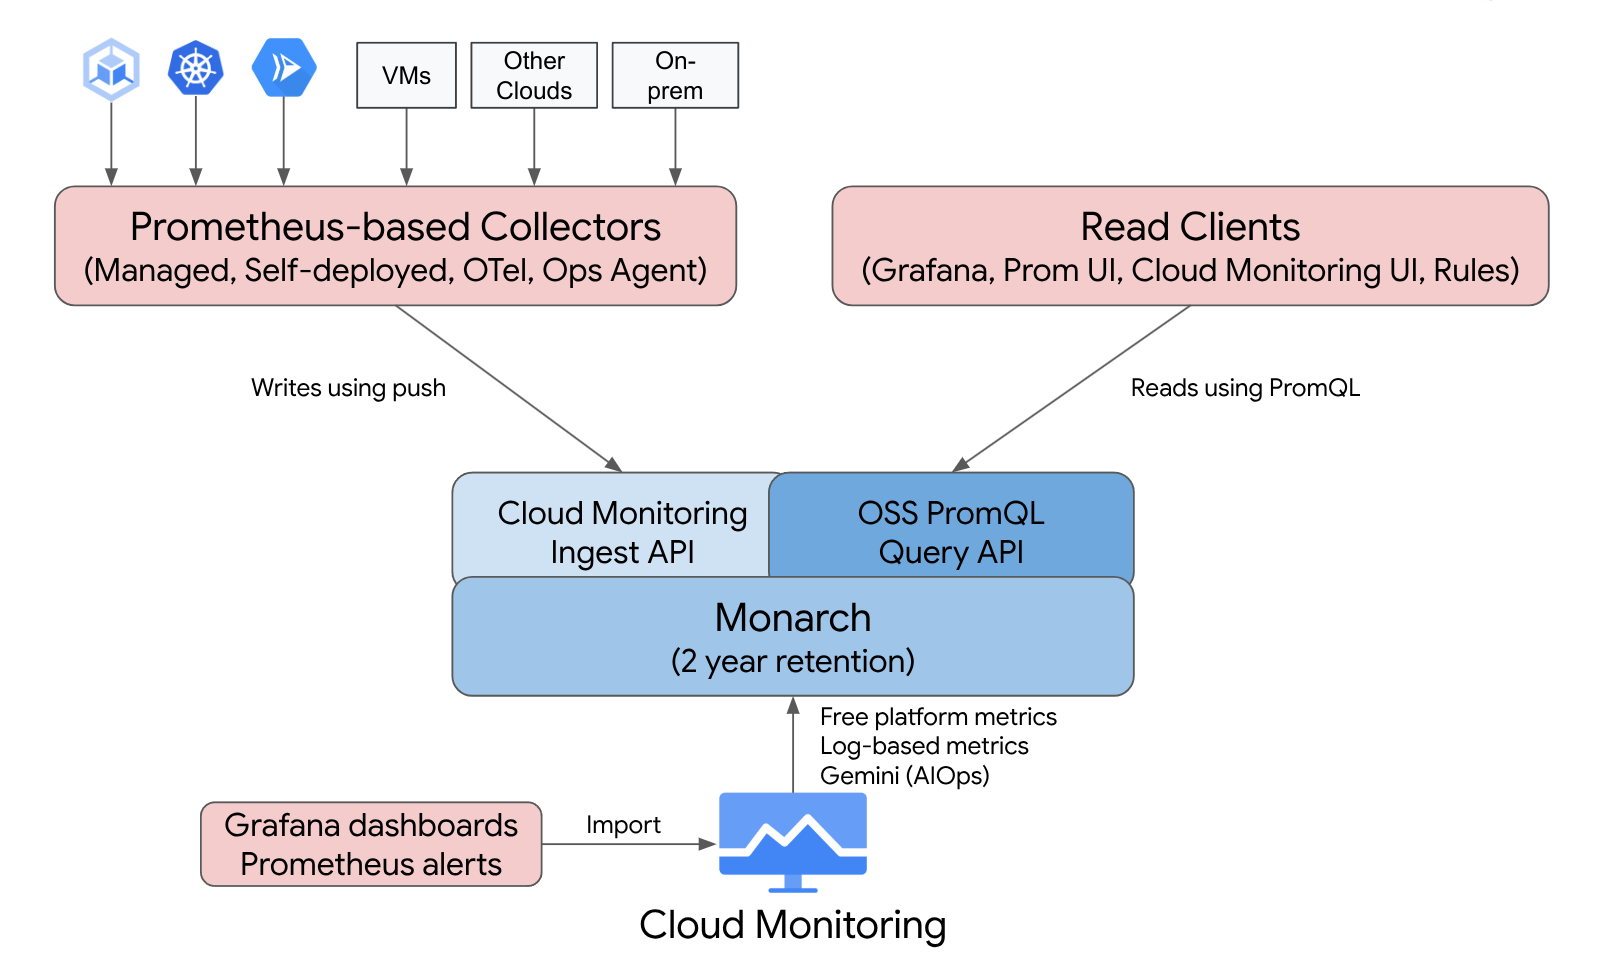
Managed Service for Prometheus is built on top of Monarch, the same globally scalable datastore used for Google's own monitoring. Because Managed Service for Prometheus uses the same backend and APIs as Cloud Monitoring, both Cloud Monitoring metrics and metrics ingested by Managed Service for Prometheus are queryable by using PromQL in Cloud Monitoring, Grafana, or any other tool that can read the Prometheus API.
In a standard Prometheus deployment, data collection, query evaluation, rule and alert evaluation, and data storage are all handled within a single Prometheus server. Managed Service for Prometheus splits responsibilities for these functions into multiple components:
- Data collection is handled by managed collectors, self-deployed collectors, the OpenTelemetry Collector, or the Ops Agent, which scrape local exporters and forward the collected data to Monarch. These collectors can be used for Kubernetes, serverless, and traditional VM workloads and can run everywhere, including other clouds and on-prem deployments.
- Query evaluation is handled by Monarch, which executes queries and unions results across all Google Cloud regions and across up to 3,500 Google Cloud projects.
- Rule and alert evaluation is handled either by writing PromQL alerts in Cloud Monitoring which fully execute in the cloud, or by using locally run and locally configured rule evaluator components which execute rules and alerts against the global Monarch data store and forward any fired alerts to Prometheus AlertManager.
- Data storage is handled by Monarch, which stores all Prometheus data for 24 months at no additional cost.
Grafana connects to the global Monarch data store instead of connecting to individual Prometheus servers. If you have Managed Service for Prometheus collectors configured in all your deployments, then this single Grafana instance gives you a unified view of all your metrics across all your clouds.
Data collection
You can use Managed Service for Prometheus in one of four modes: with managed data collection, with self-deployed data collection, with the OpenTelemetry Collector, or with the Ops Agent.
Managed Service for Prometheus offers an operator for managed data collection in Kubernetes environments. We recommend that you use managed collection; using it eliminates the complexity of deploying, scaling, sharding, configuring, and maintaining Prometheus servers. Managed collection is supported for both GKE and non-GKE Kubernetes environments.
With self-deployed data collection, you manage your Prometheus installation as you always have. The only difference from upstream Prometheus is that you run the Managed Service for Prometheus drop-in replacement binary instead of the upstream Prometheus binary.
The OpenTelemetry Collector can be used to scrape Prometheus exporters and send data to Managed Service for Prometheus. OpenTelemetry supports a single-agent strategy for all signals, where one collector can be used for metrics (including Prometheus metrics), logs, and traces in any environment.
You can configure the Ops Agent on any Compute Engine instance to scrape and send Prometheus metrics to the global datastore. Using an agent greatly simplifies VM discovery and eliminates the need to install, deploy, or configure Prometheus in VM environments.
If you have a Cloud Run service that writes Prometheus metrics or OTLP metrics, then you can use a sidecar and Managed Service for Prometheus to send the metrics to Cloud Monitoring.
- To collect Prometheus metrics from Cloud Run, use the Prometheus sidecar.
- To collect OTLP metrics from Cloud Run, use the OpenTelemetry sidecar.
You can run managed, self-deployed, and OpenTelemetry collectors in on-prem deployments and on any cloud. Collectors running outside of Google Cloud send data to Monarch for long-term storage and global querying.
When choosing between collection options, consider the following:
Managed collection:
- Google's recommended approach for all Kubernetes environments.
- Deployed by using the GKE UI, the gcloud CLI,
the
kubectlCLI, or Terraform. - Operation of Prometheus—generating scrape configurations, scaling ingestion, scoping rules to the right data, and so forth—is fully handled by the Kubernetes operator.
- Scraping and rules are configured by using lightweight custom resources (CRs).
- Good for those who want a more hands-off, fully managed experience.
- Intuitive migration from prometheus-operator configs.
- Supports most current Prometheus use cases.
- Full assistance from Google Cloud technical support.
Self-deployed collection:
- A drop-in replacement for the upstream Prometheus binary.
- You can use your preferred deployment mechanism, like prometheus-operator or manual deployment.
- Scraping is configured by using your preferred methods, like annotations or prometheus-operator.
- Scaling and functional sharding is done manually.
- Good for quick integration into more complex existing setups. You can reuse your existing configs and run upstream Prometheus and Managed Service for Prometheus side by side.
- Rules and alerts typically run within individual Prometheus servers, which might be preferable for edge deployments as local rule evaluation does not incur any network traffic.
- Might support long-tail use cases that aren't yet supported by managed collection, such as local aggregations to reduce cardinality.
- Limited assistance from Google Cloud technical support.
The OpenTelemetry Collector:
- A single collector that can collect metrics (including Prometheus metrics) from any environment and send them to any compatible backend. Can also be used to collect logs and traces and send them to any compatible backend, including Cloud Logging and Cloud Trace.
- Deployed in any compute or Kubernetes environment either manually or by using Terraform. Can be used to send metrics from stateless environments such as Cloud Run.
- Scraping is configured using Prometheus-like configs in the collector's Prometheus receiver.
- Supports push-based metric collection patterns.
- Metadata is injected from any cloud using resource detector processors.
- Rules and alerts can be executed using a Cloud Monitoring alerting policy or the stand-alone rule evaluator.
- Best supports cross-signal workflows and features such as exemplars.
- Limited assistance from Google Cloud technical support.
The Ops Agent:
- The easiest way to collect and send Prometheus metric data originating from Compute Engine environments, including both Linux and Windows distros.
- Deployed by using the gcloud CLI, the Compute Engine UI, or Terraform.
- Scraping is configured using Prometheus-like configs in the Agent's Prometheus receiver, powered by OpenTelemetry.
- Rules and alerts can be executed using Cloud Monitoring or the stand-alone rule evaluator.
- Comes bundled with optional Logging agents and process metrics.
- Full assistance from Google Cloud technical support. To get started, see Get started with managed collection, Get started with self-deployed collection, Get started with the OpenTelemetry Collector, or Get started with the Ops Agent.
If you use the managed service outside of Google Kubernetes Engine or Google Cloud, some additional configuration might be necessary; see Run managed collection outside of Google Cloud, Run self-deployed collection outside of Google Cloud, or Add OpenTelemetry processors.
Query evaluation
Managed Service for Prometheus supports any query UI that can call the Prometheus query API, including Grafana and the Cloud Monitoring UI. Existing Grafana dashboards continue to work when switching from local Prometheus to Managed Service for Prometheus, and you can continue using PromQL found in popular open-source repositories and on community forums.
You can use PromQL to query over 6,500 free metrics in Cloud Monitoring, even without sending data to Managed Service for Prometheus. You can also use PromQL to query free Kubernetes metrics, custom metrics and log-based metrics.
For information on how to configure Grafana to query Managed Service for Prometheus data, see Query using Grafana.
For information on how to query Cloud Monitoring metrics using PromQL, see PromQL in Cloud Monitoring.
Rule and alert evaluation
Managed Service for Prometheus provides both a fully cloud-based alerting pipeline and a stand-alone rule evaluator, both of which evaluate rules against all Monarch data accessible in a metrics scope. Evaluating rules against a multi-project metrics scope eliminates the need to co-locate all data of interest on a single Prometheus server or within a single Google Cloud project, and it lets you set IAM permissions on groups of projects.
Because all rule evaluation options accept the standard Prometheus rule_files
format, you can easily migrate to Managed Service for Prometheus by copy-pasting
existing rules or by copy-pasting rules found in popular open source
repositories. For those using self-deployed collectors, you can continue to
evaluate recording rules locally in your collectors. The results of recording
and alerting rules are stored in Monarch, just like directly
collected metric data. You can also migrate your Prometheus alerting rules to
PromQL-based alerting policies in Cloud Monitoring.
For alert evaluation with Cloud Monitoring, see PromQL alerts in Cloud Monitoring.
For rule evaluation with managed collection, see Managed rule evaluation and alerting.
For rule evaluation with self-deployed collection, the OpenTelemetry Collector, and the Ops Agent, see Self-deployed rule evaluation and alerting.
For information on reducing cardinality using recording rules on self-deployed collectors, see Cost controls and attribution.
Data storage
All Managed Service for Prometheus data is stored for 24 months at no additional cost.
Managed Service for Prometheus supports a minimum scrape interval of 5 seconds. Data is stored at full granularity for 1 week, then is downsampled to 1-minute points for the next 5 weeks, then is downsampled to 10-minute points and stored for the remainder of the retention period.
Managed Service for Prometheus has no limit on the number of active time series or total time series.
For more information, see Quotas and limits within the Cloud Monitoring documentation.
Billing and quotas
Managed Service for Prometheus is a Google Cloud product, and billing and usage quotas apply.
Billing
Billing for the service is based primarily on the number of metric samples ingested into storage. There is also a nominal charge for read API calls. Managed Service for Prometheus does not charge for storage or retention of metric data.
- For current pricing, see Google Cloud Managed Service for Prometheus pricing summary.
- To estimate your bill based on your expected number of time series or your expected samples per second, see the Cloud Operations tab within the Google Cloud Pricing Calculator.
- For tips on how to lower your bill or determine the sources of high costs, see Cost controls and attribution.
- For information about the rationale for the pricing model, see Pricing for controllability and predictability.
- For pricing examples, see Pricing example based on samples ingested.
Quotas
Managed Service for Prometheus shares ingest and read quotas with Cloud Monitoring. The default ingest quota is 500 QPS per project with up to 200 samples in a single call, equivalent to 100,000 samples per second. The default read quota is 100 QPS per metrics scope.
You can increase these quotas to support your metric and query volumes. For information about managing quotas and requesting quota increases, see Working with quotas.
Terms of Service and compliance
Managed Service for Prometheus is part of Cloud Monitoring and therefore inherits certain agreements and certifications from Cloud Monitoring, including (but not limited to):
- The Google Cloud terms of service
- The Operations Service Level Agreement (SLA)
- US DISA and FedRAMP compliance levels
- VPC-SC (VPC Service Controls) support
What's next
- Get started with managed collection.
- Get started with self-deployed collection.
- Get started with the OpenTelemetry Collector.
- Get started with the Ops Agent.
- Use PromQL in Cloud Monitoring to query Prometheus metrics.
- Use Grafana to query Prometheus metrics.
- Query Cloud Monitoring metrics using PromQL.
- Read up on best practices and view architecture diagrams.