このページでは、Spanner リクエストに関わる上位コンポーネントの概要と、各コンポーネントがレイテンシに与える影響について説明します。
Spanner API リクエスト
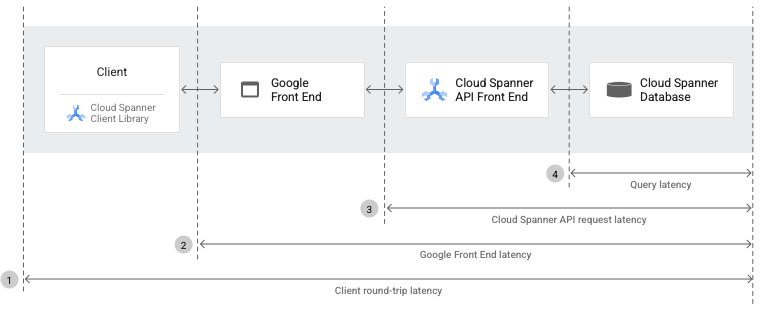
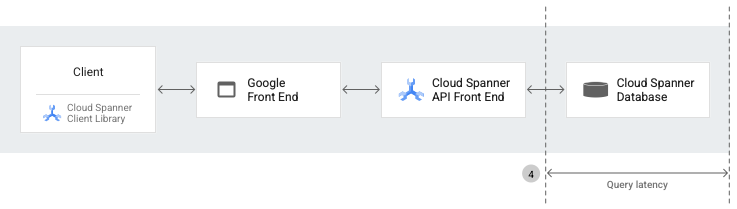
Spanner API リクエストの作成に使用される上位コンポーネントは、次のとおりです。
Spanner クライアント ライブラリ。gRPC の上に抽象化レイヤを提供し、セッション管理、トランザクション、再試行などのサーバー通信の詳細を処理します。
Google Front End(GFE)。Spanner を含むすべての Google Cloud サービスに共通のインフラストラクチャ サービスです。GFE は、すべての Transport Layer Security(TLS)接続が停止していることを確認し、サービス拒否攻撃に対する保護を適用します。GFE の詳細については、Google Front End サービスをご覧ください。
Cloud Spanner API フロントエンド(AFE)。API リクエストに対してさまざまなチェック(認証、承認、割り当てチェック)が実施され、セッションとトランザクションの状態が維持されます。
Spanner データベース。データベースに対する読み取りと書き込みを実行します。
Spanner にリモート プロシージャ コールを行うと、Spanner クライアント ライブラリによって API リクエストが準備されます。次に、API リクエストは Spanner データベースに到達する前に、GFE と Spanner AFE の両方を通過します。
さまざまなコンポーネントとデータベース間のリクエストのレイテンシを測定し、比較することで、問題の原因となっているコンポーネントを特定できます。これらのレイテンシには、クライアントの往復、GFE、Spanner API リクエスト、クエリのレイテンシが含まれます。
以降のセクションでは、前の図で示した各種類のレイテンシについて説明します。
クライアントの往復レイテンシ
クライアントのラウンドトリップ レイテンシは、クライアントが GFE と Spanner API フロントエンドの両方からデータベースに送信する Spanner API リクエストの最初のバイトと、クライアントがデータベースから受信したレスポンスの最後のバイトの間の時間(ミリ秒単位)です。
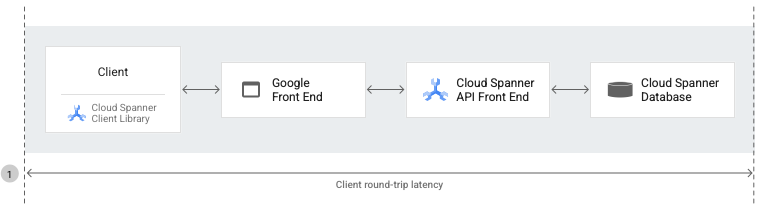
grpc.io/client/roundtrip_latency 指標は、送信された API リクエストの最初のバイトから受信されたレスポンスの最後のバイトまでの時間を表します。
このコンポーネントのレイテンシをキャプチャして可視化するには、OpenTelemetry または OpenCensus を使用してクライアントの往復レイテンシをキャプチャするをご覧ください。
GFE レイテンシ
Google Front End(GFE)レイテンシは、Google ネットワークがクライアントからリモート プロシージャ コールを受信してから、GFE がレスポンスの最初のバイトを受信するまでの時間(ミリ秒単位)です。このレイテンシには TCP/SSL handshake は含まれません。
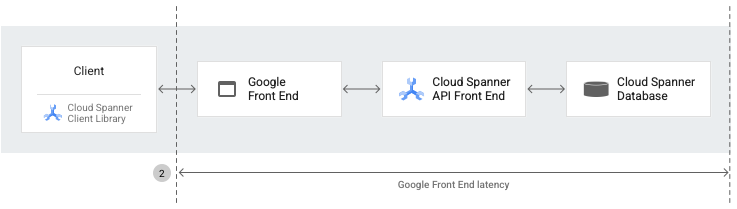
REST、gRPC のいずれでも、Spanner からのすべてのレスポンスには、リクエストとレスポンスの両方に対する GFE とバックエンド(Spanner サービス)間の合計時間を含んだヘッダーが含まれています。これは、クライアントと Google ネットワーク間のレイテンシの原因をいっそう際立たせるのに役立ちます。
spanner/gfe_latency 指標によって、Spanner リクエストに対する GFE レイテンシがキャプチャされ公開されます。
このコンポーネントのレイテンシをキャプチャして可視化するには、OpenTelemetry を使用して GFE のレイテンシをキャプチャするまたは OpenCensus を使用して GFE のレイテンシをキャプチャするをご覧ください。
Spanner API リクエストのレイテンシ
Spanner API リクエストのレイテンシは、Spanner AFE が受信したリクエストの最初のバイトから Spanner API フロントエンドが送信したレスポンスの最後のバイトまでの時間(秒単位)です。レイテンシには、Spanner バックエンドと API レイヤの両方で API リクエストの処理に必要な時間が含まれます。ただし、このレイテンシには、Spanner クライアントとサーバーの間のネットワークやリバース プロキシのオーバーヘッドは含まれません。
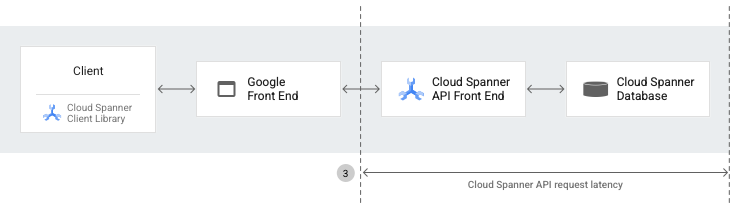
spanner.googleapis.com/api/request_latencies 指標によって、Spanner リクエストに対する Spanner AFE レイテンシがキャプチャされ公開されます。
このコンポーネントのレイテンシをキャプチャして可視化するには、OpenCensus または OpenTelemetry を使用して Spanner API リクエストのレイテンシをキャプチャするをご覧ください。
クエリのレイテンシ
このクエリのレイテンシは、Spanner データベースで SQL クエリを実行するのにかかる時間の長さ(ミリ秒単位)です。
クエリのレイテンシは executeSql API で使用できます。
QueryMode パラメータを WITH_STATS または WITH_PLAN_AND_STATS に設定すると、Spanner の ResultSetStats をレスポンスで使用できます。ResultSetStats には、Spanner データベースでのクエリの実行時間も含まれます。
このコンポーネントのレイテンシをキャプチャして可視化するには、OpenTelemetry を使用してクエリのレイテンシをキャプチャするまたは OpenCensus を使用してクエリのレイテンシをキャプチャするをご覧ください。
次のステップ
- Spanner コンポーネントのレイテンシ ポイントを特定する方法を学習します。