このページでは、Key Visualizer ヒートマップで表示される可能性があるパターンの例を示します。これらのパターンは、特定のパフォーマンスの問題のトラブルシューティングに役立ちます。
Key Visualizer で明らかになる問題の中には、主キーの定義に関連する問題があります。主キーは不変であるため、この問題は設計または概念実証の段階で最もよく検出されます。
その他の問題は、インスタンスのノード割り当てに関連している可能性があります。全体的に、または特定の時間帯に、追加の容量をプロビジョニングすることが必要になる場合があります。インスタンスに関連付けられているノードの数を変更するには、ノードの数の変更をご覧ください。
- Key Visualizer スキャンを開く方法については、特定の期間のスキャン結果を表示するをご覧ください。
- Key Visualizer スキャンを詳しく確認する方法については、ヒートマップの確認をご覧ください。
このページを読む前に、Key Visualizer の概要を理解しておく必要があります。
読み取り / 書き込みの均等分布
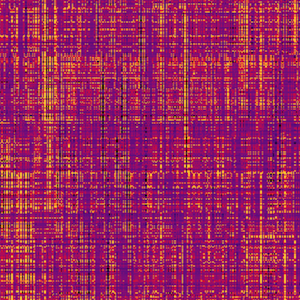
ヒートマップで明るい色と暗い色がきめ細かく混在している場合、読み取りと書き込みがデータベース全体で均等に行われています。このヒートマップは Spanner の効果的な使用パターンを表しているため、何もする必要はありません。
独自のヒートマップは、これほど均等に分散されていない場合がありますが、健全なスキーマとワークロードを示しています。適切にリソースが割り当てられた構成では、ホットスポットがいくつか発生することが予想されます。
単調に増加するキー

単一の明るい斜線が書かれたヒートマップ、または上部が平らな三角形は、シーケンシャルキーを使用するデータベースを示すことができます。順次鍵は Spanner のアンチパターンです。順次鍵でホットスポットが発生する理由については、スキーマ設計のベスト プラクティス ページをご覧ください。
一定のホットキー範囲
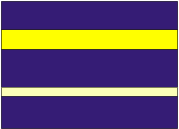
ヒートマップでは、明るい色の水平の帯が濃い色で表示され、暗い色で区切られている場合、特定の行範囲が時系列で一貫してアクセスする量が多いことを示します。
この問題に対処するには、使用頻度の高い行のデータや非常に大きな行のデータが複数の行に分散されるように、スキーマ設計またはアプリケーションを変更することを検討してください。
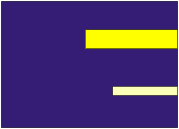
1 つのホットテーブル

ヒートマップに明るい色の帯が 1 つのテーブルで表示されている場合は、そのテーブルに時間とともに大きなアクセスが発生していることを示します。
このパターンだけでは、必ずしも問題になるわけではありません。パフォーマンスの問題との組み合わせでこのパターンが見られる場合は、コンピューティング容量が尽きようとしている可能性があります。注意事項:
アプリケーションがテーブル全体のスキャンをリクエストしている可能性があります。その場合は、テーブル全体が明るい帯として Key Visualizer に表示されます。代わりに、より制限されたクエリを使用するか、インデックスに対するクエリを実行して、スキャンされる行数を減らしてください。
このインスタンスのノード数を増やします。
一定の頻度での読み取りと書き込み

複数の斜線が明るい線(上昇または下降)を示しているヒートマップは、通常、短時間での行でのシーケンシャルな読み取りまたは書き込みを表しています。
線がテーブルのエクスポートなどの読み取りアクティビティに該当する場合、何もする必要はありません。このような読み取り中にパフォーマンスの問題が発生した場合は、これらの期間中にインスタンスのノード数を増やすことを検討してください。ノード数はそれらの期間外では減らすことができます。
行が書き込みアクティビティに該当していて、パフォーマンスの問題が発生している場合は、順次書き込みではなくランダム書き込みにワークロードを変更することを検討してください。
トラフィックの急激な増加
ヒートマップの途中に表示される明るい水平帯を示すヒートマップは、データベースの使用パターンが急激に変化したことを示しています。これは、不正なクエリや、特定の行のアクティビティが予期せず急増した可能性があります。
注意点
Key Visualizer がパフォーマンスとリソース使用量の全体像を表示できない場合もあります。
| シナリオ | ヒートマップに表示される内容 |
|---|---|
| 大規模なデータテーブルと小さなテーブル | Key Visualizer は、小さなテーブルよりも大きなテーブルでより多くの行範囲を選択します。そのため、小さなテーブルはヒートマップに 1 つの行範囲としてのみ表示される場合があります。テーブル数が 1,000 未満である限り、すべてのテーブルを表す行範囲があります。小さなテーブルで 1 つのキーまたは狭いキー範囲がホットな場合、ユーザーはそのテーブルがホットであることは認識できますが、それ以上は知ることができません。 |
| 多数のテーブル / インデックス たとえば、データベースには、サイズに関係なく、数百個または千個以上のテーブルがあります。 |
Key Visualizer で選択される行範囲は、1,000 までです。テーブルとインデックスが多数ある場合、その一部はヒートマップにデータポイントを持たない、または 1 つ持つのどちらかしかありません。そのため、ホットスポットは、そのテーブルがスキップされる、または間引かれるため、欠落している可能性があります。 |
| 急速に変化するキー | キースペースの急速な変化によって、行範囲が頻繁に変更されます。キーが新しく挿入されたために前の行範囲を分割する必要がある場合、またはキーが削除されたために複数の行範囲がマージされる場合、指標は近似値が求められます(分割 / 結合など)。指標値の複合近似により、精度が低下する可能性があります。さらに、キースペースが変化すると行範囲の更新に遅延が生じるため、行範囲が更新されるまで精度が悪くなる可能性があります。 |
次のステップ
- Key Visualizer の使い方を学習する。
- ヒートマップの確認方法を理解する。
- ヒートマップで確認できる指標について読む。