This document describes how to create a public uptime check. A public uptime check can issue requests from multiple locations throughout the world to publicly available URLs or Google Cloud resources to see whether the resource responds. For information about how to create uptime checks for private networks, see Create private uptime checks.
Public uptime checks can determine the availability of the following monitored resources:- Uptime check URL
- VM instance
- App Engine application
- Kubernetes service
- Amazon Elastic Compute Cloud (EC2) instance
- Amazon Elastic load balancer
- Cloud Run Revision
For links to information about managing and monitoring your uptime checks, see the What's next section of this document.
This feature is supported only for Google Cloud projects. For App Hub configurations, select the App Hub host project or the app-enabled folder's management project.
About uptime checks
For HTTP and HTTPS, all URL redirects are followed and the final response received by the uptime check is used to evaluate any success criteria. For HTTPS checks, the SSL certificate expiry time is computed based on the server certificate received in the final response.
For an uptime check to succeed, the following conditions must be met:
- The HTTP status must match the criteria you specify.
- The response data has no required content or the required content is present.
Uptime checks don't load page assets or run JavaScript, and the default configuration of an uptime check doesn't include authentication.
Before you begin
Complete the following steps in the Google Cloud project that will store the uptime check:
-
To get the permissions that you need to create uptime checks, ask your administrator to grant you the following IAM roles on your project:
-
Monitoring Editor (
roles/monitoring.editor) - Google Cloud console users -
Monitoring Uptime Check Configurations Editor (
roles/monitoring.uptimeCheckConfigEditor) - API users -
Monitoring AlertPolicy Editor (
roles/monitoring.alertPolicyEditor) - API users -
Monitoring NotificationChannel Editor (
roles/monitoring.notificationChannelEditor) - API users
For more information about granting roles, see Manage access to projects, folders, and organizations.
You might also be able to get the required permissions through custom roles or other predefined roles.
-
Monitoring Editor (
Verify that the resource that you want to check either has a public endpoint or is behind a configurable firewall.
For all other configurations, you must create a private uptime check. For more information, see Create private uptime checks.
When your resource is behind a firewall, configure that firewall to permit incoming traffic from the IP addresses of the uptime-check servers. For more information, see List uptime-check server IP addresses.
Configure the notification channels that you want to use to receive notifications. We recommend that you create multiple types of notification channels. For more information, see Create and manage notification channels.
Identify at least three checkers for your uptime check. The uptime-check region
USAincludes theUSA_OREGON,USA_IOWA, andUSA_VIRGINIAregions. Each of theUSA_*regions has one checker, andUSAincludes all three. The other uptime-check regions,EUROPE,SOUTH_AMERICA, andASIA_PACIFIC, each have one checker.If you select Global when using the Google Cloud console, or select
REGION_UNSPECIFIEDwhen using the API, then uptime checks are issued from all uptime-check regions.-
Select the tab for how you plan to use the samples on this page:
Console
When you use the Google Cloud console to access Google Cloud services and APIs, you don't need to set up authentication.
gcloud
In the Google Cloud console, activate Cloud Shell.
At the bottom of the Google Cloud console, a Cloud Shell session starts and displays a command-line prompt. Cloud Shell is a shell environment with the Google Cloud CLI already installed and with values already set for your current project. It can take a few seconds for the session to initialize.
Terraform
To use the Terraform samples on this page in a local development environment, install and initialize the gcloud CLI, and then set up Application Default Credentials with your user credentials.
Install the Google Cloud CLI.
If you're using an external identity provider (IdP), you must first sign in to the gcloud CLI with your federated identity.
If you're using a local shell, then create local authentication credentials for your user account:
gcloud auth application-default login
You don't need to do this if you're using Cloud Shell.
If an authentication error is returned, and you are using an external identity provider (IdP), confirm that you have signed in to the gcloud CLI with your federated identity.
For more information, see Set up ADC for a local development environment in the Google Cloud authentication documentation.
C#
To use the .NET samples on this page in a local development environment, install and initialize the gcloud CLI, and then set up Application Default Credentials with your user credentials.
Install the Google Cloud CLI.
If you're using an external identity provider (IdP), you must first sign in to the gcloud CLI with your federated identity.
If you're using a local shell, then create local authentication credentials for your user account:
gcloud auth application-default login
You don't need to do this if you're using Cloud Shell.
If an authentication error is returned, and you are using an external identity provider (IdP), confirm that you have signed in to the gcloud CLI with your federated identity.
For more information, see Set up ADC for a local development environment in the Google Cloud authentication documentation.
Go
To use the Go samples on this page in a local development environment, install and initialize the gcloud CLI, and then set up Application Default Credentials with your user credentials.
Install the Google Cloud CLI.
If you're using an external identity provider (IdP), you must first sign in to the gcloud CLI with your federated identity.
If you're using a local shell, then create local authentication credentials for your user account:
gcloud auth application-default login
You don't need to do this if you're using Cloud Shell.
If an authentication error is returned, and you are using an external identity provider (IdP), confirm that you have signed in to the gcloud CLI with your federated identity.
For more information, see Set up ADC for a local development environment in the Google Cloud authentication documentation.
Java
To use the Java samples on this page in a local development environment, install and initialize the gcloud CLI, and then set up Application Default Credentials with your user credentials.
Install the Google Cloud CLI.
If you're using an external identity provider (IdP), you must first sign in to the gcloud CLI with your federated identity.
If you're using a local shell, then create local authentication credentials for your user account:
gcloud auth application-default login
You don't need to do this if you're using Cloud Shell.
If an authentication error is returned, and you are using an external identity provider (IdP), confirm that you have signed in to the gcloud CLI with your federated identity.
For more information, see Set up ADC for a local development environment in the Google Cloud authentication documentation.
Node.js
To use the Node.js samples on this page in a local development environment, install and initialize the gcloud CLI, and then set up Application Default Credentials with your user credentials.
Install the Google Cloud CLI.
If you're using an external identity provider (IdP), you must first sign in to the gcloud CLI with your federated identity.
If you're using a local shell, then create local authentication credentials for your user account:
gcloud auth application-default login
You don't need to do this if you're using Cloud Shell.
If an authentication error is returned, and you are using an external identity provider (IdP), confirm that you have signed in to the gcloud CLI with your federated identity.
For more information, see Set up ADC for a local development environment in the Google Cloud authentication documentation.
PHP
To use the PHP samples on this page in a local development environment, install and initialize the gcloud CLI, and then set up Application Default Credentials with your user credentials.
Install the Google Cloud CLI.
If you're using an external identity provider (IdP), you must first sign in to the gcloud CLI with your federated identity.
If you're using a local shell, then create local authentication credentials for your user account:
gcloud auth application-default login
You don't need to do this if you're using Cloud Shell.
If an authentication error is returned, and you are using an external identity provider (IdP), confirm that you have signed in to the gcloud CLI with your federated identity.
For more information, see Set up ADC for a local development environment in the Google Cloud authentication documentation.
Python
To use the Python samples on this page in a local development environment, install and initialize the gcloud CLI, and then set up Application Default Credentials with your user credentials.
Install the Google Cloud CLI.
If you're using an external identity provider (IdP), you must first sign in to the gcloud CLI with your federated identity.
If you're using a local shell, then create local authentication credentials for your user account:
gcloud auth application-default login
You don't need to do this if you're using Cloud Shell.
If an authentication error is returned, and you are using an external identity provider (IdP), confirm that you have signed in to the gcloud CLI with your federated identity.
For more information, see Set up ADC for a local development environment in the Google Cloud authentication documentation.
Ruby
To use the Ruby samples on this page in a local development environment, install and initialize the gcloud CLI, and then set up Application Default Credentials with your user credentials.
Install the Google Cloud CLI.
If you're using an external identity provider (IdP), you must first sign in to the gcloud CLI with your federated identity.
If you're using a local shell, then create local authentication credentials for your user account:
gcloud auth application-default login
You don't need to do this if you're using Cloud Shell.
If an authentication error is returned, and you are using an external identity provider (IdP), confirm that you have signed in to the gcloud CLI with your federated identity.
For more information, see Set up ADC for a local development environment in the Google Cloud authentication documentation.
REST
To use the REST API samples on this page in a local development environment, you use the credentials you provide to the gcloud CLI.
Install the Google Cloud CLI.
If you're using an external identity provider (IdP), you must first sign in to the gcloud CLI with your federated identity.
For more information, see Authenticate for using REST in the Google Cloud authentication documentation.
Create an uptime check
This section explains how to create and configure uptime checks.
To create an uptime check for an external load balancer that has at least one TCP or HTTP/s port configured, you can follow these instructions. An alternative is to go to the Service details page for the service and then click Create uptime check. When you start from the Service details page, the service-specific fields are prepopulated.
Console
To create an uptime check by using the Google Cloud console, do the following:
-
In the Google Cloud console, go to the
 Uptime checks page:
If you use the search bar to find this page, then select the result whose subheading is Monitoring.
- In the toolbar of the Google Cloud console, select your Google Cloud project. For App Hub configurations, select the App Hub host project or the app-enabled folder's management project.
Click Create Uptime Check.
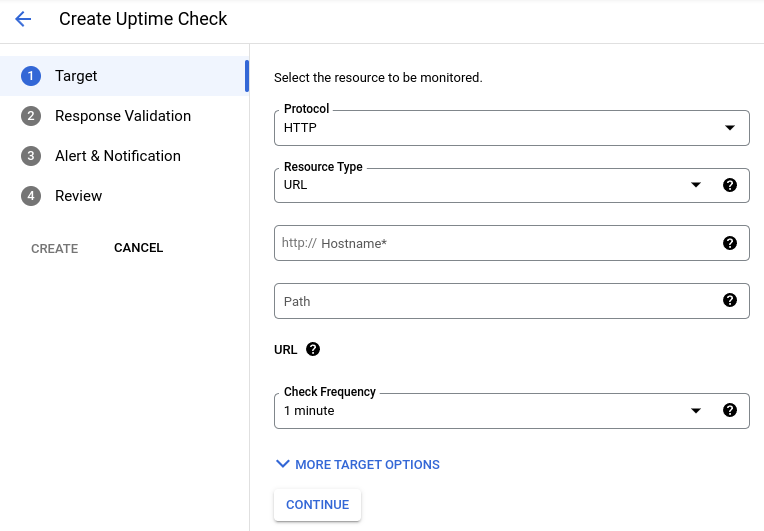
Specify the target of the uptime check:
Select the protocol. You can select HTTP, HTTPS, or TCP.
Choose one of the following resource types:
- URL: Any IPv4 address or hostname. Path and port are entered separately.
- Kubernetes LoadBalancer Service: Kubernetes Service of LoadBalancer type.
- Instance: Compute Engine or AWS EC2 instances.
- App Engine: App Engine applications (modules).
- Elastic Load Balancer: AWS load balancer.
Enter the protocol-specific fields:
For TCP checks, enter the port.
For HTTP and HTTPS checks, you can enter a path within your host or resource. All uptime checks that use these protocols send a request to
http://target/path. In this expression, for a URL resource,targetis a hostname or IP address. For an App Engine resource,targetis a hostname derived from the service name. For instance and load balancer resources,targetis an IP address derived from the name you provided for the resource or the group of resources.If you leave the
pathfield blank or if you set the value to/, then the request is issued tohttp://target/.For example, to issue an uptime check to the URL resource
example.com/tester, set the Hostname field toexample.comand the Path field to/tester.Suppose you've deployed a server to App Engine with a dispatcher that supports
/and/hello. To issue the uptime check to the '/' handler, leave the Path field empty. To issue the uptime check to the/hellohandler, set the value of the Path field to/hello.
Enter the resource-specific fields:
For URL resources, enter the hostname in the Hostname field. For example, enter
example.com.For App Engine resources, enter the service name in the Service field.
For Elastic Load Balancer and Instance resources, complete the Applies to field as follows:
- To issue an uptime check to a single instance or load balancer, select Single and then use the menu to select the specific instance or load balancer.
- To issue an uptime check to a Monitoring group, select Group, and then use the menu to select the group name.
Optional: To set how often the uptime check executes, use the Check frequency field.
Optional: To select checker regions, or to configure SSL certificates, authentication, headers, and ports for HTTP and HTTPS checks, click More target options:
- Regions: Select the regions where the uptime checks are to receive requests. An uptime check must have at least three checkers. There's one checker in all regions except the United States, which has three checkers. The default setting, Global, includes all regions.
- ICMP Pings: Configure the uptime check to send up to three pings. For more information, see Use ICMP pings.
- Request Method: For HTTP checks, select the request method.
- Body: For HTTP POST checks, enter the URL encoded body; you must do the encoding yourself. For all other checks, leave this field empty.
- Host header: Fill this field in to check virtual hosts. This field isn't available for TCP checks.
- Port: Specify a port number.
- Custom Headers: Supply custom headers, and encrypt them if desired. Encryption hides the values of the header in the form. Use encryption for headers related to authentication that you don't want visible to others.
Authentication: These values are sent as an Authorization header. This field isn't available for TCP checks.
Choose from the following options:
- Basic Authentication: Provide a single username and password. Passwords are always hidden in the form.
- Service Agent Authentication: When enabled an identity token is generated for the monitoring service agent. This option is available only for HTTPS checks.
SSL Certificate Validation: If you selected HTTPS for a URL resource, then by default, the service attempts to connect over HTTPS and validate the SSL certificate. Uptime checks fail when a URL has an invalid certificate. Reasons for an invalid certificate include the following:
- An expired certificate
- A self-signed certificate
- A certificate with a domain-name mismatch
- A certificate that uses the Authority Information Access (AIA) extension.
To force an HTTPS uptime check to validate the SSL certificate, select Validate SSL certificates.
To disable SSL certificate validation, clear Validate SSL certificates.
If you have SSL Certificates with AIA Extensions, then you must disable SSL certificate validation. These types of certificates aren't supported and fail the validation sequence. Typically, the error message is "Responded with SSL handshake Error in 10000 ms".
You can use the metric
monitoring.googleapis.com/uptime_check/time_until_ssl_cert_expiresto create an alerting policy that notifies you before your certificate expires. For more information, see Sample policies: Uptime-check policy.Select Validate SSL certificates checkbox.
Click Continue and configure the response requirements. All settings in this section have default values:
To change the timeout period for the uptime check, use the Response Timeout field. An uptime check fails when no response is received from more than one location within this period.
To configure the uptime check to perform content matching, ensure that the toggle label is Content matching is enabled:
- Select the Response Content Match Type from the menu of options.
This field determines how the response content is compared to the
returned data. For example, assume that the response content is
abcdand the content match type is Contains. The uptime check is successful only when the response data containsabcd. For more information, see Validate response data. - Enter the Response content. The response content must be a string
no longer than 1024 bytes. In the API, this field is the
ContentMatcherobject.
- Select the Response Content Match Type from the menu of options.
This field determines how the response content is compared to the
returned data. For example, assume that the response content is
To prevent log entries from being created due to uptime checks, clear Log check failures.
For the HTTP uptime checks, configure the acceptable response codes. By default, HTTP uptime checks mark any
2xxresponse as a successful response.
Click Continue and configure notifications.
To be notified when an uptime check fails, create an alerting policy and configure notification channels for that policy:
- Optional: Update the name of the alerting policy.
- Optional: In the Duration field, select how long the uptime checks must fail before notifications are sent. By default, notifications are sent when at least two regions report uptime check failures for a duration of at least one minute.
In the box labeled Notification channels, click arrow_drop_down Menu, select the channels to add, and then click OK.
In the menu, the notification channels are grouped alphabetically for each channel type.
If you don't want to create an alerting policy, then ensure that the text of the toggle button is Do not create an alert.
Click Continue and complete your uptime check:
Enter a descriptive title for the uptime check.
Optional: To add user-defined labels to your uptime check, do the following:
- Click expand_more Show user labels.
- In the Key field, enter a name for the label.
Label names must start with a lowercase letter, and they can contain
lowercase letters, numerals, underscores, and dashes. For example,
enter
severity. - In the Value field, enter a value for your label. Label values
can contain
lowercase letters, numerals, underscores, and dashes. For example,
enter
critical. - For each additional label, click Add user label and then enter the key and value of the label.
To verify your uptime check configuration, click Test. If the result isn't what you expect, see Check failures, correct your configuration, and then repeat the verification step.
Click Create. If you select Create and a required field isn't populated, then an error message is displayed.
gcloud
To create the uptime check, run the
gcloud monitoring uptime create command:
gcloud monitoring uptime create DISPLAY_NAME REQUIRED_FLAGS OPTIONAL_FLAGS --project=PROJECT_ID
Before you run the previous command, replace the following:
PROJECT_ID: The identifier of the project. For App Hub configurations, select the App Hub host project or the app-enabled folder's management project.
DISPLAY_NAME: The name for your uptime check.
REQUIRED_FLAGS: Configure to specify the resource probed by the uptime check. For example, the following command creates an uptime check that tests the URL EXAMPLE.com for a particular project:
gcloud monitoring uptime create DISPLAY_NAME \
--resource-labels=host=EXAMPLE.com,project_id=PROJECT_ID \
--resource-type=uptime-url
The previous command specifies values for each label required by the resource type
uptime-url.OPTIONAL_FLAGS: Configure these flags to override default values. For example, you must set the
--protocolflag when the protocol isn'thttp.
Terraform
To learn how to apply or remove a Terraform configuration, see Basic Terraform commands. For more information, see the Terraform provider reference documentation.
To create an uptime check and an alerting policy to monitor that check, do the following:
- Install and configure Terraform for you project. For App Hub configurations, select the App Hub host project or the app-enabled folder's management project.
Edit your Terraform configuration file and add a
google_monitoring_uptime_check_configresource, and then apply the configuration file.The following example illustrates a configuration that checks a public URL:
resource "google_monitoring_uptime_check_config" "example" {
    display_name = "example"
    timeout      = "60s"

    http_check {
        port = "80"
        request_method = "GET"
    }

    monitored_resource {
        type = "uptime_url"
        labels = {
            project_id = "PROJECT_ID"
            host="EXAMPLE.com"
        }
    }

    checker_type = "STATIC_IP_CHECKERS"
}
In the previous expression:
- PROJECT_ID is the ID of your project. For App Hub configurations, select the App Hub host project or the app-enabled folder's management project.
- EXAMPLE.com is the Host URL.
Optional: Create a notification channel and an alerting policy:
The following steps use the Google Cloud console to create the notification channel and alerting policy. This approach ensures that the alerting policy only monitors the data generated by your uptime check.
To create a notification channel, do the following:
-
In the Google Cloud console, go to the notifications Alerting page:
If you use the search bar to find this page, then select the result whose subheading is Monitoring.
- In the toolbar of the Google Cloud console, select your Google Cloud project. For App Hub configurations, select the App Hub host project or the app-enabled folder's management project.
- Select Manage notification channels.
- Go to the type of channel that you want to add, click Add, and then complete the dialog.
-
To create an alerting policy, do the following:
-
In the Google Cloud console, go to the
Uptime checks page:
If you use the search bar to find this page, then select the result whose subheading is Monitoring.
- In the toolbar of the Google Cloud console, select your Google Cloud project. For App Hub configurations, select the App Hub host project or the app-enabled folder's management project.
- Locate your uptime check, select more_vert More, and then select Add alert policy.
- In the dialog, go to the Notifications and name section, expand Notification Channels, and make your selections.
- Name the alerting policy and then click Create policy.
-
You can create an alerting policy by adding a
google_monitoring_alert_policyresource to your configuration file and applying the new configuration.
C#
To authenticate to Monitoring, set up Application Default Credentials. For more information, see Set up authentication for a local development environment.
Java
To authenticate to Monitoring, set up Application Default Credentials. For more information, see Set up authentication for a local development environment.
Go
To authenticate to Monitoring, set up Application Default Credentials. For more information, see Set up authentication for a local development environment.
Node.js
To authenticate to Monitoring, set up Application Default Credentials. For more information, see Set up authentication for a local development environment.
PHP
To authenticate to Monitoring, set up Application Default Credentials. For more information, see Set up authentication for a local development environment.
Python
To authenticate to Monitoring, set up Application Default Credentials. For more information, see Set up authentication for a local development environment.
Ruby
To authenticate to Monitoring, set up Application Default Credentials. For more information, see Set up authentication for a local development environment.
REST
To create an uptime check, call the
projects.uptimeCheckConfigs.create
method. Set the method's parameters as follows:
parent: Required. The project in which to create the uptime check. For App Hub configurations, select the App Hub host project or the app-enabled folder's management project. This field has the following format:
projects/PROJECT_IDThe request body must contain an
UptimeCheckConfigobject for the new uptime check. This page provides information about a few fields. For complete documentation on this object and its fields, seeUptimeCheckConfig:Leave the
namefield of the configuration object blank. The system sets this field when it constructs the response configuration object.If you are configuring an HTTP or HTTPS check, then you must populate the
HttpCheckfield of theUptimeCheckConfigobject. In this object, set therequestMethodfield asGETorPOST. If this field is omitted or set toMETHOD_UNSPECIFIED, then aGETrequest is issued.If you are configuring a
POSTrequest, then complete thecontentType, optionalcustomContentType, andbodyfields.
The create method returns the UptimeCheckConfig
object for the new configuration.
If the created uptime configuration doesn't work as expected, see the Check failures section on this page.
There can be a delay of up to 5 minutes before the uptime check results start to flow into Monitoring. During that time, the uptime check dashboard reports the status as "no data available."
Use ICMP pings
To help you troubleshoot failed public uptime checks, you can configure your uptime checks to send up to 3 ICMP pings during the check. The pings can help you distinguish between failures caused, for example, by network connectivity problems and by timeouts in your application.
By default, uptime checks don't send pings. Each ping adds some latency to the uptime check. Private uptime checks can't send pings.
When a public uptime check fails, the results of the pings are written to
Cloud Logging logs. If the ping fails,
then the following fields are added to the httpRequest field
in the log entry:
rtt_usec: round-trip time for each unsuccessful ping request.unreachable_count: number of ping requests that returned the status codeICMP_DEST_UNREACH.no_answer_count: number of ping requests that timed out and returned no response.
The results of pings for successful uptime checks aren't logged.
Configure pings
Each uptime-check configuration includes either
an HttpCheck object
or a TcpCheck object.
Both of these objects include a pingConfig field.
Use this field to specify the number of ICMP pings to include with each check,
up to 3. By default, no pings are sent.
To configure pings, do one of the following:
When using the Google Cloud console, expand More target options and enter a value in the ICMP Pings field.
When using the Cloud Monitoring API, use the
PingConfigobject, which has the following structure:{ "pingsCount": integer }For more information about using the Monitoring API for uptime-check configurations, see Create an uptime check: API or Edit an uptime check: API.
Verify your uptime check
When you create an uptime check in the Google Cloud console, you can test the configuration before saving.
Successful checks
An uptime check is successful when the following conditions are true:
- The HTTP status matches the criteria you selected.
- The response has no required content or, a search of the response for the required content is successful.
Failed checks
The following are some possible causes of an uptime check failure:
- Connection Error - Refused: If you are using the default HTTP connection type, check that you have a web server installed that is responding to HTTP requests. A connection error can happen on a new instance if you haven't installed a web server; see the Quickstart for Compute Engine. If you use an HTTPS connection type, you might have to perform additional configuration steps. For firewall issues, see List uptime-check server IP addresses.
- Name or service not found: The host name might be incorrect.
- 403 Forbidden: The service is returning an error code to the uptime checker. For example, the default Apache web server configuration returns this code under Amazon Linux, but it returns code 200 (Success) under some other Linux versions. See the LAMP tutorial for Amazon Linux or your web server's documentation.
- 404 Not found: The path might be incorrect.
408 Request timeout, or no response: The port number might be incorrect, the service might not be running, the service might be inaccessible, or the timeout might be too low. Check that your firewall allows traffic from the uptime servers; see List uptime-check server IP addresses. The timeout limit is specified as part of the Response Validation options.
A request timeout might occur due to network congestion. For example, due to temporary network congestion, you might notice that one checker fails but all other checkers succeed. The failure of a single checker doesn't cause a notification when your alerting policy uses the default configuration.
If your uptime check is configured to send pings, then the results of pings for failed uptime checks are written to Cloud Logging. For more information, see Use ICMP pings.
What's next
- Manage uptime checks
- Create alerting policies for uptime checks
- List uptime-check server IP addresses
- Chart uptime-check metrics