This document describes how you configure a dashboard to show event annotations. An event is an activity, such as a deployment or a crash, that affects the operation of a system. Showing event annotations can help you correlate data from different sources when you're troubleshooting an issue.
This feature is supported only for Google Cloud projects. For App Hub configurations, select the App Hub host project or the app-enabled folder's management project.
About event annotations
You can show events on most dashboards listed in the Dashboards page of the Google Cloud console. Similarly, you can configure some service-specific Observability tabs, such as those for Compute Engine and Google Kubernetes Engine, to show events. To configure the event types that are shown by a dashboard or on an Observability tab, you can use the Google Cloud console. For dashboards that you create, which are classified as custom dashboards, you can also use the Cloud Monitoring API.
Unless you use the Cloud Monitoring API or take an action to save your event type selections, your selections apply only to your current session. When you use the Google Cloud console, pinning your selections saves them.
For a list of event types, troubleshooting references, and other information, see the Event types page.
Recommended event types
You might see the following event types enabled on a dashboard or an Observability tab, even though you haven't selected any event types:
- Alert opened.
- Personalized Service Health incident, when the Service Health API is enabled.
- For each type of resource with data shown on the dashboard, one event type.
When an event type is added automatically, it is a recommended event type. You can leave these event types in the recommended state, save them to the dashboard JSON, or dismiss them, which removes the recommendation. To determine which event types are saved, expand the Annotations menu and then view the Pinned section.
How events are identified
Dashboards query different sources of data to identify the events to show on your dashboard:
Alert events are identified by Monitoring. Alert events provide information about when incidents were opened.
Personalized Service Health events are identified by queries that Monitoring sends to the Service Health API. These events indicate when there is a disruption in a Google Cloud service.
All other event types are identified by analyzing the log entries that pass through the Cloud Logging sinks in your Google Cloud project. These log entries include those generated by your project and those routed to your project. To get notified when one of these events occurs, you can create a log-based alerting policy. In the alerting policy, use the queries provided on the Event types page.
How events are shown
For all events, as those events occur, the charts on your dashboard are annotated. Events identified by analyzing log entries are shown with a single time reference. In contrast, Service Health events are shown with a start time and then the background of the chart is changed for the duration of the event. These events also display a heart icon.
The following screenshot illustrates a chart that is showing several events that were identified by analyzing log entries, and one Service Health event:
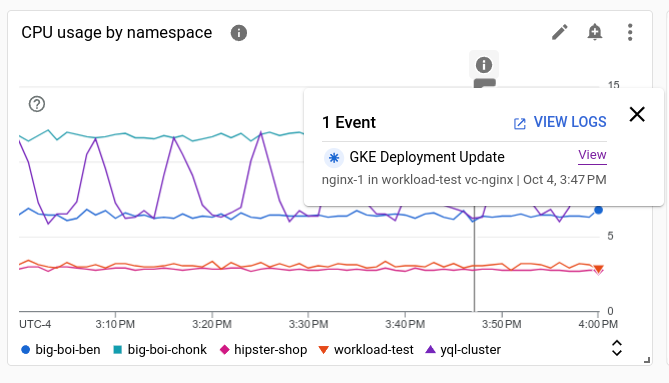
As shown in the previous screenshot, the tooltip for an event includes information like the following:
- Event name.
- Date and start time of the event.
- For Service Health events, chips that show the number of affected products and locations. To list the affected products or locations, place your pointer on the corresponding chip.
- A View button, which when selected opens a page that shows more information about the event. For example, it might open the Logs Explorer, so that you can view log entries, or it might open the details page for a Service Health event.
Dashboard filters, which limit the data shown by a dashboard, typically filter both time-series data and events.
Before you begin
Complete the following for the Google Cloud project where you want to view events on dashboards:
-
To get the permissions that you need to view and show events on dashboards, and to create alerting policies, ask your administrator to grant you the following IAM roles on your project:
-
View and create dashboards and alerting policies:
Monitoring Editor (
roles/monitoring.editor). -
View and show events identified from non-data access log entries that are created in your Google Cloud project:
Logs Viewer (
roles/logging.viewer). -
View and show events identified from any log entries that are created in your Google Cloud project:
Private Logs Viewer (
roles/logging.privateLogViewer). -
View Service Health events:
Personalized Service Health viewer (
roles/servicehealth.viewer)
For more information about granting roles, see Manage access to projects, folders, and organizations.
You might also be able to get the required permissions through custom roles or other predefined roles.
-
View and create dashboards and alerting policies:
Monitoring Editor (
If you want to show Service Health events on your dashboard, then enable the Service Health API:
Roles required to enable APIs
To enable APIs, you need the Service Usage Admin IAM role (
roles/serviceusage.serviceUsageAdmin), which contains theserviceusage.services.enablepermission. Learn how to grant roles.
Show events
This section describes how to configure a dashboard or an Observability tab to show events.
Configure dashboards to show events
This section describes how to configure dashboards that are listed in the Dashboards page of the Google Cloud console to show events.
For a list of event types, troubleshooting references, and queries that can be used with the Logs Explorer or with log-based alerting policies, see the Event types page.
Console
To show events on a dashboard, do the following:
-
In the Google Cloud console, go to the
 Dashboards page:
If you use the search bar to find this page, then select the result whose subheading is Monitoring.
- In the toolbar of the Google Cloud console, select your Google Cloud project. For App Hub configurations, select the App Hub host project or the app-enabled folder's management project.
- Select the dashboard you want to view.
- In the dashboard's toolbar,
click
 Annotations, and
select the event types that you want your dashboard to show.
Annotations, and
select the event types that you want your dashboard to show. Do one of the following:
To save your selections so that events are displayed when you reload the dashboard, click Pin Selected. If you have autosave disabled on your dashboard, then go to the dashboard's toolbar and click Save.
When you pin your selections, you modify the JSON definition of the dashboard. Therefore, when the dashboard is reopened, your selections are loaded and the dashboard shows annotations for the corresponding event types.
To show your event types only for your current session, click Apply.
After you update the list of event types to show, Cloud Monitoring issues queries, which takes a few moments, and then adds the annotations to the charts on the dashboard.
To view a summary of an event or to access links to additional information, use your pointer to activate the tooltip.
API
To configure a custom dashboard to show events,
include an annotations field in the Dashboard object.
The annotations field contains an instance of a DashboardAnnotations object,
which contains two fields:
The
defaultResourceNamefield lists the dashboard-level defaults for the Google Cloud projects to search for events. If you don't specify this field, then your selected project is searched.An array of
EventAnnotationobjects. Each object contains the following:- A
displayNamefield, which lets you define the label on the event-specific toggle. When this field isn't specified or when the value of this field is an empty string, the default name for the event is shown. - An
enabledfield, which controls the value of the event's toggle. Whentrue, the toggle is in theonposition and events are shown on the dashboard. Whenfalse, the toggle is in theoffposition. - An
eventTypefield, which contains a value from theEventTypeenumeration. - A
filterfield, which lets you specify a query to append to the event-specific query. When the value of this field is an empty string, then the event-specific query is used. - A
resourceNamesfield, which lets you define a list of Google Cloud projects to search for events. When this field is an empty array, your selected project is searched.
- A
The following shows an example annotations object for a cluster update
event. The filter field in this example restricts the events to a
specific cluster:
"annotations": {
  "defaultResourceNames": [],
  "eventAnnotations": [
    {
      "displayName": "",
      "enabled": true,
      "eventType": "GKE_CLUSTER_UPDATE",
      "filter": "resource.labels.cluster_name=my-cluster",
      "resourceNames": []
    }
  ]
}
For detailed information about how to use the Cloud Monitoring API to create dashboards, see Create and manage dashboards by API and Example: enable events on dashboards.
Configure the Observability tab to show events
This section describes how to configure the Observability tab to show events. Some services, such as Compute Engine and Google Kubernetes Engine, provide an Observability tab that displays metric and log data.
Console
To configure the Observability tab to show events, do the following:
Go to the Observability tab for a service or product.
For example, you might go to the Kubernetes Clusters page and then select the Observability tab. Similarly, you might go to the Kubernetes Workloads page or to the details page for a virtual machine (VM) instance, and then select the Observability tab.
Ensure that the Dashboard menu is set to Predefined. Events can't be shown on custom dashboards.
On the toolbar, click
Annotations,
and complete the dialog.After you update the list of events to show, queries are issued to retrieve the event data, and then the dashboard is updated.
When the
Annotations menu isn't
shown, the tab can't be configured to show events.
API
Not available.
View event details
When you are viewing a chart that is showing event annotations, you can use links provided in the tooltip to access additional information.
To access details about a specific event, click View.
The Google Cloud console page opened by the View button is determined by the event type. For example, for an uptime check event, this button opens the dashboard for the uptime check. For a different event type, the Logs Explorer might open.
Create alerting policies
When events are identified by analyzing the log entries that pass through the Cloud Logging sinks in your Google Cloud project, you can get notified when these events occur by configuring a log-based alert. Log-based alerting policies query your log entries as they are received. When the query returns a non-empty result, an incident is created and notifications are sent.
Console
To create a logs-based alert, do the following:
If you haven't configured a notification channel, then do the following:
-
In the Google Cloud console, go to the notifications Alerting page:
If you use the search bar to find this page, then select the result whose subheading is Monitoring.
- In the toolbar of the Google Cloud console, select your Google Cloud project. For App Hub configurations, select the App Hub host project or the app-enabled folder's management project.
- Click Edit notification channel.
- Go to the type of notification channel that you want to configure, click Add new, and then complete the dialog.
-
-
In the Google Cloud console, go to the Logs Explorer page:
If you use the search bar to find this page, then select the result whose subheading is Logging.
In the toolbar of the Google Cloud console, select your Google Cloud project.
In the toolbar, select Create Alert.
Enter a name for the alerting policy and then click Next.
In the Define log entries to alert on section, enter a query or update the query that was copied from the Query pane when you selected Create Alert.
For each event type, the Event types page lists a query that is suitable for use in a log-based alerting policy.
Complete the dialog and click Save.
API
To create a logs-based alerting policy by using the Cloud Monitoring API, do the following:
Identify the query that is to be included in the condition of the alerting policy. For each event type, the Event types page lists a query that is suitable for use in a log-based alerting policy.
Create the JSON file that contains the representation of the alerting policy. For more information about this step and an example, see Design the alerting policy.
Invoke the alertPolicies.create API method. For example, you might issue the
gcloud alpha monitoring policies createcommand.
Hide events
Console
To hide all events, in the dashboard toolbar,
click Annotations, select Clear, and then
select Apply.
To hide one type of event, click Annotations,
clear the selection for that event type, and then select Apply.
API
To hide one type of event on a custom dashboard, find the
EventAnnotation object for the event type,
and then set the enabled field to false.
For detailed information about how to use the Cloud Monitoring API, see Create and manage dashboards by API.
What's next
- Share a custom dashboard
- Explore charted data
- Access resource-specific dashboards
- Add temporary filters to custom dashboards
- Add permanent filters to custom dashboards