This document describes the event types that can be shown as annotations on charts. An event is an activity, such as a reboot or a crash, that affects the operation of a system. Showing events can help you correlate data from different sources when you're troubleshooting an issue.
For each event, links to references or troubleshooting documentation are provided along with information about how to query for the event. For example, when events are identified by analyzing your logs, a query suitable for use with the Logs Explorer or with a log-based alerting policy is provided.
To add annotations to your charts, you configure the dashboard or the tab that displays the chart. For example, you can configure most dashboards listed on the Dashboards page of the Google Cloud console to show events. Similarly, you can configure some service-specific Observability tabs, such as those for Compute Engine and Google Kubernetes Engine, to show events. For configuration information, see Show events on a dashboard.
The following screenshot illustrates a chart that is showing several events that were identified by analyzing log entries, and one Service Health event:
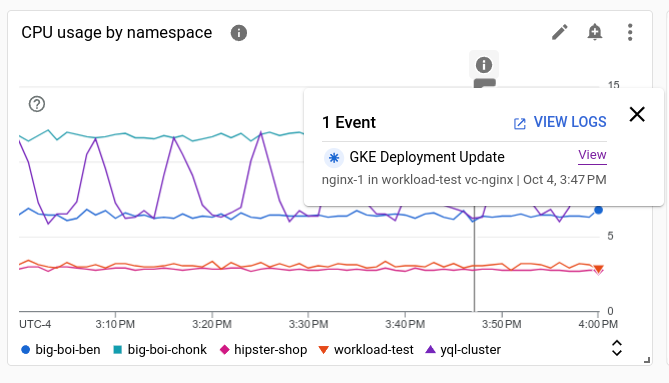
Each annotation can list multiple events. In the previous screenshot, an event for a GKE deployment is listed.
Alert event types
This section describes the alert event types that can be shown on a dashboard.
Alert opened
Alert opened events help you correlate your charted data to when incidents opened. An alert opened event is shown when the following are true:
- The corresponding incident was opened during the time range specified by the dashboard.
- The corresponding incident isn't closed.
There are no annotations made for incidents that were opened outside the time range specified by the dashboard aren't shown. Similarly, an alert opened event isn't shown when the corresponding incident was opened and then closed within the time range specified by the dashboard.
The tooltip for an alert opened event includes the following:
- Name of the alerting policy.
- Summary information, when this information is available. For example, this information might include the threshold and the measured value.
- The duration of the incident, and the date and time when the incident was opened.
- Metric and resource labels. The tooltip might not show all labels.
- A View button, which opens the Details page for the incident.
Google Kubernetes Engine event types
This section describes the Google Kubernetes Engine event types that can be shown on a dashboard.
Patched or updated GKE workload
This event type helps you troubleshoot GKE workload deployment or statefulset changes, as these events can correlate with performance regressions or other performance issues. This event type is shown when a workload is created, updated, or deleted.
If you want to create a log-based alerting policy for this event type, then use the following query:
log_id(cloudaudit.googleapis.com%2Factivity)
resource.type=k8s_cluster protoPayload.methodName=(
    io.k8s.apps.v1.deployments.create OR io.k8s.apps.v1.deployments.patch OR
    io.k8s.apps.v1.deployments.update OR io.k8s.apps.v1.deployments.delete OR
    io.k8s.apps.v1.statefulsets.create OR io.k8s.apps.v1.statefulsets.patch OR
    io.k8s.apps.v1.statefulsets.update OR io.k8s.apps.v1.statefulsets.delete OR
    io.k8s.apps.v1.daemonsets.create OR io.k8s.apps.v1.daemonsets.patch OR
    io.k8s.apps.v1.daemonsets.update OR io.k8s.apps.v1.daemonsets.delete
)
-protoPayload.authenticationInfo.principalEmail=("system:addon-manager" OR "system:serviceaccount:kube-system:namespace-controller")
-protoPayload.request.metadata.namespace=(kube-system OR gmp-system OR gmp-public OR gke-gmp-system OR istio-system)
-protoPayload.response.metadata.namespace=(kube-system OR gmp-system OR gmp-public OR gke-gmp-system OR istio-system)
-protoPayload.resourceName=~"namespaces/(kube-system|gmp-system|gmp-public|gke-gmp-system|istio-system)"
For additional information, see Overview of deploying workloads and View observability metrics.
Crash of a GKE pod
This event type helps you identify and troubleshoot GKE pod crashes. Pod crashes can be caused by memory exhaustion or an application error. This event type is shown when any of the following occur:
- Pod status is
CrashLoopBackoff - Pod terminates with a non-zero exit code.
- Pod terminates with an out-of-memory condition.
- Pod is evicted.
- Readiness/Liveliness probe fails.
If you want to create a log-based alerting policy for this event type, then use the following query:
(
    log_id(events)
    (
        (resource.type=k8s_pod jsonPayload.reason=(BackOff OR Unhealthy OR Killing OR Evicted)) OR
        (resource.type=k8s_node jsonPayload.reason=OOMKilling)
    )
    severity=WARNING
) OR (
    log_id(cloudaudit.googleapis.com%2Factivity) resource.type=k8s_cluster
    (protoPayload.methodName=io.k8s.core.v1.pods.eviction.create OR
        (protoPayload.methodName=io.k8s.core.v1.pods.delete
        protoPayload.response.status.containerStatuses.state.terminated.exitCode:*
        -protoPayload.response.status.containerStatuses.state.terminated.exitCode=0
        )
    )
)
For troubleshooting information, see Troubleshoot: CrashLoopBackOff.
Failure to schedule a GKE pod
This event type helps you identify and troubleshoot when pods that can't be scheduled on a node. This event type is shown when pod scheduling fails for any of the following reasons:
- Insufficient node CPU.
- Insufficient node memory.
- No nodes for taints or tolerations.
- Nodes at the maximum pod limit.
- Node pool at maximum size.
If you want to create a log-based alerting policy for this event type, then use the following query:
(
    log_id(events) resource.type=k8s_pod jsonPayload.reason=(NotTriggerScaleUp OR FailedScheduling)
) OR (
    log_id(container.googleapis.com/cluster-autoscaler-visibility)
    resource.type=k8s_cluster jsonPayload.noDecisionStatus.noScaleUp:*
)
For troubleshooting information, see Troubleshoot: Pod unschedulable.
Failure to create a GKE container
This event type helps you identify and troubleshoot failures to create a GKE container. Container creation might fail due to reasons such as failed volume mounts or failed image pulls.
If you want to create a log-based alerting policy for this event type, then use the following query:
log_id(events) resource.type=k8s_pod jsonPayload.reason=(Failed OR FailedMount) severity=WARNING
For troubleshooting information about image pulls, see Troubleshoot image pulls.
Pod autoscaler scale up and down
This event gives you visibility into Horizontal Pod Autoscaler rescales, which increase or decrease the number of running pods for a workload. For more information, see Horizontal Pod autoscaling.
If you want to create a log-based alerting policy for this event type, then use the following query:
resource.type=k8s_cluster log_id(events)
jsonPayload.involvedObject.kind=HorizontalPodAutoscaler jsonPayload.reason=SuccessfulRescale
Cluster autoscaler scale up and down
This event gives you visibility into when the cluster autoscaler scales up or down the number of nodes in a node pool of your cluster. For more information, see About cluster autoscaling and Viewing cluster autoscaler events.
If you want to create a log-based alerting policy for this event type, then use the following query:
(resource.type=k8s_cluster log_id(container.googleapis.com%2Fcluster-autoscaler-visibility)
jsonPayload.decision:*)
Cluster create and delete
This event tracks GKE cluster create and deletion actions. For more information, see Create an Autopilot cluster, Creating a zonal cluster, and Deleting a cluster.
If you want to create a log-based alerting policy for this event type, then use the following query:
resource.type=gke_cluster log_id(cloudaudit.googleapis.com%2Factivity)
protoPayload.methodName=(
    google.container.v1alpha1.ClusterManager.CreateCluster OR
    google.container.v1beta1.ClusterManager.CreateCluster OR
    google.container.v1.ClusterManager.CreateCluster OR
    google.container.v1alpha1.ClusterManager.DeleteCluster OR
    google.container.v1beta1.ClusterManager.DeleteCluster OR
    google.container.v1.ClusterManager.DeleteCluster
)
operation.first=true
Cluster update
This event tracks GKE cluster updates. Updates include automatic control plane version upgrades as well as manual upgrades and cluster configuration changes. For more information, see Manually upgrading a cluster or node pool and Standard cluster upgrades.
If you want to create a log-based alerting policy for this event type, then use the following query:
resource.type=gke_cluster log_id(cloudaudit.googleapis.com%2Factivity)
(
    protoPayload.methodName=(
        google.container.internal.ClusterManagerInternal.PatchCluster OR
        google.container.internal.ClusterManagerInternal.UpdateClusterInternal OR
        google.container.internal.ClusterManagerInternal.UpdateCluster
    )
) OR (
    protoPayload.methodName=(
        google.container.v1beta1.ClusterManager.UpdateCluster OR
        google.container.v1.ClusterManager.UpdateCluster
    )
    operation.first=true
)
protoPayload.metadata.operationType=(UPGRADE_MASTER OR REPAIR_CLUSTER OR UPDATE_CLUSTER)
Node pool update
This event tracks GKE node pool updates. Updates include automatic node pool version upgrades as well as manual upgrades, configuration changes, and resizes. For more information, see Manually upgrading a cluster or node pool and Standard cluster upgrades.
If you want to create a log-based alerting policy for this event type, then use the following query:
resource.type=gke_nodepool log_id(cloudaudit.googleapis.com%2Factivity)
(
    protoPayload.methodName=(
        google.container.internal.ClusterManagerInternal.UpdateClusterInternal OR
        google.container.internal.ClusterManagerInternal.RepairNodePool
    )
) OR (
    protoPayload.methodName=(
        google.container.v1beta1.ClusterManager.UpdateNodePool OR
        google.container.v1.ClusterManager.UpdateNodePool OR
        google.container.v1beta1.ClusterManager.SetNodePoolSize OR
        google.container.v1.ClusterManager.SetNodePoolSize OR
        google.container.v1beta1.ClusterManager.SetNodePoolManagement OR
        google.container.v1.ClusterManager.SetNodePoolManagement OR
        google.container.v1beta1.ClusterManager.SetNodePoolAutoscaling OR
        google.container.v1.ClusterManager.SetNodePoolAutoscaling
    )
    operation.first=true
)
Cloud Run event types
This section describes the Cloud Run event types that can be shown on a dashboard.
Cloud Run deployment
This event type helps you identify and troubleshoot Cloud Run deployment failures. Deployment might fail due to reasons such as deleted service account, incorrect permissions, the import of a container failed, or a container failed to start.
If you want to create a log-based alerting policy for this event type, then use the following query:
log_id(cloudaudit.googleapis.com%2Factivity) resource.type=cloud_run_revision
protoPayload.methodName=google.cloud.run.v1.Services.ReplaceService
For troubleshooting information, see Troubleshoot: Cloud Run issues.
Cloud SQL event types
This section describes the Cloud SQL event types that can be shown on a dashboard.
Cloud SQL failover
This event type helps you identify when manual or automatic failovers occur. A failover occurs when there is an instance or zone failure and the standby instance becomes the new primary instance. During a failover, Cloud SQL automatically switches to serving data from the standby instance.
If you want to create a log-based alerting policy for this event type, then use the following query:
resource.type=cloudsql_database
(
    (
        log_id(cloudaudit.googleapis.com%2Factivity)
        protoPayload.methodName=cloudsql.instances.failover
        operation.last=true
    ) OR (
        log_id(cloudaudit.googleapis.com%2Fsystem_event)
        protoPayload.methodName=cloudsql.instances.autoFailover
    )
)
For additional information, see About high availability.
Cloud SQL start or stop
This event type helps you identify a Cloud SQL instance has been manually started, stopped, or restarted. When an instance is stopped, all connections, open files, and running operations are also stopped.
If you want to create a log-based alerting policy for this event type, then use the following query:
log_id(cloudaudit.googleapis.com%2Factivity) resource.type=cloudsql_database
protoPayload.methodName=cloudsql.instances.update operation.last=true
protoPayload.metadata.intents.intent=(START_INSTANCE OR STOP_INSTANCE)
For additional information, see About high availability and Start, stop, and restart instances.
Cloud SQL storage
This event type helps you identify events related to Cloud SQL storage, including when database storage is full, and when a database is shut down due to reaching storage capacity. Databases at storage capacity and without automatic storage enabled might be shut down to prevent data corruption.
If you want to create a log-based alerting policy for this event type, then use the following query:
resource.type=cloudsql_database
(
    (
        (log_id(cloudsql.googleapis.com%2Fpostgres.log) OR log_id(cloudsql.googleapis.com%2Fmysql.err))
        textPayload=~"No space left on device"
        severity=(ERROR OR EMERGENCY)
    ) OR (
        log_id(cloudaudit.googleapis.com%2Fsystem_event)
        protoPayload.methodName=cloudsql.instances.databaseShutdownOutOfStorage
    )
)
Compute Engine event types
This section describes the Compute Engine event types that can be shown on a dashboard.
Virtual machine terminations
This event type helps you identify virtual machine (VM) terminations, including manually triggered resets and stops, guest OS terminations, maintenance terminations, and host errors.
If you want to create a log-based alerting policy for this event type, then use the following query:
resource.type=gce_instance
(
    (
        log_id(cloudaudit.googleapis.com%2Factivity)
        protoPayload.methodName=(
            beta.compute.instances.reset OR v1.compute.instances.reset OR
            beta.compute.instances.stop OR v1.compute.instances.stop
        )
        operation.first=true
    ) OR (
        log_id(cloudaudit.googleapis.com%2Fsystem_event)
        protoPayload.methodName=(
            compute.instances.hostError OR
            compute.instances.guestTerminate OR
            compute.instances.terminateOnHostMaintenance
        )
    )
)
For additional information, see Stop and start a VM and Troubleshooting VM shutdowns and reboots.
VM instance start failure
This event tracks Compute Engine VM instance start failures. The event shows start failures due to stockouts, IP space exhaustion, quota exceeded, or shielded-VM integrity errors.
If you want to create a log-based alerting policy for this event type, then use the following query:
resource.type=gce_instance
(
    (
        log_id(cloudaudit.googleapis.com%2Factivity)
        protoPayload.methodName=(beta.compute.instances.insert OR v1.compute.instances.insert)
        protoPayload.status.message=(ZONE_RESOURCE_POOL_EXHAUSTED OR IP_SPACE_EXHAUSTED OR QUOTA_EXCEEDED)
    ) OR (
        log_id(compute.googleapis.com%2Fshielded_vm_integrity)
        severity="ERROR"
    )
)
VM instance guest OS error
This event tracks specific Compute Engine VM instance Guest OS errors as recorded by the serial console logs. The errors tracked are disk full, file system mount failed and boot failures that activate Linux emergency mode.
For these events to be visible, you must enable serial port output logging to
Cloud Logging by setting serial-port-logging-enable=true in the VM or in
the project metadata. For more information, see
Enabling and disabling serial port output logging.
If you want to create a log-based alerting policy for this event type, then use the following query:
resource.type=gce_instance
log_id(serialconsole.googleapis.com%2Fserial_port_1_output)
textPayload=~("No space left on device" OR "Failed to mount" OR "You are in emergency mode")
Managed instance group update
This event type helps you identify when your Managed Instance Group (MIG) has been updated. For example, VMs have been added or removed, or the size limit has been updated. For more information, see Automatically apply VM configuration updates in a MIG.
If you want to create a log-based alerting policy for this event type, then use the following query:
resource.type=gce_instance_group_manager
log_id(cloudaudit.googleapis.com%2Factivity) operation.first=true
protoPayload.methodName=(beta.compute.instanceGroupManagers.patch OR v1.compute.instanceGroupManagers.patch)
For additional information, see Work with managed instances and Troubleshooting managed instance groups.
Managed instance group autoscaler
This event tracks scaling decisions made by the autoscaler of a MIG. These decisions could include changes in the recommended size for a MIG, or a change in the status of the autoscaler itself. For more information, see Autoscaling groups of instances.
If you want to create a log-based alerting policy for this event type, then use the following query:
resource.type=autoscaler log_id(cloudaudit.googleapis.com%2Fsystem_event)
protoPayload.methodName=(compute.autoscalers.resize OR compute.autoscalers.changeStatus)
Personalized Service Health event types
This section describes the Personalized Service Health types that can be displayed on a dashboard.
Google Cloud incident
When you are troubleshooting, you might want to differentiate between failures caused by a service that you own and one caused by a Google Cloud service that you use. When you enable Personalized Service Health annotations on a dashboard, you can view disruptions, or service health events, for Google Cloud services. For a list of services that are integrated with Service Health, see Supported Google products.
Unlike other event types, Google Cloud incidents aren't identified by analyzing your log entries. If you want to get notified when these events occurs, then create an alerting policy. You can select a preconfigured alerting policy by using options on the Service Health Dashboard page. For more information, see Quickstart: Set up an alert.
Monitoring identifies Google Cloud incidents by issuing a request to the Service Health API, and then filtering the response to those incidents that are relevant to the data you are viewing. The request has the following configuration:
The
Relevanceenumeration is set toRELATED,IMPACTED, orPARTIALLY_RELATED. This restriction ensures that your dashboard only displays events for the Google Cloud services that your Google Cloud project is using.The
DetailedStateenumeration isn't set toFALSE_POSITIVE.
Service Health annotations are displayed with a start time and a duration. The duration is displayed by changing the background color of the chart. The tooltip for a Google Cloud incident identifies the following:
- The Google Cloud service.
- Whether the incident is open or resolved.
- Date and start time of the event.
- Chips that display the number of affected products and locations. To list the affected products or locations, place your pointer on the corresponding chip.
- A View button, which when selected opens the details page for the incident.
For information about how to issue a request to the Service Health API, see Check for disruptions with Service Health.
For troubleshooting information, see Troubleshoot common issues in Service Health.
Uptime check event types
This section describes the uptime check event types that can be shown on a dashboard.
Uptime check failure
This event type helps you identify uptime check failures from configured regions.
If you want to create a log-based alerting policy for this event type, then use the following query:
log_id(monitoring.googleapis.com%2Fuptime_checks)
(
  resource.type=uptime_url OR resource.type=gce_instance OR
  resource.type=gae_app OR resource.type=k8s_service OR
  resource.type=servicedirectory_service OR resource.type=cloud_run_revision OR
  resource.type=aws_ec2_instance OR resource.type=aws_elb_load_balancer
)
labels.uptime_result_type=UptimeCheckResult
severity=NOTICE
For troubleshooting information, see Troubleshoot synthetic monitors and uptime checks.
Agent for SAP event types
This section describes the Agent for SAP event types that can be shown on a dashboard.
SAP Availability
This event type helps you identify events related to Agent for SAP availability. These events are triggered when SAP HANA, SAP NetWeaver, or Pacemaker Cluster availability changes.
If you want to create a log-based alerting policy for this event type, then use the following query:
log_id(google-cloud-sap-agent)
(
  resource.type=generic_node OR resource.type=gce_instance OR
  resource.type=aws_ec2_instance OR resource.type=baremetalsolution.googleapis.com/Instance
)
jsonPayload.metricEvent=true
jsonPayload.metric=(workload.googleapis.com/sap/hana/service OR workload.googleapis.com/sap/hana/availability OR
  workload.googleapis.com/sap/nw/service OR workload.googleapis.com/sap/nw/availability OR
  workload.googleapis.com/sap/cluster/nodes OR workload.googleapis.com/sap/cluster/resources)
SAP Backint
This event type helps you identify events related to Agent for SAP Backint. Any Backint backup or recovery writes an event detailing success or failure along with the transfer statistics. Log backups and recoveries are only shown on failure, while data backups and recoveries are shown on both success and failure.
log_id(google-cloud-sap-agent-backint)
(
  resource.type=generic_node OR resource.type=gce_instance OR
  resource.type=aws_ec2_instance OR resource.type=baremetalsolution.googleapis.com/Instance
)
(jsonPayload.fileType=data OR (jsonPayload.fileType=log AND jsonPayload.success=false))
jsonPayload.message=SAP_BACKINT_FILE_TRANSFER
SAP Operations
This event type helps you identify events related to Agent for SAP operations. These events are triggered when SAP HANA replication status changes.
If you want to create a log-based alerting policy for this event type, then use the following query:
log_id(google-cloud-sap-agent)
(
  resource.type=generic_node OR resource.type=gce_instance OR
  resource.type=aws_ec2_instance OR resource.type=baremetalsolution.googleapis.com/Instance
)
jsonPayload.metricEvent=true
jsonPayload.metric=workload.googleapis.com/sap/hana/ha/replication
What's next
To learn how to show events on your dashboards, see Show events on a dashboard.