Nota:
En este documento, se describe la solución recomendada para recopilar métricas de AWS CloudWatch y enviarlas a Cloud Monitoring.
El uso de métricas de AWS CloudWatch en proyectos de Connector en Cloud Monitoring
dejó de estar disponible el 21 de agosto de 2023 y ya no es compatible.
El 21 de agosto de 2024 , se rechazaron los proyectos existentes del conector de AWS y se detuvo la transferencia de métricas.
Para obtener más información sobre este cambio, consulta Baja: métricas de AWS CloudWatch en proyectos de Connector .
El agente heredado de Monitoring y el agente de Logging heredado en Amazon Elastic Compute Cloud (Amazon EC2) aún son compatibles y no estarán obsoletos.
En este documento, se describe cómo usar el exportador de Prometheus CloudWatch de código abierto y el agente de operaciones que se ejecuta en una instancia de Compute Engine para recopilar métricas de AWS CloudWatch y almacenarlas en un proyecto de Google Cloud .
Este documento está dirigido a desarrolladores y administradores del sistema que necesiten recopilar métricas de AWS CloudWatch. En este documento, se describe cómo configurar el exportador de Prometheus CloudWatch para recopilar métricas de AWS CloudWatch.
Con Cloud Monitoring, puedes ver tus métricas de AWS en el mismo contexto que tus métricas de Google Cloud . Por ejemplo, puedes crear un panel con gráficos que muestren el uso de CPU de tus instancias de Amazon EC2 y de tus instancias de Compute Engine. También puedes crear políticas de alertas para supervisar tus métricas de AWS. Si deseas obtener más información, consulta las siguientes secciones:
Antes de comenzar
Para recopilar métricas de AWS CloudWatch con el exportador de Prometheus CloudWatch, necesitas lo siguiente:
Un proyecto Google Cloud con permisos para realizar las siguientes acciones:
Crea una VM
Escribe registros en Cloud Logging
Escribe métricas en Cloud Monitoring
Una cuenta de AWS con credenciales de AWS que el exportador de Prometheus puede usar para recuperar métricas
Para obtener más información, consulta Cómo ejecutar el exportador de Prometheus .
Crea una VM de Compute Engine
Recomendamos crear una VM de Compute Engine de Linux para usarla específicamente para ejecutar el agente de operaciones y el exportador de Prometheus de CloudWatch. Esta VM actúa como sitio de recopilación para todas las métricas de AWS.
Para crear una VM de Debian Linux llamada aws-exporter-test en una zona que especifiques, ejecuta el siguiente comando:
gcloud compute instances create \
  --image-project debian-cloud \
  --image-family debian-11 \
  --zone ZONE \
  aws-exporter-test
Configura el comando de la siguiente manera:
Reemplaza ZONE
Opcional. Reemplaza aws-exporter-test
Nota: Este comando crea una VM con el tipo de máquina predeterminado n1-standard-1. Este tipo de máquina ha sido suficiente para supervisar proyectos modestos en nuestras pruebas, pero si ingieres una gran cantidad de métricas con el exportador de Prometheus de CloudWatch, es posible que debas usar una máquina más grande. Te recomendamos que configures políticas de alertas sobre el uso de CPU y memoria de esta VM para determinar si necesitas una máquina más grande.
Para obtener información sobre las políticas de alertas, consulta Crea políticas de alertas de límite de métrica . Para obtener más información sobre este comando, consulta la referencia de gcloud compute instances create .
Para acceder a tu VM y poder instalar el exportador de Prometheus para CloudWatch y el agente de operaciones, puedes usar el siguiente comando:
gcloud compute ssh --zone ZONE --project PROJECT_ID aws-exporter-test
Configura el comando de la siguiente manera:
Reemplaza ZONE por la zona en la que creaste tu VM.
Reemplaza PROJECT_ID por el ID de tu Google Cloud proyecto
Reemplaza aws-exporter-test si creaste tu VM con un nombre diferente.
Para obtener más información sobre este comando, consulta la referencia de gcloud compute ssh .
Configura el exportador de Prometheus para CloudWatch
En las siguientes secciones, se describe el procedimiento para descargar, instalar y configurar el exportador de Prometheus CloudWatch en tu VM de Compute Engine.
Descarga el exportador de Prometheus y el JRE
Para ejecutar el exportador de Prometheus CloudWatch, debes descargar el exportador y el entorno de ejecución de Java (JRE), versión 11 o posterior.
Para descargar el archivo JAR que contiene el exportador de Prometheus CloudWatch, ejecuta el siguiente comando en tu instancia de Compute Engine:
curl -sSO https://github.com/prometheus/cloudwatch_exporter/releases/download/v0.15.1/cloudwatch_exporter-0.15.1-jar-with-dependencies.jar
Para instalar el JRE, puedes usar un comando como el siguiente:
sudo apt install default-jre
Configura el exportador de Prometheus
Para configurar el exportador de Prometheus para CloudWatch, crea un archivo de configuración para el servicio o los servicios de AWS de los que deseas recopilar métricas.
Para obtener información general, consulta la documentación de configuración del exportador de Prometheus para CloudWatch.
Usuarios que migran : Si migras tus métricas existentes de AWS CloudWatch al exportador de Prometheus CloudWatch, puedes usar los archivos de configuración en Configuraciones del exportador de Prometheus CloudWatch para la migración .
Estos archivos de configuración están diseñados para replicar las métricas existentes de la manera más precisa posible, pero no recopilan todas las métricas disponibles con el exportador de Prometheus CloudWatch para los servicios de AWS.
Usuarios nuevos : Si no migrarás métricas existentes, te recomendamos que no uses las configuraciones de migración. Consulta la documentación del servicio de AWS CloudWatch para obtener información sobre cómo definir configuraciones de exportadores para otros servicios. También puedes encontrar muestras adicionales en el repositorio de GitHub del exportador de Prometheus CloudWatch.
Puedes combinar la configuración de varios servicios de AWS en un solo archivo de configuración. En los ejemplos de este documento, se supone que tu archivo de configuración se llama config.yml
Nota: El exportador de Prometheus CloudWatch recupera métricas de forma predeterminada con un retraso de 10 minutos. Puedes cambiar este valor en la configuración del exportador. Consulta Marcas de tiempo . AWS CloudWatch informa métricas coherentes de forma eventual, y esta demora reduce la probabilidad de registrar puntos de métricas que podrían cambiar. Prometheus no admite el registro duplicado de puntos, por lo que, si cambias este valor y la información nueva intenta cambiar puntos anteriores, se rechazarán esos cambios. Ejecuta el exportador de Prometheus
Antes de ejecutar el exportador de Prometheus CloudWatch, debes proporcionarle credenciales y autorización.
El exportador de Prometheus para CloudWatch usa el SDK de Java de AWS , que ofrece formas de proporcionar credenciales con las siguientes variables de entorno:
Para obtener más información sobre cómo proporcionar credenciales al SDK, consulta AWS SDK for Java 2.x .
También debes tener permiso para usar la API de CloudWatch para recuperar métricas. Necesitas los siguientes permisos de CloudWatch de IAM de AWS:
cloudwatch:ListMetricscloudwatch:GetMetricStatisticscloudwatch:GetMetricData
Para usar la función aws_tag_select, también se requiere el permiso de IAM de AWS tag:GetResources.
Para obtener más información sobre la autorización del acceso a los servicios de AWS, consulta AWS Identity and Access Management .
Para ejecutar el exportador de Prometheus CloudWatch, haz lo siguiente:
Para proporcionar credenciales al exportador, configura las variables de entorno de la clave de acceso:
export AWS_ACCESS_KEY=YOUR_ACCESS_KEY
export AWS_SECRET_ACCESS_KEY=YOUR_SECRET_ACCESS_KEY
export AWS_SESSION_TOKEN=YOUR_SESSION_TOKEN
Reemplaza las variables YOUR_KEY por tus claves de acceso.
Solo debes configurar la variable de entorno AWS_SESSION_TOKEN si usas credenciales temporales .
Para probar la configuración, inicia el exportador y carga el archivo de configuración. Para ello, ejecuta el siguiente comando:
java -jar cloudwatch_exporter-0.15.1-jar-with-dependencies.jar 9106 config.yml Cambia los valores del puerto (9106 config.yml
Si modificas el archivo config.yml
curl -X POST localhost:9106 Para usarlo en un entorno de producción, puedes configurar el exportador para que se reinicie si se reinicia la VM. Por ejemplo, en los sistemas Debian, puedes usar el administrador de sistemas y servicios, systemd .
Configura el agente de operaciones
En las siguientes secciones, se describe cómo instalar, configurar y, luego, iniciar el agente de operaciones. En estas secciones, se proporciona información de configuración mínima para el agente de operaciones para usar con el exportador de Prometheus CloudWatch.
Para obtener más información sobre estos temas, consulta la Descripción general del agente de operaciones .
Instalar el agente de operaciones.
Para instalar el Agente de operaciones, usa los siguientes comandos para descargar y ejecutar la secuencia de comandos de instalación del agente:
curl -sSO https://dl.google.com/cloudagents/add-google-cloud-ops-agent-repo.sh
sudo bash add-google-cloud-ops-agent-repo.sh --also-install
Configurar el agente de operaciones
Para configurar el agente de operaciones, agrega elementos de configuración al archivo de configuración del usuario del agente. En Linux, el archivo de configuración del usuario es /etc/google-cloud-ops-agent/config.yaml.
Cuando configuras el Agente de operaciones para recopilar métricas de AWS del exportador de Prometheus CloudWatch, usas el receptor de Prometheus del agente. En este documento, se describen dos configuraciones básicas para el agente de operaciones.
Selecciona una de las configuraciones y agrégala al archivo de configuración del usuario:
sudo vim /etc/google-cloud-ops-agent/config.yaml
Configuración básica del agente de operaciones
La siguiente configuración proporciona una configuración mínima para el agente de operaciones. Esta configuración hace lo siguiente:
Crea un receptor llamado aws del tipo prometheus. El receptor está configurado para recopilar métricas del trabajo aws_exporter. El puerto especificado debe coincidir con el puerto en el que el exportador de Prometheus CloudWatch exporta las métricas. Consulta Ejecuta el exportador de Prometheus .
Crea una canalización llamada aws_pipeline que usa el receptor de métricas aws.
metrics:
receivers:
aws:
type: prometheus
config:
scrape_configs:
- job_name: 'aws_exporter'
scrape_interval: 10s
static_configs:
- targets: ['localhost:9106 Configuración que descarta las métricas de JVM
La siguiente configuración hace todo lo que hace la configuración básica, pero también agrega una configuración de nuevo etiquetado que descarta las métricas de JVM generadas por el exportador. Descartar estas métricas reduce los datos de métricas transferidos, pero puede dificultar la depuración de los problemas del exportador, ya que no obtienes las métricas propias del exportador:
metrics:
receivers:
aws:
type: prometheus
config:
scrape_configs:
- job_name: 'aws_exporter'
scrape_interval: 10s
static_configs:
- targets: ['localhost:9106 Puedes crear configuraciones mucho más complejas para el agente de operaciones.
Reinicia el Agente de operaciones
Para aplicar los cambios de configuración al agente de operaciones, debes reiniciarlo.
Para reiniciar el agente, ejecuta el siguiente comando en tu instancia:
sudo service google-cloud-ops-agent restart
Para confirmar que el agente se reinició, ejecuta el siguiente comando y verifica que los componentes “Agente de métricas” y “Agente de Logging” se iniciaron:
sudo systemctl status google-cloud-ops-agent"*"
Visualiza métricas en Cloud Monitoring
En Cloud Monitoring, puedes consultar tus métricas de AWS CloudWatch y crear gráficos como lo haces con cualquier otra métrica. Desde la interfaz del Explorador de métricas, puedes usar PromQL, el lenguaje de consulta de Monitoring (MQL) o una interfaz de compilador de consultas. Para obtener más información, consulta Crea gráficos con el Explorador de métricas .
Si creaste gráficos que deseas conservar, puedes guardarlos en paneles personalizados. Para obtener más información, consulta Descripción general de los paneles .
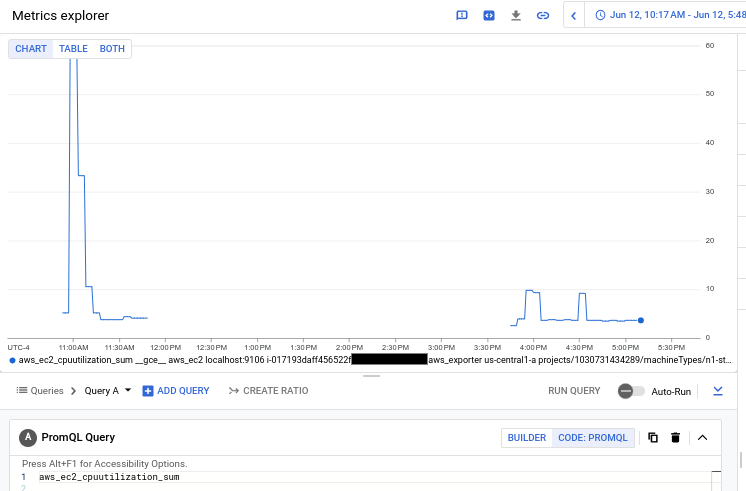
En el siguiente gráfico, se muestra una consulta de PromQL para la métrica aws_ec2_cpuutilization_sum de las VMs de AWS:
Puedes consultar cualquier métrica en Cloud Monitoring con PromQL. Para obtener más información, consulta Asigna métricas de Cloud Monitoring a PromQL .
Puedes consultar las métricas de Prometheus con PromQL o con herramientas de Cloud Monitoring, como el lenguaje de consulta de Monitoring (MQL) . Cuando las métricas de Prometheus se transfieren a Cloud Monitoring, cada métrica se transforma con la transformación estándar de OpenTelemetry a Prometheus y se asigna al tipo de recurso supervisado prometheus_target
El nombre de la métrica tiene el prefijo prometheus.googleapis.com/.
Los caracteres que no sean alfanuméricos, como los puntos (.), en el nombre de la métrica se reemplazan por guiones bajos (_).
El nombre de la métrica se fija con una cadena que indica el tipo de métrica, como /gauge o /counter.
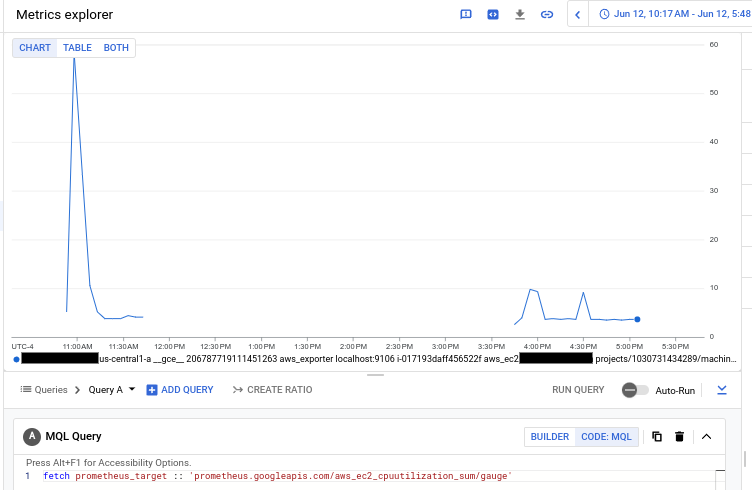
Para consultar la métrica aws_ec2_cpuutilization_sum de Prometheus con MQL, haz referencia a la métrica como prometheus.googleapis.com/aws_ec2_cpuutilization_sum/gauge y especifica el tipo de recurso supervisado prometheus_target:
fetch prometheus_target :: 'prometheus.googleapis.com/aws_ec2_cpuutilization_sum/gauge'
En el siguiente gráfico, se muestra el resultado de la consulta de MQL para la métrica aws_ec2_cpuutilization_sum de Prometheus:
Alerta sobre el comportamiento de las métricas
En Cloud Monitoring, puedes crear [políticas de alertas][alert-intro] para supervisar tus métricas de AWS CloudWatch y recibir notificaciones sobre picos, caídas o tendencias en los valores de las métricas.
Supervisa varias regiones
La configuración del exportador de Prometheus para CloudWatch admite el uso de solo una región por archivo de configuración. Si necesitas supervisar varias regiones, te recomendamos que ejecutes varias instancias del exportador de Prometheus, una configurada para cada región que desees supervisar. Puedes ejecutar varios exportadores en una sola VM o distribuirlos en varias VMs. Las imágenes de Docker del exportador de Prometheus pueden ser útiles en esta situación.
Puedes configurar el agente de operaciones que se ejecuta en la VM de Compute Engine para recopilar varios extremos de Prometheus. Te recomendamos que, cuando configures varias instancias del exportador de Prometheus, uses un nombre job diferente para la configuración de extracción de cada una, de modo que puedas distinguir las instancias del exportador si necesitas solucionar problemas.
Para obtener información sobre cómo configurar el agente de operaciones y el receptor de Prometheus, consulta Configura el agente de operaciones .
Costo
Amazon cobra por cada solicitud a la API de CloudWatch o por cada métrica de CloudWatch que solicites. Para conocer los precios actuales, consulta los precios de Amazon CloudWatch . El exportador de Prometheus para CloudWatch tiene las siguientes características de consulta , que pueden afectar tus costos de Amazon:
Cuando se usa el método GetMetricStatistics (predeterminado), cada métrica requiere una solicitud a la API. Cada solicitud puede incluir varias estadísticas.
Cuando se usa aws_dimensions, el exportador debe realizar solicitudes a la API para determinar qué métricas solicitar. La cantidad de solicitudes de dimensiones suele ser insignificante en comparación con la cantidad de solicitudes de métricas.
Cloud Monitoring cobra las métricas de AWS CloudWatch del exportador de Prometheus según la cantidad de muestras transferidas. Para conocer los precios actuales, consulta las secciones de Cloud Monitoring en la página Precios de Google Cloud Observability .
Configuraciones del exportador de Prometheus CloudWatch para la migración
En esta sección, se proporcionan configuraciones que replican, de la manera más cercana posible, las métricas de los servicios de AWS que se documentan en la lista de métricas de AWS . Estos archivos de configuración están diseñados para que los usen los clientes que migran a la solución heredada al exportador de Prometheus CloudWatch. Si configuras el exportador de Prometheus CloudWatch como usuario nuevo en lugar de como usuario que migra y usas estas configuraciones, no recopilas todas las métricas de AWS que el exportador de Prometheus CloudWatch pone a disposición.
Para ver un archivo de configuración de muestra para las métricas de AWS CloudWatch, expande una de las siguientes secciones.
applicationelb.yml
region: us-east-1
metrics:
- aws_namespace: AWS/ApplicationELB
  aws_metric_name: ActiveConnectionCount
  aws_dimensions: [AvailabilityZone, LoadBalancer]
- aws_namespace: AWS/ApplicationELB
  aws_metric_name: ClientTLSNegotiationErrorCount
  aws_dimensions: [AvailabilityZone, LoadBalancer]
- aws_namespace: AWS/ApplicationELB
  aws_metric_name: ConsumedLCUs
  aws_dimensions: [LoadBalancer]
- aws_namespace: AWS/ApplicationELB
  aws_metric_name: DesyncMitigationMode_NonCompliant_Request_Count
  aws_dimensions: [AvailabilityZone, LoadBalancer]
- aws_namespace: AWS/ApplicationELB
  aws_metric_name: DroppedInvalidHeaderRequestCount
  aws_dimensions: [AvailabilityZone, LoadBalancer]
- aws_namespace: AWS/ApplicationELB
  aws_metric_name: DroppedInvalidHeaderRequestCount
  aws_dimensions: [AvailabilityZone, LoadBalancer]
- aws_namespace: AWS/ApplicationELB
  aws_metric_name: ForwardedInvalidHeaderRequestCount
  aws_dimensions: [AvailabilityZone, LoadBalancer]
- aws_namespace: AWS/ApplicationELB
  aws_metric_name: GrpcRequestCount
  aws_dimensions: [AvailabilityZone, LoadBalancer]
- aws_namespace: AWS/ApplicationELB
  aws_metric_name: HTTP_Fixed_Response_Count
  aws_dimensions: [AvailabilityZone, LoadBalancer]
- aws_namespace: AWS/ApplicationELB
  aws_metric_name: HTTP_Redirect_Count
  aws_dimensions: [AvailabilityZone, LoadBalancer]
- aws_namespace: AWS/ApplicationELB
  aws_metric_name: HTTP_Redirect_Url_Limit_Exceeded_Count
  aws_dimensions: [AvailabilityZone, LoadBalancer]
- aws_namespace: AWS/ApplicationELB
  aws_metric_name: HTTPCode_ELB_3XX_Count
  aws_dimensions: [AvailabilityZone, LoadBalancer]
- aws_namespace: AWS/ApplicationELB
  aws_metric_name: HTTPCode_ELB_4XX_Count
  aws_dimensions: [AvailabilityZone, LoadBalancer]
- aws_namespace: AWS/ApplicationELB
  aws_metric_name: HTTPCode_ELB_5XX_Count
  aws_dimensions: [AvailabilityZone, LoadBalancer]
- aws_namespace: AWS/ApplicationELB
  aws_metric_name: HTTPCode_ELB_500_Count
  aws_dimensions: [AvailabilityZone, LoadBalancer]
- aws_namespace: AWS/ApplicationELB
  aws_metric_name: HTTPCode_ELB_502_Count
  aws_dimensions: [AvailabilityZone, LoadBalancer]
- aws_namespace: AWS/ApplicationELB
  aws_metric_name: HTTPCode_ELB_503_Count
  aws_dimensions: [AvailabilityZone, LoadBalancer]
- aws_namespace: AWS/ApplicationELB
  aws_metric_name: HTTPCode_ELB_504_Count
  aws_dimensions: [AvailabilityZone, LoadBalancer]
- aws_namespace: AWS/ApplicationELB
  aws_metric_name: IPv6ProcessedBytes
  aws_dimensions: [AvailabilityZone, LoadBalancer]
- aws_namespace: AWS/ApplicationELB
  aws_metric_name: IPv6RequestCount
  aws_dimensions: [AvailabilityZone, LoadBalancer]
- aws_namespace: AWS/ApplicationELB
  aws_metric_name: NewConnectionCount
  aws_dimensions: [AvailabilityZone, LoadBalancer]
- aws_namespace: AWS/ApplicationELB
  aws_metric_name: NonStickyRequestCount
  aws_dimensions: [AvailabilityZone, LoadBalancer]
- aws_namespace: AWS/ApplicationELB
  aws_metric_name: ProcessedBytes
  aws_dimensions: [AvailabilityZone, LoadBalancer]
- aws_namespace: AWS/ApplicationELB
  aws_metric_name: RejectedConnectionCount
  aws_dimensions: [AvailabilityZone, LoadBalancer]
- aws_namespace: AWS/ApplicationELB
  aws_metric_name: RequestCount
  aws_dimensions: [AvailabilityZone, TargetGroup, LoadBalancer]
- aws_namespace: AWS/ApplicationELB
  aws_metric_name: RuleEvaluations
  aws_dimensions: [LoadBalancer]
- aws_namespace: AWS/ApplicationELB
  aws_metric_name: HealthyHostCount
  aws_dimensions: [AvailabilityZone, TargetGroup, LoadBalancer]
- aws_namespace: AWS/ApplicationELB
  aws_metric_name: HTTPCode_Target_2XX_Count
  aws_dimensions: [AvailabilityZone, TargetGroup, LoadBalancer]
- aws_namespace: AWS/ApplicationELB
  aws_metric_name: HTTPCode_Target_3XX_Count
  aws_dimensions: [AvailabilityZone, TargetGroup, LoadBalancer]
- aws_namespace: AWS/ApplicationELB
  aws_metric_name: HTTPCode_Target_4XX_Count
  aws_dimensions: [AvailabilityZone, TargetGroup, LoadBalancer]
- aws_namespace: AWS/ApplicationELB
  aws_metric_name: HTTPCode_Target_5XX_Count
  aws_dimensions: [AvailabilityZone, TargetGroup, LoadBalancer]
- aws_namespace: AWS/ApplicationELB
  aws_metric_name: RequestCountPerTarget
  aws_dimensions: [AvailabilityZone, TargetGroup, LoadBalancer]
- aws_namespace: AWS/ApplicationELB
  aws_metric_name: TargetConnectionErrorCount
  aws_dimensions: [AvailabilityZone, TargetGroup, LoadBalancer]
- aws_namespace: AWS/ApplicationELB
  aws_metric_name: TargetResponseTime
  aws_dimensions: [AvailabilityZone, TargetGroup, LoadBalancer]
- aws_namespace: AWS/ApplicationELB
  aws_metric_name: TargetTLSNegotiationErrorCount
  aws_dimensions: [AvailabilityZone, TargetGroup, LoadBalancer]
- aws_namespace: AWS/ApplicationELB
  aws_metric_name: UnHealthyHostCount
  aws_dimensions: [AvailabilityZone, TargetGroup, LoadBalancer]
- aws_namespace: AWS/ApplicationELB
  aws_metric_name: HealthyStateDNS
  aws_dimensions: [AvailabilityZone, TargetGroup, LoadBalancer]
- aws_namespace: AWS/ApplicationELB
  aws_metric_name: HealthyStateRouting
  aws_dimensions: [AvailabilityZone, TargetGroup, LoadBalancer]
- aws_namespace: AWS/ApplicationELB
  aws_metric_name: UnhealthyRoutingRequestCount
  aws_dimensions: [AvailabilityZone, TargetGroup, LoadBalancer]
- aws_namespace: AWS/ApplicationELB
  aws_metric_name: UnhealthyStateDNS
  aws_dimensions: [AvailabilityZone, TargetGroup, LoadBalancer]
- aws_namespace: AWS/ApplicationELB
  aws_metric_name: UnhealthyStateRouting
  aws_dimensions: [AvailabilityZone, TargetGroup, LoadBalancer]
- aws_namespace: AWS/ApplicationELB
  aws_metric_name: LambdaInternalError
  aws_dimensions: [TargetGroup, LoadBalancer]
- aws_namespace: AWS/ApplicationELB
  aws_metric_name: LambdaTargetProcessedBytes
  aws_dimensions: [LoadBalancer]
- aws_namespace: AWS/ApplicationELB
  aws_metric_name: LambdaUserError
  aws_dimensions: [TargetGroup, LoadBalancer]
- aws_namespace: AWS/ApplicationELB
  aws_metric_name: ELBAuthError
  aws_dimensions: [AvailabilityZone, LoadBalancer]
- aws_namespace: AWS/ApplicationELB
  aws_metric_name: ELBAuthFailure
  aws_dimensions: [AvailabilityZone, LoadBalancer]
- aws_namespace: AWS/ApplicationELB
  aws_metric_name: ELBAuthLatency
  aws_dimensions: [AvailabilityZone, LoadBalancer]
- aws_namespace: AWS/ApplicationELB
  aws_metric_name: ELBAuthRefreshTokenSuccess
  aws_dimensions: [AvailabilityZone, LoadBalancer]
- aws_namespace: AWS/ApplicationELB
  aws_metric_name: ELBAuthSuccess
  aws_dimensions: [AvailabilityZone, LoadBalancer]
- aws_namespace: AWS/ApplicationELB
  aws_metric_name: ELBAuthUserClaimsSizeExceeded
  aws_dimensions: [AvailabilityZone, LoadBalancer]
cloudfront.yml
region: us-east-1
metrics:
- aws_dimensions:
  - DistributionId
  - Region
  aws_metric_name: Requests
  aws_namespace: AWS/CloudFront
- aws_dimensions:
  - DistributionId
  - Region
  aws_metric_name: BytesDownloaded
  aws_namespace: AWS/CloudFront
- aws_dimensions:
  - DistributionId
  - Region
  aws_metric_name: BytesUploaded
  aws_namespace: AWS/CloudFront
- aws_dimensions:
  - DistributionId
  - Region
  aws_metric_name: 4xxErrorRate
  aws_namespace: AWS/CloudFront
- aws_dimensions:
  - DistributionId
  - Region
  aws_metric_name: 5xxErrorRate
  aws_namespace: AWS/CloudFront
- aws_dimensions:
  - DistributionId
  - Region
  aws_metric_name: TotalErrorRate
  aws_namespace: AWS/CloudFront
dynamodb.yml
region: us-east-1
metrics:
- aws_dimensions:
  - TableName
  - GlobalSecondaryIndexName
  aws_metric_name: ConsumedReadCapacityUnits
  aws_namespace: AWS/DynamoDB
  aws_statistics:
  - Maximum
- aws_dimensions:
  - TableName
  - GlobalSecondaryIndexName
  aws_metric_name: ConsumedWriteCapacityUnits
  aws_namespace: AWS/DynamoDB
  aws_statistics:
  - Maximum
- aws_dimensions:
  - TableName
  - Operation
  aws_metric_name: ThrottledRequests
  aws_namespace: AWS/DynamoDB
  aws_statistics:
  - Sum
- aws_dimensions:
  - TableName
  - Operation
  aws_metric_name: SystemErrors
  aws_namespace: AWS/DynamoDB
  aws_statistics:
  - Sum
- aws_dimensions:
  - TableName
  - Operation
  aws_metric_name: SuccessfulRequestLatency
  aws_namespace: AWS/DynamoDB
  aws_statistics:
  - Maximum
- aws_dimensions:
  - TableName
  - GlobalSecondaryIndexName
  aws_metric_name: WriteThrottleEvents
  aws_namespace: AWS/DynamoDB
  aws_statistics:
  - Sum
- aws_dimensions:
  - TableName
  - GlobalSecondaryIndexName
  aws_metric_name: ReadThrottleEvents
  aws_namespace: AWS/DynamoDB
  aws_statistics:
  - Sum
ebs.yml
region: us-east-1
metrics:
- aws_dimensions:
  - VolumeId
  aws_metric_name: VolumeWriteBytes
  aws_namespace: AWS/EBS
  aws_statistics:
  - Maximum
  - Average
- aws_dimensions:
  - VolumeId
  aws_metric_name: VolumeReadBytes
  aws_namespace: AWS/EBS
  aws_statistics:
  - Maximum
  - Average
- aws_dimensions:
  - VolumeId
  aws_metric_name: VolumeReadOps
  aws_namespace: AWS/EBS
  aws_statistics:
  - Average
- aws_dimensions:
  - VolumeId
  aws_metric_name: VolumeWriteOps
  aws_namespace: AWS/EBS
  aws_statistics:
  - Average
- aws_dimensions:
  - VolumeId
  aws_metric_name: VolumeTotalReadTime
  aws_namespace: AWS/EBS
  aws_statistics:
  - Sum
  - Average
- aws_dimensions:
  - VolumeId
  aws_metric_name: VolumeTotalWriteTime
  aws_namespace: AWS/EBS
  aws_statistics:
  - Sum
  - Average
- aws_dimensions:
  - VolumeId
  aws_metric_name: VolumeQueueLength
  aws_namespace: AWS/EBS
  aws_statistics:
  - Average
- aws_dimensions:
  - VolumeId
  aws_metric_name: BurstBalance
  aws_namespace: AWS/EBS
  aws_statistics:
  - Average
- aws_dimensions:
  - VolumeId
  aws_metric_name: VolumeIdleTime
  aws_namespace: AWS/EBS
  aws_statistics:
  - Sum
ec2.yml
region: us-east-1
metrics:
- aws_dimensions:
  - InstanceId
  aws_metric_name: CPUUtilization
  aws_namespace: AWS/EC2
  aws_tag_select:
    resource_type_selection: ec2:instance
    resource_id_dimension: InstanceId
- aws_dimensions:
  - InstanceId
  aws_metric_name: NetworkIn
  aws_namespace: AWS/EC2
- aws_dimensions:
  - InstanceId
  aws_metric_name: NetworkOut
  aws_namespace: AWS/EC2
- aws_dimensions:
  - InstanceId
  aws_metric_name: NetworkPacketsIn
  aws_namespace: AWS/EC2
- aws_dimensions:
  - InstanceId
  aws_metric_name: NetworkPacketsOut
  aws_namespace: AWS/EC2
- aws_dimensions:
  - InstanceId
  aws_metric_name: DiskWriteBytes
  aws_namespace: AWS/EC2
- aws_dimensions:
  - InstanceId
  aws_metric_name: DiskReadBytes
  aws_namespace: AWS/EC2
- aws_dimensions:
  - InstanceId
  aws_metric_name: CPUCreditBalance
  aws_namespace: AWS/EC2
- aws_dimensions:
  - InstanceId
  aws_metric_name: CPUCreditUsage
  aws_namespace: AWS/EC2
- aws_dimensions:
  - InstanceId
  aws_metric_name: StatusCheckFailed
  aws_namespace: AWS/EC2
- aws_dimensions:
  - InstanceId
  aws_metric_name: StatusCheckFailed_Instance
  aws_namespace: AWS/EC2
- aws_dimensions:
  - InstanceId
  aws_metric_name: StatusCheckFailed_System
  aws_namespace: AWS/EC2
elasticache.yml
region: us-east-1
metrics:
- aws_namespace: AWS/ElastiCache
  aws_metric_name: ActiveDefragHits
  aws_dimensions:
  - CacheNodeId
  - CacheClusterId
- aws_namespace: AWS/ElastiCache
  aws_metric_name: AuthenticationFailures
  aws_dimensions:
  - CacheNodeId
  - CacheClusterId
- aws_namespace: AWS/ElastiCache
  aws_metric_name: BytesReadIntoMemcached
  aws_dimensions:
  - CacheNodeId
  - CacheClusterId
- aws_namespace: AWS/ElastiCache
  aws_metric_name: BytesUsedForCache
  aws_dimensions:
  - CacheNodeId
  - CacheClusterId
- aws_namespace: AWS/ElastiCache
  aws_metric_name: BytesUsedForCacheItems
  aws_dimensions:
  - CacheNodeId
  - CacheClusterId
- aws_namespace: AWS/ElastiCache
  aws_metric_name: BytesUsedForHash
  aws_dimensions:
  - CacheNodeId
  - CacheClusterId
- aws_namespace: AWS/ElastiCache
  aws_metric_name: BytesWrittenOutFromMemcached
  aws_dimensions:
  - CacheNodeId
  - CacheClusterId
- aws_namespace: AWS/ElastiCache
  aws_metric_name: CPUCreditBalance
  aws_dimensions:
  - CacheNodeId
  - CacheClusterId
- aws_namespace: AWS/ElastiCache
  aws_metric_name: CPUCreditUsage
  aws_dimensions:
  - CacheNodeId
  - CacheClusterId
- aws_namespace: AWS/ElastiCache
  aws_metric_name: CPUUtilization
  aws_dimensions:
  - CacheNodeId
  - CacheClusterId
- aws_namespace: AWS/ElastiCache
  aws_metric_name: CacheHits
  aws_dimensions:
  - CacheNodeId
  - CacheClusterId
- aws_namespace: AWS/ElastiCache
  aws_metric_name: CacheMisses
  aws_dimensions:
  - CacheNodeId
  - CacheClusterId
- aws_namespace: AWS/ElastiCache
  aws_metric_name: CasBadval
  aws_dimensions:
  - CacheNodeId
  - CacheClusterId
- aws_namespace: AWS/ElastiCache
  aws_metric_name: CasHits
  aws_dimensions:
  - CacheNodeId
  - CacheClusterId
- aws_namespace: AWS/ElastiCache
  aws_metric_name: CasMisses
  aws_dimensions:
  - CacheNodeId
  - CacheClusterId
- aws_namespace: AWS/ElastiCache
  aws_metric_name: CmdConfigGet
  aws_dimensions:
  - CacheNodeId
  - CacheClusterId
- aws_namespace: AWS/ElastiCache
  aws_metric_name: CmdConfigSet
  aws_dimensions:
  - CacheNodeId
  - CacheClusterId
- aws_namespace: AWS/ElastiCache
  aws_metric_name: CmdFlush
  aws_dimensions:
  - CacheNodeId
  - CacheClusterId
- aws_namespace: AWS/ElastiCache
  aws_metric_name: CmdGet
  aws_dimensions:
  - CacheNodeId
  - CacheClusterId
- aws_namespace: AWS/ElastiCache
  aws_metric_name: CmdSet
  aws_dimensions:
  - CacheNodeId
  - CacheClusterId
- aws_namespace: AWS/ElastiCache
  aws_metric_name: CmdTouch
  aws_dimensions:
  - CacheNodeId
  - CacheClusterId
- aws_namespace: AWS/ElastiCache
  aws_metric_name: CommandAuthorizationFailures
  aws_dimensions:
  - CacheNodeId
  - CacheClusterId
- aws_namespace: AWS/ElastiCache
  aws_metric_name: CrawlerItemsChecked
  aws_dimensions:
  - CacheNodeId
  - CacheClusterId
- aws_namespace: AWS/ElastiCache
  aws_metric_name: CurrConfig
  aws_dimensions:
  - CacheNodeId
  - CacheClusterId
- aws_namespace: AWS/ElastiCache
  aws_metric_name: CurrConnections
  aws_dimensions:
  - CacheNodeId
  - CacheClusterId
- aws_namespace: AWS/ElastiCache
  aws_metric_name: CurrItems
  aws_dimensions:
  - CacheNodeId
  - CacheClusterId
- aws_namespace: AWS/ElastiCache
  aws_metric_name: CurrVolatileItems
  aws_dimensions:
  - CacheNodeId
  - CacheClusterId
- aws_namespace: AWS/ElastiCache
  aws_metric_name: DatabaseMemoryUsageCountedForEvictPercentage
  aws_dimensions:
  - NodeGroupId
  - ReplciationGroupId
- aws_namespace: AWS/ElastiCache
  aws_metric_name: DatabaseMemoryUsagePercentage
  aws_dimensions:
  - CacheNodeId
  - CacheClusterId
- aws_namespace: AWS/ElastiCache
  aws_metric_name: DecrHits
  aws_dimensions:
  - CacheNodeId
  - CacheClusterId
- aws_namespace: AWS/ElastiCache
  aws_metric_name: DecrMisses
  aws_dimensions:
  - CacheNodeId
  - CacheClusterId
- aws_namespace: AWS/ElastiCache
  aws_metric_name: DeleteHits
  aws_dimensions:
  - CacheNodeId
  - CacheClusterId
- aws_namespace: AWS/ElastiCache
  aws_metric_name: DeleteMisses
  aws_dimensions:
  - CacheNodeId
  - CacheClusterId
- aws_namespace: AWS/ElastiCache
  aws_metric_name: EngineCPUUtilization
  aws_dimensions:
  - CacheNodeId
  - CacheClusterId
  - NodeGroupId
  - ReplicationGroupId
  - Role
- aws_namespace: AWS/ElastiCache
  aws_metric_name: EvictedUnfetched
  aws_dimensions:
  - CacheNodeId
  - CacheClusterId
- aws_namespace: AWS/ElastiCache
  aws_metric_name: Evictions
  aws_dimensions:
  - CacheNodeId
  - CacheClusterId
- aws_namespace: AWS/ElastiCache
  aws_metric_name: ExpiredUnfetched
  aws_dimensions:
  - CacheNodeId
  - CacheClusterId
- aws_namespace: AWS/ElastiCache
  aws_metric_name: FreeableMemory
  aws_dimensions:
  - CacheNodeId
  - CacheClusterId
- aws_namespace: AWS/ElastiCache
  aws_metric_name: GetHits
  aws_dimensions:
  - CacheNodeId
  - CacheClusterId
- aws_namespace: AWS/ElastiCache
  aws_metric_name: GetMisses
  aws_dimensions:
  - CacheNodeId
  - CacheClusterId
- aws_namespace: AWS/ElastiCache
  aws_metric_name: IamAuthenticationExpirations
  aws_dimensions:
  - CacheNodeId
  - CacheClusterId
- aws_namespace: AWS/ElastiCache
  aws_metric_name: IamAuthenticationThrottling
  aws_dimensions:
  - CacheNodeId
  - CacheClusterId
- aws_namespace: AWS/ElastiCache
  aws_metric_name: IncrHits
  aws_dimensions:
  - CacheNodeId
  - CacheClusterId
- aws_namespace: AWS/ElastiCache
  aws_metric_name: IncrMisses
  aws_dimensions:
  - CacheNodeId
  - CacheClusterId
- aws_namespace: AWS/ElastiCache
  aws_metric_name: IsMaster
  aws_dimensions:
  - CacheNodeId
  - CacheClusterId
- aws_namespace: AWS/ElastiCache
  aws_metric_name: KeyAuthorizationFailures
  aws_dimensions:
  - CacheNodeId
  - CacheClusterId
- aws_namespace: AWS/ElastiCache
  aws_metric_name: KeyBasedCmds
  aws_dimensions:
  - CacheNodeId
  - CacheClusterId
- aws_namespace: AWS/ElastiCache
  aws_metric_name: ListBasedCmds
  aws_dimensions:
  - CacheNodeId
  - CacheClusterId
- aws_namespace: AWS/ElastiCache
  aws_metric_name: KeysTracked
  aws_dimensions:
  - CacheNodeId
  - CacheClusterId
- aws_namespace: AWS/ElastiCache
  aws_metric_name: MasterLinkHealthStatus
  aws_dimensions:
  - CacheNodeId
  - CacheClusterId
- aws_namespace: AWS/ElastiCache
  aws_metric_name: MemoryFragmentationRatio
  aws_dimensions:
  - CacheNodeId
  - CacheClusterId
- aws_namespace: AWS/ElastiCache
  aws_metric_name: NetworkBandwidthInAllowanceExceeded
  aws_dimensions:
  - CacheNodeId
  - CacheClusterId
- aws_namespace: AWS/ElastiCache
  aws_metric_name: NetworkBandwidthOutAllowanceExceeded
  aws_dimensions:
  - CacheNodeId
  - CacheClusterId
- aws_namespace: AWS/ElastiCache
  aws_metric_name: NetworkBytesIn
  aws_dimensions:
  - CacheNodeId
  - CacheClusterId
- aws_namespace: AWS/ElastiCache
  aws_metric_name: NetworkBytesOut
  aws_dimensions:
  - CacheNodeId
  - CacheClusterId
- aws_namespace: AWS/ElastiCache
  aws_metric_name: NetworkConntrackAllowanceExceeded
  aws_dimensions:
  - CacheNodeId
  - CacheClusterId
- aws_namespace: AWS/ElastiCache
  aws_metric_name: NetworkPacketsIn
  aws_dimensions:
  - CacheNodeId
  - CacheClusterId
- aws_namespace: AWS/ElastiCache
  aws_metric_name: NetworkPacketsOut
  aws_dimensions:
  - CacheNodeId
  - CacheClusterId
- aws_namespace: AWS/ElastiCache
  aws_metric_name: NetworkPacketsPerSecondAllowanceExceeded
  aws_dimensions:
  - CacheNodeId
  - CacheClusterId
- aws_namespace: AWS/ElastiCache
  aws_metric_name: NewConnections
  aws_dimensions:
  - CacheNodeId
  - CacheClusterId
- aws_namespace: AWS/ElastiCache
  aws_metric_name: NewItems
  aws_dimensions:
  - CacheNodeId
  - CacheClusterId
- aws_namespace: AWS/ElastiCache
  aws_metric_name: NonKeyTypeCmds
  aws_dimensions:
  - CacheNodeId
  - CacheClusterId
- aws_namespace: AWS/ElastiCache
  aws_metric_name: NonKeyTypeCmdsLatency
  aws_dimensions:
  - CacheNodeId
  - CacheClusterId
- aws_namespace: AWS/ElastiCache
  aws_metric_name: Reclaimed
  aws_dimensions:
  - CacheNodeId
  - CacheClusterId
- aws_namespace: AWS/ElastiCache
  aws_metric_name: ReplicationBytes
  aws_dimensions:
  - CacheNodeId
  - CacheClusterId
- aws_namespace: AWS/ElastiCache
  aws_metric_name: ReplicationLag
  aws_dimensions:
  - CacheNodeId
  - CacheClusterId
- aws_namespace: AWS/ElastiCache
  aws_metric_name: SetBasedCmds
  aws_dimensions:
  - CacheNodeId
  - CacheClusterId
- aws_namespace: AWS/ElastiCache
  aws_metric_name: SetTypeCmds
  aws_dimensions:
  - CacheNodeId
  - CacheClusterId
- aws_namespace: AWS/ElastiCache
  aws_metric_name: SlabsMoved
  aws_dimensions:
  - CacheNodeId
  - CacheClusterId
- aws_namespace: AWS/ElastiCache
  aws_metric_name: SortedSetBasedCmds
  aws_dimensions:
  - CacheNodeId
  - CacheClusterId
- aws_namespace: AWS/ElastiCache
  aws_metric_name: StringBasedCmds
  aws_dimensions:
  - CacheNodeId
  - CacheClusterId
- aws_namespace: AWS/ElastiCache
  aws_metric_name: SaveInProgress
  aws_dimensions:
  - CacheNodeId
  - CacheClusterId
- aws_namespace: AWS/ElastiCache
  aws_metric_name: SwapUsage
  aws_dimensions:
  - CacheNodeId
  - CacheClusterId
- aws_namespace: AWS/ElastiCache
  aws_metric_name: TouchHits
  aws_dimensions:
  - CacheNodeId
  - CacheClusterId
- aws_namespace: AWS/ElastiCache
  aws_metric_name: TouchMisses
  aws_dimensions:
  - CacheNodeId
  - CacheClusterId
- aws_namespace: AWS/ElastiCache
  aws_metric_name: TrafficManagementActive
  aws_dimensions:
  - CacheNodeId
  - CacheClusterId
- aws_namespace: AWS/ElastiCache
  aws_metric_name: UnusedMemory
  aws_dimensions:
  - CacheNodeId
  - CacheClusterId
elb.yml
region: us-east-1
metrics:
- aws_dimensions:
  - AvailabilityZone
  aws_metric_name: BackendConnectionErrors
  aws_namespace: AWS/ELB
- aws_dimensions:
  - AvailabilityZone
  aws_metric_name: HTTPCode_Backend_5XX
  aws_namespace: AWS/ELB
- aws_dimensions:
  - AvailabilityZone
  aws_metric_name: HTTPCode_Backend_4XX
  aws_namespace: AWS/ELB
- aws_dimensions:
  - AvailabilityZone
  aws_metric_name: HTTPCode_Backend_3XX
  aws_namespace: AWS/ELB
- aws_dimensions:
  - AvailabilityZone
  aws_metric_name: HTTPCode_Backend_2XX
  aws_namespace: AWS/ELB
- aws_dimensions:
  - AvailabilityZone
  aws_metric_name: HTTPCode_ELB_5XX
  aws_namespace: AWS/ELB
- aws_dimensions:
  - AvailabilityZone
  aws_metric_name: RequestCount
  aws_namespace: AWS/ELB
- aws_dimensions:
  - AvailabilityZone
  aws_metric_name: HTTPCode_ELB_4XX
  aws_namespace: AWS/ELB
- aws_dimensions:
  - AvailabilityZone
  aws_metric_name: Latency
  aws_namespace: AWS/ELB
- aws_dimensions:
  - AvailabilityZone
  aws_metric_name: SurgeQueueLength
  aws_namespace: AWS/ELB
- aws_dimensions:
  - AvailabilityZone
  aws_metric_name: ActiveFlowCount
  aws_namespace: AWS/ELB
- aws_dimensions:
  - AvailabilityZone
  aws_metric_name: ActiveFlowCount_TLS
  aws_namespace: AWS/ELB
- aws_dimensions:
  - AvailabilityZone
  aws_metric_name: ProcessedBytes
  aws_namespace: AWS/ELB
- aws_dimensions:
  - AvailabilityZone
  aws_metric_name: ProcessedBytes_TLS
  aws_namespace: AWS/ELB
- aws_dimensions:
  - AvailabilityZone
  aws_metric_name: HealthyHostCount
  aws_namespace: AWS/ELB
- aws_dimensions:
  - AvailabilityZone
  aws_metric_name: UnHealthyHostCount
  aws_namespace: AWS/ELB
- aws_dimensions:
  - AvailabilityZone
  aws_metric_name: NewFlowCount
  aws_namespace: AWS/ELB
- aws_dimensions:
  - AvailabilityZone
  aws_metric_name: NewFlowCount_TLS
  aws_namespace: AWS/ELB
- aws_dimensions:
  - AvailabilityZone
  aws_metric_name: TCP_Client_Reset_Count
  aws_namespace: AWS/ELB
- aws_dimensions:
  - AvailabilityZone
  aws_metric_name: TCP_Target_Reset_Count
  aws_namespace: AWS/ELB
- aws_dimensions:
  - AvailabilityZone
  aws_metric_name: TCP_ELB_Reset_Count
  aws_namespace: AWS/ELB
- aws_dimensions:
  - AvailabilityZone
  aws_metric_name: ClientTLSNegotiationErrorCount
  aws_namespace: AWS/ELB
- aws_dimensions:
  - AvailabilityZone
  aws_metric_name: TargetTLSNegotiationErrorCount
  aws_namespace: AWS/ELB
- aws_dimensions:
  - AvailabilityZone
  aws_metric_name: ConsumedLCUs
  aws_namespace: AWS/ELB
- aws_dimensions:
  - AvailabilityZone
  aws_metric_name: SpilloverCount
  aws_namespace: AWS/ELB
kinesis.yml
region: us-east-2
metrics:
- aws_dimensions:
  - StreamName
  aws_metric_name: IncomingBytes
  aws_namespace: AWS/Kinesis
- aws_dimensions:
  - StreamName
  aws_metric_name: PutRecord.Bytes
  aws_namespace: AWS/Kinesis
- aws_dimensions:
  - StreamName
  aws_metric_name: PutRecords.Bytes
  aws_namespace: AWS/Kinesis
- aws_dimensions:
  - StreamName
  aws_metric_name: GetRecords.Latency
  aws_namespace: AWS/Kinesis
- aws_dimensions:
  - StreamName
  aws_metric_name: PutRecord.Success
  aws_namespace: AWS/Kinesis
- aws_dimensions:
  - StreamName
  aws_metric_name: PutRecords.Success
  aws_namespace: AWS/Kinesis
- aws_dimensions:
  - StreamName
  aws_metric_name: GetRecords.Latency
  aws_namespace: AWS/Kinesis
- aws_dimensions:
  - StreamName
  aws_metric_name: PutRecord.Latency
  aws_namespace: AWS/Kinesis
- aws_dimensions:
  - StreamName
  aws_metric_name: PutRecords.Latency
  aws_namespace: AWS/Kinesis
- aws_dimensions:
  - StreamName
  aws_metric_name: GetRecords.Latency
  aws_namespace: AWS/Kinesis
- aws_dimensions:
  - StreamName
  aws_metric_name: GetRecords.Records
  aws_namespace: AWS/Kinesis
- aws_dimensions:
  - StreamName
  aws_metric_name: GetRecords.Bytes
  aws_namespace: AWS/Kinesis
- aws_dimensions:
  - StreamName
  aws_metric_name: GetRecords.Success
  aws_namespace: AWS/Kinesis
- aws_dimensions:
  - StreamName
  aws_metric_name: GetRecords.IteratorAgeMilliseconds
  aws_namespace: AWS/Kinesis
- aws_dimensions:
  - StreamName
  aws_metric_name: IncomingRecords
  aws_namespace: AWS/Kinesis
- aws_dimensions:
  - StreamName
  aws_metric_name: IncomingBytes
  aws_namespace: AWS/Kinesis
- aws_dimensions:
  - StreamName
  aws_metric_name: WriteProvisionedThroughputExceeded
  aws_namespace: AWS/Kinesis
- aws_dimensions:
  - StreamName
  aws_metric_name: ReadProvisionedThroughputExceeded
  aws_namespace: AWS/Kinesis
lambda.yml
region: us-east-1
metrics:
- aws_dimensions:
  - FunctionName
  - Resource
  aws_metric_name: Invocations
  aws_namespace: AWS/Lambda
- aws_dimensions:
  - FunctionName
  - Resource
  aws_metric_name: Errors
  aws_namespace: AWS/Lambda
- aws_dimensions:
  - FunctionName
  - Resource
  aws_metric_name: Duration
  aws_namespace: AWS/Lambda
- aws_dimensions:
  - FunctionName
  - Resource
  aws_metric_name: Throttles
  aws_namespace: AWS/Lambda
- aws_dimensions:
  - FunctionName
  - Resource
  aws_metric_name: ConcurrentExecutions
  aws_namespace: AWS/Lambda
- aws_dimensions:
  - FunctionName
  - Resource
  aws_metric_name: UnreservedConcurrentExecutions
  aws_namespace: AWS/Lambda
networkelb.yml
region: us-east-1
metrics:
- aws_dimensions:
  - AvailabilityZone
  - LoadBalancer
  - TargetGroup
  aws_metric_name: ActiveFlowCount
  aws_namespace: AWS/NetworkELB
  aws_statistics:
  - Average
- aws_dimensions:
  - AvailabilityZone
  - LoadBalancer
  - TargetGroup
  aws_metric_name: ActiveFlowCount_TCP
  aws_namespace: AWS/NetworkELB
  aws_statistics:
  - Average
- aws_dimensions:
  - AvailabilityZone
  - LoadBalancer
  - TargetGroup
  aws_metric_name: ActiveFlowCount_UDP
  aws_namespace: AWS/NetworkELB
  aws_statistics:
  - Average
- aws_dimensions:
  - AvailabilityZone
  - LoadBalancer
  - TargetGroup
  aws_metric_name: ClientTLSNegotiationErrorCount
  aws_namespace: AWS/NetworkELB
  aws_statistics:
  - Sum
- aws_dimensions:
  - LoadBalancer
  aws_metric_name: ConsumedLCUs
  aws_namespace: AWS/NetworkELB
  aws_statistics:
  - Average
- aws_dimensions:
  - LoadBalancer
  aws_metric_name: ConsumedLCUs_TCP
  aws_namespace: AWS/NetworkELB
  aws_statistics:
  - Average
- aws_dimensions:
  - LoadBalancer
  aws_metric_name: ConsumedLCUs_TLS
  aws_namespace: AWS/NetworkELB
  aws_statistics:
  - Average
- aws_dimensions:
  - LoadBalancer
  aws_metric_name: ConsumedLCUs_UDP
  aws_namespace: AWS/NetworkELB
  aws_statistics:
  - Average
- aws_dimensions:
  - AvailabilityZone
  - LoadBalancer
  - TargetGroup
  aws_metric_name: HealthyHostCount
  aws_namespace: AWS/NetworkELB
  aws_statistics:
  - Minimum
- aws_dimensions:
  - AvailabilityZone
  - LoadBalancer
  - TargetGroup
  aws_metric_name: NewFlowCount
  aws_namespace: AWS/NetworkELB
  aws_statistics:
  - Sum
- aws_dimensions:
  - AvailabilityZone
  - LoadBalancer
  - TargetGroup
  aws_metric_name: NewFlowCount_TCP
  aws_namespace: AWS/NetworkELB
  aws_statistics:
  - Sum
- aws_dimensions:
  - AvailabilityZone
  - LoadBalancer
  - TargetGroup
  aws_metric_name: NewFlowCount_TLS
  aws_namespace: AWS/NetworkELB
  aws_statistics:
  - Sum
- aws_dimensions:
  - AvailabilityZone
  - LoadBalancer
  - TargetGroup
  aws_metric_name: NewFlowCount_UDP
  aws_namespace: AWS/NetworkELB
  aws_statistics:
  - Sum
- aws_dimensions:
  - AvailabilityZone
  - LoadBalancer
  - TargetGroup
  aws_metric_name: ProcessedBytes
  aws_namespace: AWS/NetworkELB
  aws_statistics:
  - Sum
- aws_dimensions:
  - AvailabilityZone
  - LoadBalancer
  - TargetGroup
  aws_metric_name: ProcessedBytes_TLS
  aws_namespace: AWS/NetworkELB
  aws_statistics:
  - Sum
- aws_dimensions:
  - AvailabilityZone
  - LoadBalancer
  - TargetGroup
  aws_metric_name: ProcessedBytes_UDP
  aws_namespace: AWS/NetworkELB
  aws_statistics:
  - Sum
- aws_dimensions:
  - AvailabilityZone
  - LoadBalancer
  - TargetGroup
  aws_metric_name: ProcessedPackets
  aws_namespace: AWS/NetworkELB
  aws_statistics:
  - Sum
- aws_dimensions:
  - AvailabilityZone
  - LoadBalancer
  - TargetGroup
  aws_metric_name: TargetTLSNegotiationErrorCount
  aws_namespace: AWS/NetworkELB
  aws_statistics:
  - Sum
- aws_dimensions:
  - AvailabilityZone
  - LoadBalancer
  - TargetGroup
  aws_metric_name: TCP_Client_Reset_Count
  aws_namespace: AWS/NetworkELB
  aws_statistics:
  - Sum
- aws_dimensions:
  - AvailabilityZone
  - LoadBalancer
  - TargetGroup
  aws_metric_name: TCP_Target_Reset_Count
  aws_namespace: AWS/NetworkELB
  aws_statistics:
  - Sum
- aws_dimensions:
  - AvailabilityZone
  - LoadBalancer
  - TargetGroup
  aws_metric_name: UnHealthyHostCount
  aws_namespace: AWS/NetworkELB
  aws_statistics:
  - Maximum
rds.yml
region: us-east-1
metrics:
- aws_dimensions:
  - DBInstanceIdentifier
  aws_metric_name: BinLogDiskUsage
  aws_namespace: AWS/RDS
- aws_dimensions:
  - DBInstanceIdentifier
  aws_metric_name: DatabaseConnections
  aws_namespace: AWS/RDS
- aws_dimensions:
  - DBInstanceIdentifier
  aws_metric_name: FreeStorageSpace
  aws_namespace: AWS/RDS
- aws_dimensions:
  - DBInstanceIdentifier
  aws_metric_name: FreeableMemory
  aws_namespace: AWS/RDS
- aws_dimensions:
  - DBInstanceIdentifier
  aws_metric_name: ReadIOPS
  aws_namespace: AWS/RDS
- aws_dimensions:
  - DBInstanceIdentifier
  aws_metric_name: WriteIOPS
  aws_namespace: AWS/RDS
- aws_dimensions:
  - DBInstanceIdentifier
  aws_metric_name: ReadLatency
  aws_namespace: AWS/RDS
- aws_dimensions:
  - DBInstanceIdentifier
  aws_metric_name: WriteLatency
  aws_namespace: AWS/RDS
- aws_dimensions:
  - DBInstanceIdentifier
  aws_metric_name: ReadThroughput
  aws_namespace: AWS/RDS
- aws_dimensions:
  - DBInstanceIdentifier
  aws_metric_name: WriteThroughput
  aws_namespace: AWS/RDS
- aws_dimensions:
  - DBInstanceIdentifier
  aws_metric_name: CPUCreditUsage
  aws_namespace: AWS/RDS
- aws_dimensions:
  - DBInstanceIdentifier
  aws_metric_name: ReplicaLag
  aws_namespace: AWS/RDS
- aws_dimensions:
  - DBInstanceIdentifier
  aws_metric_name: CPUUtilization
  aws_namespace: AWS/RDS
- aws_dimensions:
  - DBInstanceIdentifier
  aws_metric_name: CPUCreditBalance
  aws_namespace: AWS/RDS
- aws_dimensions:
  - DBInstanceIdentifier
  aws_metric_name: DiskQueueDepth
  aws_namespace: AWS/RDS
- aws_dimensions:
  - DBInstanceIdentifier
  aws_metric_name: NetworkTransmitThroughput
  aws_namespace: AWS/RDS
- aws_dimensions:
  - DBInstanceIdentifier
  aws_metric_name: NetworkReceiveThroughput
  aws_namespace: AWS/RDS
- aws_dimensions:
  - DBInstanceIdentifier
  aws_metric_name: TransactionLogsDiskUsage
  aws_namespace: AWS/RDS
- aws_dimensions:
  - DBInstanceIdentifier
  aws_metric_name: SwapUsage
  aws_namespace: AWS/RDS
- aws_dimensions:
  - EngineName
  aws_metric_name: BinLogDiskUsage
  aws_namespace: AWS/RDS
- aws_dimensions:
  - EngineName
  aws_metric_name: DatabaseConnections
  aws_namespace: AWS/RDS
- aws_dimensions:
  - EngineName
  aws_metric_name: FreeStorageSpace
  aws_namespace: AWS/RDS
- aws_dimensions:
  - EngineName
  aws_metric_name: FreeableMemory
  aws_namespace: AWS/RDS
- aws_dimensions:
  - EngineName
  aws_metric_name: ReadIOPS
  aws_namespace: AWS/RDS
- aws_dimensions:
  - EngineName
  aws_metric_name: WriteIOPS
  aws_namespace: AWS/RDS
- aws_dimensions:
  - EngineName
  aws_metric_name: ReadLatency
  aws_namespace: AWS/RDS
- aws_dimensions:
  - EngineName
  aws_metric_name: WriteLatency
  aws_namespace: AWS/RDS
- aws_dimensions:
  - EngineName
  aws_metric_name: ReadThroughput
  aws_namespace: AWS/RDS
- aws_dimensions:
  - EngineName
  aws_metric_name: WriteThroughput
  aws_namespace: AWS/RDS
- aws_dimensions:
  - EngineName
  aws_metric_name: CPUCreditUsage
  aws_namespace: AWS/RDS
- aws_dimensions:
  - EngineName
  aws_metric_name: ReplicaLag
  aws_namespace: AWS/RDS
- aws_dimensions:
  - EngineName
  aws_metric_name: CPUUtilization
  aws_namespace: AWS/RDS
- aws_dimensions:
  - EngineName
  aws_metric_name: CPUCreditBalance
  aws_namespace: AWS/RDS
- aws_dimensions:
  - EngineName
  aws_metric_name: DiskQueueDepth
  aws_namespace: AWS/RDS
- aws_dimensions:
  - EngineName
  aws_metric_name: NetworkTransmitThroughput
  aws_namespace: AWS/RDS
- aws_dimensions:
  - EngineName
  aws_metric_name: NetworkReceiveThroughput
  aws_namespace: AWS/RDS
- aws_dimensions:
  - EngineName
  aws_metric_name: TransactionLogsDiskUsage
  aws_namespace: AWS/RDS
- aws_dimensions:
  - EngineName
  aws_metric_name: SwapUsage
  aws_namespace: AWS/RDS
- aws_dimensions:
  - DatabaseClass
  aws_metric_name: BinLogDiskUsage
  aws_namespace: AWS/RDS
- aws_dimensions:
  - DatabaseClass
  aws_metric_name: DatabaseConnections
  aws_namespace: AWS/RDS
- aws_dimensions:
  - DatabaseClass
  aws_metric_name: FreeStorageSpace
  aws_namespace: AWS/RDS
- aws_dimensions:
  - DatabaseClass
  aws_metric_name: FreeableMemory
  aws_namespace: AWS/RDS
- aws_dimensions:
  - DatabaseClass
  aws_metric_name: ReadIOPS
  aws_namespace: AWS/RDS
- aws_dimensions:
  - DatabaseClass
  aws_metric_name: WriteIOPS
  aws_namespace: AWS/RDS
- aws_dimensions:
  - DatabaseClass
  aws_metric_name: ReadLatency
  aws_namespace: AWS/RDS
- aws_dimensions:
  - DatabaseClass
  aws_metric_name: WriteLatency
  aws_namespace: AWS/RDS
- aws_dimensions:
  - DatabaseClass
  aws_metric_name: ReadThroughput
  aws_namespace: AWS/RDS
- aws_dimensions:
  - DatabaseClass
  aws_metric_name: WriteThroughput
  aws_namespace: AWS/RDS
- aws_dimensions:
  - DatabaseClass
  aws_metric_name: CPUCreditUsage
  aws_namespace: AWS/RDS
- aws_dimensions:
  - DatabaseClass
  aws_metric_name: ReplicaLag
  aws_namespace: AWS/RDS
- aws_dimensions:
  - DatabaseClass
  aws_metric_name: CPUUtilization
  aws_namespace: AWS/RDS
- aws_dimensions:
  - DatabaseClass
  aws_metric_name: CPUCreditBalance
  aws_namespace: AWS/RDS
- aws_dimensions:
  - DatabaseClass
  aws_metric_name: DiskQueueDepth
  aws_namespace: AWS/RDS
- aws_dimensions:
  - DatabaseClass
  aws_metric_name: NetworkTransmitThroughput
  aws_namespace: AWS/RDS
- aws_dimensions:
  - DatabaseClass
  aws_metric_name: NetworkReceiveThroughput
  aws_namespace: AWS/RDS
- aws_dimensions:
  - DatabaseClass
  aws_metric_name: TransactionLogsDiskUsage
  aws_namespace: AWS/RDS
- aws_dimensions:
  - DatabaseClass
  aws_metric_name: SwapUsage
  aws_namespace: AWS/RDS
redshift.yml
region: us-east-2
metrics:
- aws_dimensions:
  - ClusterIdentifier
  - NodeID
  aws_metric_name: HealthStatus
  aws_namespace: AWS/Redshift
- aws_dimensions:
  - ClusterIdentifier
  - NodeID
  aws_metric_name: CPUUtilization
  aws_namespace: AWS/Redshift
- aws_dimensions:
  - ClusterIdentifier
  - NodeID
  aws_metric_name: DatabaseConnections
  aws_namespace: AWS/Redshift
- aws_dimensions:
  - ClusterIdentifier
  - NodeID
  aws_metric_name: MaintenanceMode
  aws_namespace: AWS/Redshift
- aws_dimensions:
  - ClusterIdentifier
  - NodeID
  aws_metric_name: NetworkReceiveThroughput
  aws_namespace: AWS/Redshift
- aws_dimensions:
  - ClusterIdentifier
  - NodeID
  aws_metric_name: NetworkTransmitThroughput
  aws_namespace: AWS/Redshift
- aws_dimensions:
  - ClusterIdentifier
  - NodeID
  aws_metric_name: ReadIOPS
  aws_namespace: AWS/Redshift
- aws_dimensions:
  - ClusterIdentifier
  - NodeID
  aws_metric_name: WriteIOPS
  aws_namespace: AWS/Redshift
- aws_dimensions:
  - ClusterIdentifier
  - NodeID
  aws_metric_name: ReadLatency
  aws_namespace: AWS/Redshift
- aws_dimensions:
  - ClusterIdentifier
  - NodeID
  aws_metric_name: WriteLatency
  aws_namespace: AWS/Redshift
- aws_dimensions:
  - ClusterIdentifier
  - NodeID
  aws_metric_name: ReadThroughput
  aws_namespace: AWS/Redshift
- aws_dimensions:
  - ClusterIdentifier
  - NodeID
  aws_metric_name: WriteThroughput
  aws_namespace: AWS/Redshift
- aws_dimensions:
  - ClusterIdentifier
  - NodeID
  aws_metric_name: QueryDuration
  aws_namespace: AWS/Redshift
- aws_dimensions:
  - ClusterIdentifier
  - NodeID
  aws_metric_name: QueriesCompletedPerSecond
  aws_namespace: AWS/Redshift
- aws_dimensions:
  - ClusterIdentifier
  - NodeID
  aws_metric_name: PercentageDiskSpaceUsed
  aws_namespace: AWS/Redshift
s3.yml
region: us-east-1
metrics:
- aws_dimensions:
  - BucketName
  - FilterId
  aws_metric_name: 4xxErrors
  aws_namespace: AWS/S3
- aws_dimensions:
  - BucketName
  - FilterId
  aws_metric_name: 5xxErrors
  aws_namespace: AWS/S3
- aws_dimensions:
  - BucketName
  - FilterId
  aws_metric_name: AllRequests
  aws_namespace: AWS/S3
- aws_dimensions:
  - BucketName
  - FilterId
  aws_metric_name: FirstByteLatency
  aws_namespace: AWS/S3
- aws_dimensions:
  - BucketName
  - FilterId
  aws_metric_name: TotalRequestLatency
  aws_namespace: AWS/S3
- aws_dimensions:
  - BucketName
  - FilterId
  aws_metric_name: BytesDownloaded
  aws_namespace: AWS/S3
- aws_dimensions:
  - BucketName
  - FilterId
  aws_metric_name: BytesUploaded
  aws_namespace: AWS/S3
- aws_dimensions:
  - BucketName
  - FilterId
  aws_metric_name: PutRequests
  aws_namespace: AWS/S3
- aws_dimensions:
  - BucketName
  - FilterId
  aws_metric_name: ListRequests
  aws_namespace: AWS/S3
- aws_dimensions:
  - BucketName
  - FilterId
  aws_metric_name: HeadRequests
  aws_namespace: AWS/S3
- aws_dimensions:
  - BucketName
  - FilterId
  aws_metric_name: GetRequests
  aws_namespace: AWS/S3
- aws_namespace: AWS/S3
  aws_metric_name: BucketSizeBytes
  aws_dimensions: [BucketName, StorageType]
  range_seconds: 172800
  period_seconds: 86400
  set_timestamp: false
- aws_namespace: AWS/S3
  aws_metric_name: NumberOfObjects
  aws_dimensions: [BucketName, StorageType]
  range_seconds: 172800
  period_seconds: 86400
  set_timestamp: false
  # In case you want to use some bucket level Tag to select buckets to monitor,
  # or to have additional `info` metric with all bucket Tags as labels, use `aws_tag_select`:
  aws_tag_select:
    tag_selections:
      Monitoring: ["enabled"]
    resource_type_selection: "s3:"
    resource_id_dimension: BucketName
ses.yml
region: us-east-1
metrics:
- aws_namespace: AWS/SES
  aws_metric_name: Bounce
  aws_dimensions: []
  aws_statistics: []
- aws_namespace: AWS/SES
  aws_metric_name: Complaint
  aws_dimensions: []
  aws_statistics: []
- aws_namespace: AWS/SES
  aws_metric_name: Delivery
  aws_dimensions: []
  aws_statistics: []
- aws_namespace: AWS/SES
  aws_metric_name: Reputation.BounceRate
  aws_dimensions: []
  aws_statistics: []
- aws_namespace: AWS/SES
  aws_metric_name: Reputation.ComplaintRate
  aws_dimensions: []
  aws_statistics: []
- aws_namespace: AWS/SES
  aws_metric_name: Send
  aws_dimensions: []
  aws_statistics: []
- aws_namespace: AWS/SES
  aws_metric_name: Reject
  aws_dimensions: []
  aws_statistics: []
sns.yml
region: us-east-1
metrics:
- aws_dimensions:
  - TopicName
  - Platform
  aws_metric_name: NumberOfMessagesPublished
  aws_namespace: AWS/SNS
  aws_statistics:
  - Sum
- aws_dimensions:
  - TopicName
  - Platform
  aws_metric_name: NumberOfNotificationsDelivered
  aws_namespace: AWS/SNS
  aws_statistics:
  - Sum
- aws_dimensions:
  - TopicName
  - Platform
  aws_metric_name: NumberOfNotificationsFailed
  aws_namespace: AWS/SNS
  aws_statistics:
  - Sum
- aws_dimensions:
  - TopicName
  - Platform
  aws_metric_name: PublishSize
  aws_namespace: AWS/SNS
  aws_statistics:
  - Average
  - Sum
  - Maximum
  - Minimum
  - Count
- aws_dimensions:
  - TopicName
  - Platform
  aws_metric_name: NumberOfNotificationsFilteredOut
  aws_namespace: AWS/SNS
  aws_statistics:
  - Sum
sqs.yml
region: us-east-1
metrics:
- aws_dimensions:
  - QueueName
  aws_metric_name: NumberOfMessagesSent
  aws_namespace: AWS/SQS
  aws_statistics:
  - Average
  - Minimum
  - Maximum
  - SampleCount
  - Sum
- aws_dimensions:
  - QueueName
  aws_metric_name: NumberOfMessagesReceived
  aws_namespace: AWS/SQS
  aws_statistics:
  - Average
  - Minimum
  - Maximum
  - SampleCount
  - Sum
- aws_dimensions:
  - QueueName
  aws_metric_name: NumberOfEmptyReceives
  aws_namespace: AWS/SQS
  aws_statistics:
  - Average
  - Minimum
  - Maximum
  - SampleCount
  - Sum
- aws_dimensions:
  - QueueName
  aws_metric_name: NumberOfMessagesDeleted
  aws_namespace: AWS/SQS
  aws_statistics:
  - Average
- aws_dimensions:
  - QueueName
  aws_metric_name: ApproximateNumberOfMessagesDelayed
  aws_namespace: AWS/SQS
  aws_statistics:
  - Average
  - Minimum
  - Maximum
  - SampleCount
  - Sum
- aws_dimensions:
  - QueueName
  aws_metric_name: ApproximateAgeOfOldestMessage
  aws_namespace: AWS/SQS
  aws_statistics:
  - Average
  - Minimum
  - Maximum
  - SampleCount
  - Sum
- aws_dimensions:
  - QueueName
  aws_metric_name: ApproximateNumberOfMessagesNotVisible
  aws_namespace: AWS/SQS
  aws_statistics:
  - Average
  - Minimum
  - Maximum
  - SampleCount
  - Sum
- aws_dimensions:
  - QueueName
  aws_metric_name: ApproximateNumberOfMessagesVisible
  aws_namespace: AWS/SQS
  aws_statistics:
  - Average
  - Minimum
  - Maximum
  - SampleCount
  - Sum
- aws_dimensions:
  - QueueName
  aws_metric_name: SentMessageSize
  aws_namespace: AWS/SQS
  aws_statistics:
  - Average
  - Minimum
  - Maximum
  - SampleCount
  - Sum