This document describes how to edit, list, and view your alerting policies by using the Google Cloud console. For example, it describes how to edit a policy so that it is associated with an App Hub application. This page also describes how to view the JSON representation of a policy, how to add alerting policies to a custom dashboard, which lets you view your policies in the same context as your metric data.
This document doesn't describe how to edit, list, and view your alerting policies by using the Cloud Monitoring API. For more information, see Manage alerting policies by API.
This feature is supported only for Google Cloud projects. For App Hub configurations, select the App Hub host project or the app-enabled folder's management project.
Before you begin
Complete the following in the Google Cloud project that stores your alerting policies:
-
To get the permissions that you need to create and modify alerting policies by using the Google Cloud console, ask your administrator to grant you the Monitoring Editor (
roles/monitoring.editor) IAM role on your project. For more information about granting roles, see Manage access to projects, folders, and organizations.You might also be able to get the required permissions through custom roles or other predefined roles.
For more information about Cloud Monitoring roles, see Control access with Identity and Access Management.
Verify that you're familiar with the general concepts of alerting policies. For more information, see Alerting overview.
Edit, list, or delete alerting policies
-
In the Google Cloud console, go to the notifications Alerting page:
If you use the search bar to find this page, then select the result whose subheading is Monitoring.
The Alerting page displays panes that list summary information, incidents, and alerting policies.
In the toolbar of the Google Cloud console, select your Google Cloud project. For App Hub configurations, select the App Hub host project or the app-enabled folder's management project.
Click See all policies in the Policies pane.
The Policies page lists all policies, includes a filter bar, and for each policy, options to edit, copy, or delete the policy:
To filter the list of alerting policies, do one of the following:
- Enter a name on the filter bar. For example, to display only policies
whose name contains
Example, enterExample. A case-sensitive comparison tests whether a policy is listed. - Click Filter policies, select the filter property, and then either enter a value for the filter or select a value from the menu.
When you add multiple filters, a logical
ANDjoins the filters.- Enter a name on the filter bar. For example, to display only policies
whose name contains
Optional: To view the details of a policy, click the name of the policy. For information about the Policy details page, see View an alerting policy.
Optional: To edit or copy a policy, click more_vert More options, and select the corresponding option. Editing and copying a policy is similar to creating a metric-based alerting policy. However, not all fields can be modified. When done, click Save policy.
Optional: To delete a policy, click more_vert More options and select Delete. In the confirmation dialog, select Delete.
If a dashboard contains a chart that displays data for an alerting policy, then that chart stops displaying data when the alerting policy is deleted. For more information, see Alerting policy widget doesn't display any data.
View an alerting policy
-
In the Google Cloud console, go to the notifications Alerting page:
If you use the search bar to find this page, then select the result whose subheading is Monitoring.
In the toolbar of the Google Cloud console, select your Google Cloud project. For App Hub configurations, select the App Hub host project or the app-enabled folder's management project.
To list all policies, click See all policies in the Policies pane.
Find the policy that you want to view, and then select it.
The details page for the alerting policy opens. Here, you can monitor or edit your policy and view related data, such as incidents and notifications. Additionally, you can do the following:
Modify the time range for the data shown in the chart. Charts have limited resolution and might not show every measurement for some time ranges.
Edit your alert to add user-defined labels, which will be included in your incidents and notifications. For more information, see Annotate incidents with labels.
Change the enabled state of the policy. When a policy is disabled, you won't get notifications.
View the JSON representation of an alerting policy
When you create or modify an alerting policy by using the Cloud Monitoring API, you provide a JSON representation of that policy to the API method. You can create the JSON yourself by using the API documentation to guide the content. An alternative is to create a policy by using the Google Cloud console, and then download the policy to your local system. The JSON file that you downloaded can be edited and used as a template for other policies. For examples of policies described by JSON, see Sample policies.
To download the JSON representation of an alerting policy, do the following:
-
In the Google Cloud console, go to the notifications Alerting page:
If you use the search bar to find this page, then select the result whose subheading is Monitoring.
- In the toolbar of the Google Cloud console, select your Google Cloud project. For App Hub configurations, select the App Hub host project or the app-enabled folder's management project.
- Find the policy that you want to view, and then click the policy name to open the Policy details page.
- Click get_app JSON.
To view the JSON representation of an alerting policy when you're editing it, click code View code.
Add alerting policy to dashboard
To view your alerting policies in the same context as your metric data, add those policies to a custom dashboard. When you view that dashboard, it shows a chart for each alerting policy that you added. These charts display the monitored metric, the threshold, and the number of open incidents for the policy. These charts also contain links that let you view or edit the policy.
You can add policies with one condition to custom dashboards. Policies that contain multiple conditions can be viewed only from the alerting context.
To display a summary of an alerting policy on a custom dashboard, do the following:
-
In the Google Cloud console, go to the
 Dashboards page:
If you use the search bar to find this page, then select the result whose subheading is Monitoring.
- In the toolbar of the Google Cloud console, select your Google Cloud project. For App Hub configurations, select the App Hub host project or the app-enabled folder's management project.
- Select a dashboard or click Create dashboard.
- In the toolbar, click add Add widget.
- In the Add widget dialog, select notifications Alert Policy.
- Click arrow_drop_down Alert policy, and then select an alerting policy. Only single-condition alerting policies can be selected from the Alert policy menu.
- To apply your changes to the dashboard, in the toolbar, click Apply. To discard your changes, click Cancel.
The following screenshot illustrates a chart for an alerting policy:
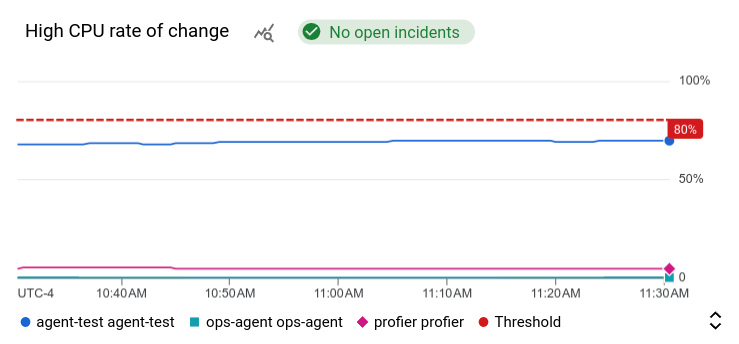
In this example, the alerting policy is monitoring the CPU usage of two
different virtual machines. The dashed line shows the condition threshold,
which is set to 50%. The green chip with the label No incidents
indicates that there are no open incidents for the alerting policy. If
you place your pointer on the chip that shows the number of open
incidents, then a dialog opens that links to the underlying alerting
policy.
For more information, see Display alerting policies and incidents on a dashboard.
Associate an alerting policy with an App Hub application
By adding user-defined labels to an alerting policy, you can associate it with a service or workload that is part of an App Hub application. These labels are included in incidents and notifications, and the alerting policy is also listed in the Application Monitoring dashboards. To learn more about labels, see Annotate incidents with labels.
To associate an alerting policy with a workload or service by using the Google Cloud console, do the following:
-
In the Google Cloud console, go to the notifications Alerting page:
If you use the search bar to find this page, then select the result whose subheading is Monitoring.
- In the toolbar of the Google Cloud console, select your Google Cloud project. For App Hub configurations, select the App Hub host project or the app-enabled folder's management project.
- Find the alerting policy, click more_vert View more, select Edit, and then go to the Notifications and name section.
- In the Application labels section, select your application and then select your workload or service.
- Click Save policy.
After you complete these steps, labels with the following keys are attached to your alerting policy. These labels identify your application and your service or workload:
apphub_application_locationapphub_application_idapphub_service_idorapphub_workload_id
You can also add user labels to an alerting policy by using the Google Cloud CLI, Terraform, or the Cloud Monitoring API. However, you must use the label keys shown in the previous example. For more information, see the following: