The Dialogflow CX console provides an analytics panel that shows various agent request and response data statistics. This data helps you assess how your agent is being used in production and may be used to improve your agent.
You can select from multiple data views and filter by time range. The statistics shown on all charts are computed hourly.
Open the analytics panel
To open the analytics panel:
- Go to the Dialogflow CX console.
- Choose your project.
- Select your agent.
- Select the Manage tab.
- Click Analytics.
- Using the link near the top, you can also access the New Analytics.
Common metric definitions
The following metrics are displayed on multiple charts:
- Interactions: Interactions include detect intent request counts via direct API calls and indirect calls via integrations.
- Sessions: Sessions are determined by the session ID provided to interactions. You must create unique session IDs for this metric to be meaningful. For each hour on the x-axis, the sessions metric shows a count of active sessions during that hour. If a session crosses an hour boundary, it will be counted for each hour it is active. Therefore, the sum of all hourly session values on a chart may be larger than the total number of actual sessions during the entire time period.
Overview view
The Overview view is at the top of the analytics panel.
This view has controls for the time period and time zone, which are applied to all content in the panel.
The following summary metrics are also shown:
- Usage (session count): Total number of sessions in the selected time period.
- Engagement (total interaction count): Total number of interactions in the selected time period.
- Path (average duration minutes): Average duration of the audio sessions in the selected time period.
- Back-end (error code %): Percentage of interactions that do not have OK status in the selected time period.
For each summary metric, a percent increase or decrease is shown. This shows the change in the metric since the same-sized time period just before the selected time period.
Usage view
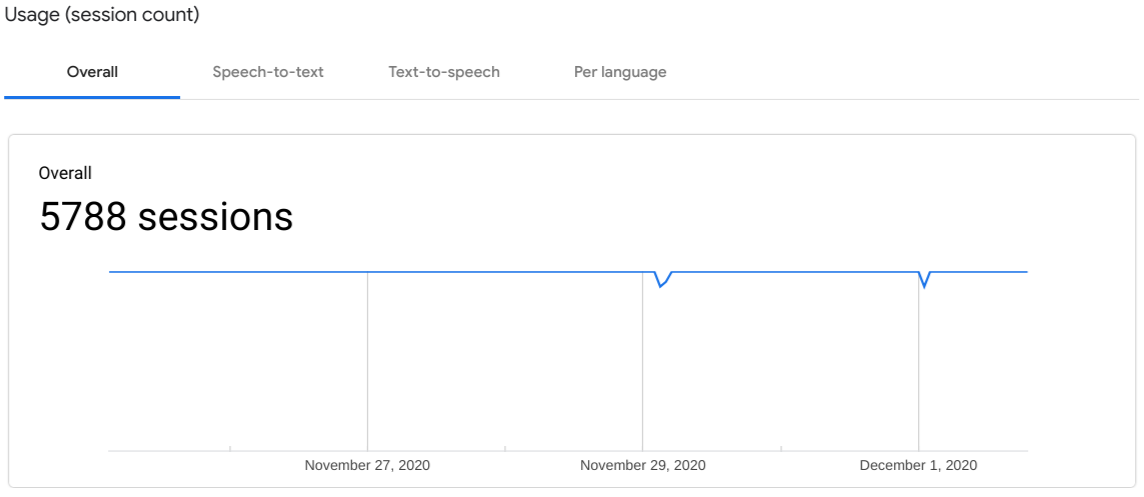
The Usage view shows session count for the selected time period. You can select the following tabs to filter the data:
- Overall: Shows all sessions.
- Speech-to-text: Shows sessions that used speech-to-text.
- Text-to-speech: Shows sessions that used text-to-speech.
- Per language: Charts sessions per language.
Engagement view
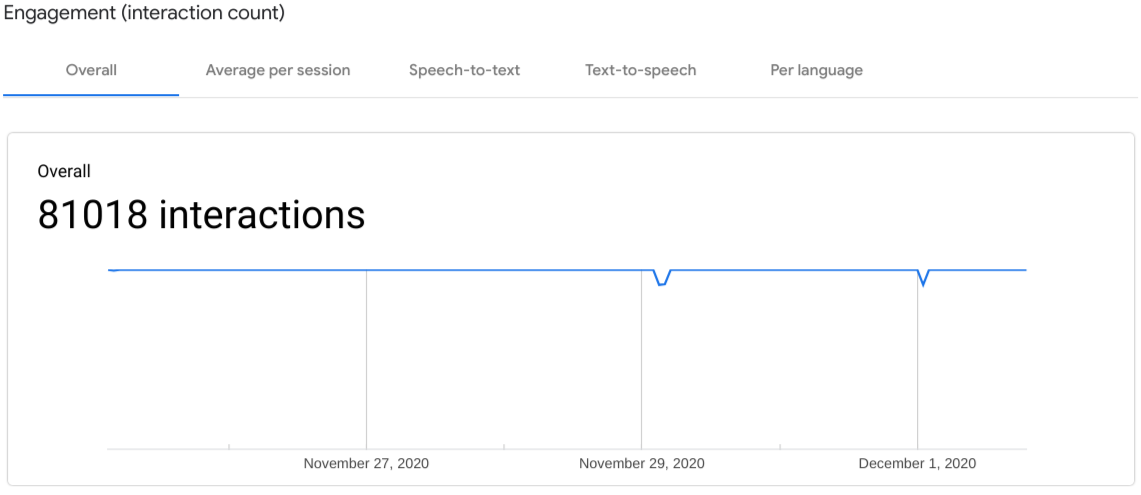
The Engagement view shows interaction count for the selected time period.
- Overall: Shows all interactions.
- Average per session: Shows the average interaction count per session.
- Speech-to-text: Shows interactions that used speech-to-text.
- Text-to-speech: Shows interactions that used text-to-speech.
- Per language: Charts interactions per language.
Understanding view
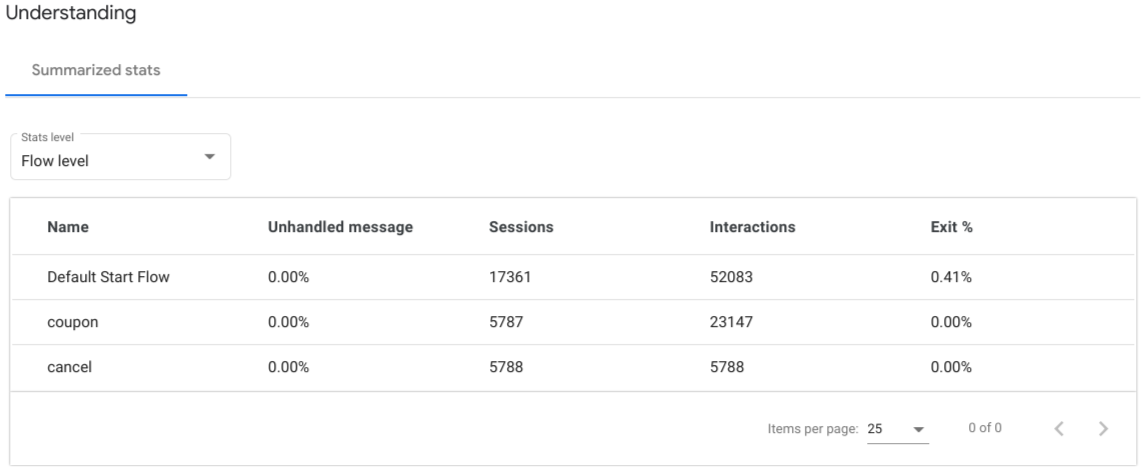
The Understanding view shows aggregate metrics at the intent, page and flow level. The level is selected with the drop-down.
- Unhandled message: The percentage of no-match interactions where end-user input did not match any intents for handlers that are in scope and did not satisfy any form parameters.
- Sessions: Session count for the selected level.
- Interactions: Interaction count for the selected level.
- Exit %: The percentage of sessions that ended with a flow, page, or intent match during the selected time period.
Path view
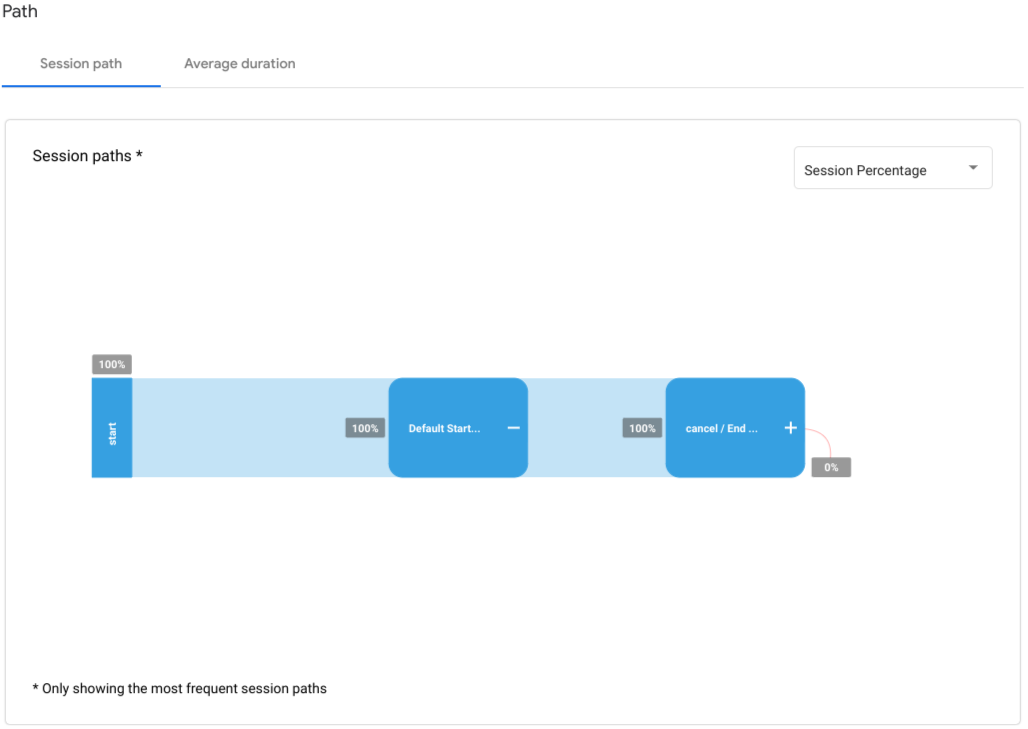
The Path view's Session path tab graphs page nodes with connecting page path lines. The page path lines in this graph show the frequencies as found in complete paths taken by common sessions for the agent. One page node may appear multiple times if it is matched in multiple paths or multiple times in a single path. You can interact with this chart by clicking page nodes to expand them.
Hovering your mouse over a page node shows a popup with metrics for the page:
- Sessions followed this path prefix: The count and percentage of sessions that followed the path up to the page node.
- Ended at this point: The percentage of sessions that ended on the path up to the page node.
The Average duration tab shows the hourly average duration of audio sessions.
Back-end session count
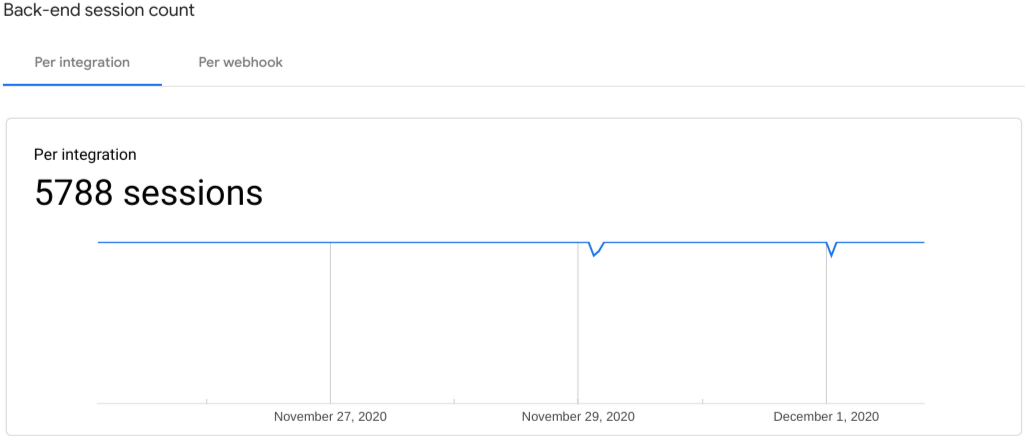
The Back-end session count view shows sessions by integrations and webhooks.
Back-end interaction count
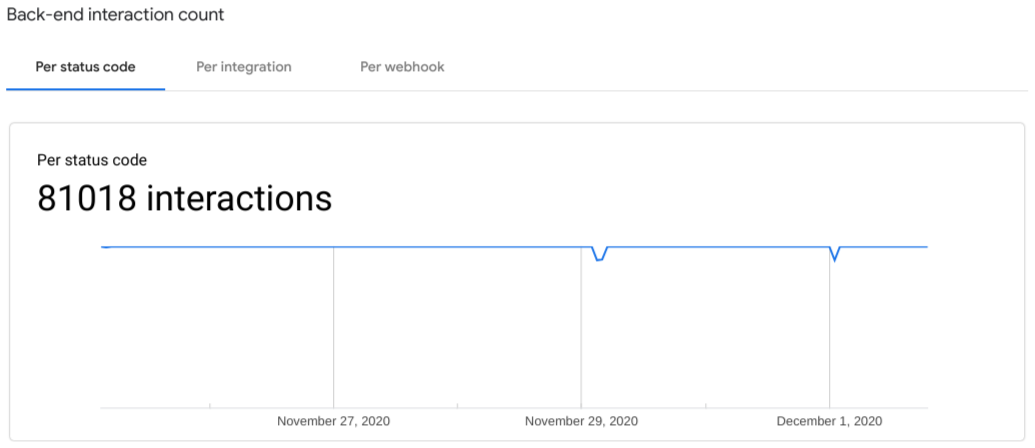
The Back-end interaction count view shows interactions by status codes, interactions and webhooks.
Limitations
The following limitations apply:
- It can take up to a day for data to appear in analytics.
