Understand performance
This page describes the approximate performance that Bigtable can provide under optimal conditions, factors that can affect performance, and tips for testing and troubleshooting Bigtable performance issues.
Performance for typical workloads
Bigtable delivers highly predictable performance that is linearly scalable. When you avoid the causes of slower performance, each Bigtable node can provide the following approximate throughput, depending on the storage type that the cluster uses:
| Storage Type | Reads | Writes | Scans | ||
|---|---|---|---|---|---|
| SSD | up to 17,000 rows per second | or | up to 14,000 rows per second | or | up to 220 MBps |
| HDD | up to 500 rows per second | or | up to 10,000 rows per second | or | up to 180 MBps |
| Infrequent access storage | up to 100 rows per second | or | up to 10,000 rows per second | or | up to 36 MBps |
These estimates assume each row contains 1 KB.
In general, a cluster's performance scales linearly as you add nodes to the cluster. For example, if you create an SSD cluster with 10 nodes, the cluster can support up to 140,000 rows per second for a typical read-only or write-only workload.
Plan your Bigtable capacity
When planning your Bigtable clusters, decide whether you want to optimize for latency or throughput. For example, for a batch data processing job, you might care more about throughput and less about latency. In contrast, for an online service that serves user requests, you might prioritize lower latency over throughput. You can achieve the numbers in the Performance for typical workloads section when you optimize for throughput.
CPU utilization
In almost all cases, we recommend that you use autoscaling, which lets Bigtable add or remove nodes based on usage. For more information, see Autoscaling.
Use the following guidelines when configuring your autoscaling targets or if you choose manual node allocation. These guidelines apply regardless of the number of clusters your instance has. For a cluster with manual node allocation, you must monitor the cluster's CPU utilization with the goal of keeping CPU utilization below these values for optimal performance.
| Optimization goal | Maximum CPU utilization |
|---|---|
| Throughput | 90% |
| Latency | 60% |
For more information on monitoring, see Monitoring.
Storage utilization
Storage is another consideration in capacity planning. The storage capacity of a cluster is determined by the storage type and the number of nodes in the cluster. When the amount of data stored in a cluster increases, Bigtable optimizes storage by distributing data across all nodes in the cluster.
You can determine the storage usage per node by dividing the cluster's storage utilization (bytes) by the number of nodes in the cluster. For example, consider a cluster that has three HDD nodes and 9 TB of data. Each node stores about 3 TB, which is 18.75% of the HDD storage per node limit of 16 TB.
When storage utilization increases, workloads can experience an increase in query processing latency even if the cluster has enough nodes to meet overall CPU needs. This is because the higher the storage per node, the more background work such as indexing is required. The increase in background work to handle more storage can result in higher latency and lower throughput.
Start with the following when configuring your autoscaling settings. If you choose manual node allocation, monitor the cluster's storage utilization and add or remove nodes to maintain the following.
| Optimization goal | Maximum storage utilization |
|---|---|
| Throughput | 70% |
| Latency | 60% |
For more information, see Storage per node.
Run your typical workloads against Bigtable
Always run your own typical workloads against a Bigtable cluster when doing capacity planning to determine the best resource allocation for your applications.
Google's PerfKit Benchmarker uses YCSB to benchmark cloud services. You can follow the PerfKitBenchmarker tutorial for Bigtable to create tests for your workloads. When doing so, tune the parameters in the benchmarking config YAML files to ensure the generated benchmark reflects the following production characteristics:
- Total size of your table (proportional, but at least 100 GB).
- Row data shape (row key size, number of columns, row data sizes, etc.)
- Data access pattern (row key distribution)
- Mixture of reads versus writes
Refer to Testing performance with Bigtable for more best practices.
Causes of slower performance
The following factors can cause Bigtable to perform more slowly than the estimates shown in the Performance for typical workloads section of this document:
- You read a large number of non-contiguous row keys or row ranges in a single read request. Bigtable scans the table and reads the requested rows sequentially. This lack of parallelism affects overall latency, and reads hitting a hot node can increase tail latency. See Reads and performance for details.
- Your table's schema is not designed correctly. To get good performance from Bigtable, it's essential to design a schema that makes it possible to distribute reads and writes evenly across each table. Additionally, hotspots in one table can affect the performance of other tables in the same instance. See Schema design best practices for more information.
- The rows in your Bigtable table contain large amounts of data. The performance estimates assume that each row contains 1 KB of data. You can read and write larger amounts of data per row, but increasing the amount of data per row will also reduce the number of rows per second.
- The rows in your Bigtable table contain a very large number of cells. It takes time for Bigtable to process each cell in a row. Also, each cell adds some overhead to the amount of data that's stored in your table and sent over the network. For example, if you're storing 1 KB (1,024 bytes) of data, it's much more space-efficient to store that data in a single cell, rather than spreading the data across 1,024 cells that each contain 1 byte. If you split your data across more cells than necessary, you might not get the best possible performance. If rows contain a large number of cells because columns contain multiple timestamped versions of data, consider keeping only the most recent value. Another option for an existing table is to send a deletion for all previous versions with each rewrite.
- The cluster doesn't have enough nodes. A cluster's nodes provide compute
for the cluster to handle incoming reads and writes, keep track of
storage, and perform maintenance tasks such as compaction. You need to make sure
that your cluster has enough nodes to satisfy the recommended limits for both
compute and storage. Use the monitoring tools to check
whether the cluster is overloaded.
- Compute - If your Bigtable cluster's CPU is overloaded, adding more nodes improves performance by spreading the workload across more nodes.
- Storage - If your storage usage per node is higher than recommended, add more nodes to maintain optimal latency and throughput, even if the cluster has enough CPU to process requests. Increasing storage per node increases the amount of background maintenance work per node. For details, see Trade-offs between storage usage and performance.
- You are using tiered storage (Preview). If you query older data that is stored on infrequent access storage, your performance will be slower than if you query data on SSD storage. Use time-range filters to get better performance when you query data in different storage tiers.
The Bigtable cluster was scaled up or scaled down recently. After autoscaling increases the number of nodes in a cluster, it can take up to 20 minutes under load before performance significantly improves. Bigtable scales cluster nodes based on the load they experience.
When you decrease the number of nodes in a cluster to scale down, try not to reduce the cluster size by more than 10% in a 10-minute period to minimize latency spikes.
The Bigtable cluster uses HDD disks. In most cases, your cluster should use SSD disks, which have significantly better performance than HDD disks. See Choosing between SSD and HDD storage for details.
There are issues with the network connection. Network issues can reduce throughput and cause reads and writes to take longer than usual. In particular, you might see issues if your clients are not running in the same zone as your Bigtable cluster, or if your clients run outside of Google Cloud.
You are using replication but your application is using an out-of-date client library. If you observe increased latency after enabling replication, make sure the Cloud Bigtable client library that your application is using is up to date. Earlier versions of the client libraries might not be optimized to support replication. See Cloud Bigtable client libraries to find your client library's GitHub repository, where you can check the version and upgrade if you need to.
You enabled replication but didn't add more nodes to your clusters. In an instance that uses replication, each cluster must handle the work of replication in addition to the load it receives from applications. Underprovisioned clusters can cause increased latency. You can verify this by checking the instance's CPU usage charts in the Google Cloud console.
Because different workloads can cause performance to vary, perform tests with your workloads to obtain the most accurate benchmarks.
Cold starts and low QPS
Cold starts and low QPS can increase latency. Bigtable performs best with large tables that are frequently accessed. For this reason, if you start sending requests after a period of no usage (a cold start), you might observe high latency while Bigtable reestablishes connections. Latency is also higher when QPS is low.
If your QPS is low, or if you know you will sometimes send requests to a Bigtable table after a period of inactivity, try the following strategies to keep your connection warm and prevent high latency.
- Send a low rate of artificial traffic to the table at all times.
- Configure the connection pool to ensure that steady QPS keeps the pool active.
During periods of low QPS, the number of errors that Bigtable returns is more relevant than the percentage of operations that return an error.
Cold start at client initialization time. If you are using a version of the Cloud Bigtable client for Java that is earlier than version 2.18.0, you can enable channel refreshing. In later versions, channel refreshing is enabled by default. Channel refreshing does two things:
- When the client initializes, it prepares the channel before sending the first requests.
- The server disconnects long-lived connections every hour. Channel priming preemptively replaces expiring channels.
However, this doesn't keep the channel alive when there are periods of inactivity.
How Bigtable optimizes your data over time
To store the underlying data for each of your tables, Bigtable shards the data into multiple tablets, which can be moved between nodes in your Bigtable cluster. This storage method enables Bigtable to use two strategies for optimizing data over time:
- Bigtable stores roughly the same amount of data on each Bigtable node.
- Bigtable distributes reads and writes equally across all Bigtable nodes.
Sometimes these strategies conflict. For example, if one tablet's rows are read extremely frequently, Bigtable might store that tablet on its own node, even if this causes some nodes to store more data than others.
As part of this process, Bigtable might split a tablet into two or more smaller tablets to reduce its size or to isolate hot rows within an existing tablet.
The following sections explain each of these strategies in more detail.
Distributing the amount of data across nodes
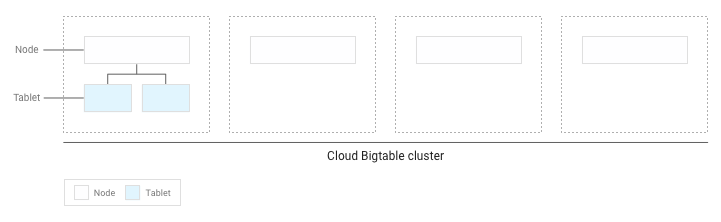
As you write data to a Bigtable table, Bigtable shards the table's data into tablets. Each tablet contains a contiguous range of rows within the table.
If you have written less than several GB of data to the table, Bigtable stores all tablets on a single node within your cluster:
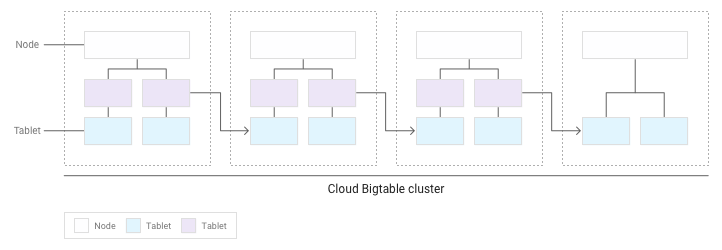
As more tablets accumulate, Bigtable moves some to other nodes in the cluster to balance the amount of data more evenly across the cluster:
Distributing reads and writes evenly across nodes
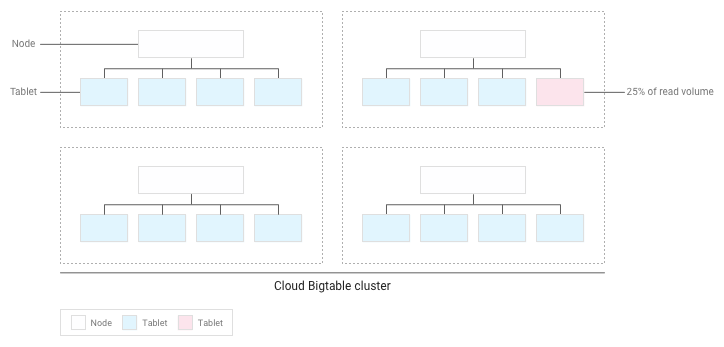
If you've designed your schema correctly, then reads and writes should be distributed fairly evenly across your entire table. However, there are some cases where you can't avoid accessing certain rows more frequently than others. Bigtable helps you deal with these cases by taking reads and writes into account when it balances tablets across nodes.
For example, suppose that 25% of reads go to a small number of tablets within a cluster, and reads are spread evenly across all other tablets:
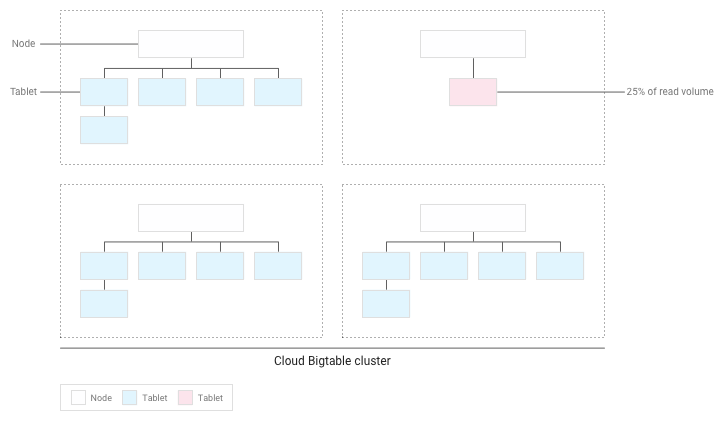
Bigtable will redistribute the existing tablets so that reads are spread as evenly as possible across the entire cluster:
Test performance with Bigtable
If you're running a performance test for an application that depends on Bigtable, follow these guidelines as you plan and execute your test:
- Test with enough data.
- If the tables in your production instance contain a total of 100 GB of data or less per node, test with a table of the same amount of data.
- If the tables contain more than 100 GB of data per node, test with a table containing at least 100 GB of data per node. For example, if your production instance has one four-node cluster, and the tables in the instance contain a total of 1 TB of data, run your test using a table of at least 400 GB.
- Test with a single table.
- Stay below the recommended storage utilization per node. For details, see Storage utilization per node.
- Before you test, run a heavy pre-test for several minutes. This step allows Bigtable to balance data across your nodes based on the access patterns it observes.
- Run your test for at least 10 minutes. This step lets Bigtable further optimize your data, and it helps ensure that you will test reads from disk as well as cached reads from memory.
Troubleshoot performance issues
If you think that Bigtable might be creating a performance bottleneck in your application, be sure to check all of the following:
- Examine the Key Visualizer scans for your table. The Key Visualizer tool for Bigtable generates new scan data every 15 minutes showing the usage patterns for each table in a cluster. Key Visualizer lets you check whether your usage patterns are causing undesirable results, such as hotspots on specific rows or excessive CPU utilization. For more information, see Use Key Visualizer.
- Comment out the code that performs Bigtable reads and writes. If the performance issue disappears, then you're probably using Bigtable in a way that results in suboptimal performance. If the performance issue persists, the issue is probably not related to Bigtable.
Ensure that you're creating as few clients as possible. Creating a client for Bigtable is a relatively expensive operation. Therefore, you should create the smallest possible number of clients:
- If you use replication, or if you use app profiles to identify different types of traffic to your instance, create one client per app profile and share the clients throughout your application.
- If you don't use replication or app profiles, create a single client and share it throughout your application.
If you're using the HBase client for Java, you create a
Connectionobject rather than a client, so create as few connections as possible.Make sure you're reading and writing many different rows in your table. Bigtable performs best when reads and writes are evenly distributed throughout your table, which helps Bigtable distribute the workload across all of the nodes in your cluster. If reads and writes cannot be spread across all of your Bigtable nodes, performance will suffer.
If you find that you're reading and writing only a small number of rows, you might need to redesign your schema so that reads and writes are more evenly distributed.
Verify that you see approximately the same performance for reads and writes. If you find that reads are much faster than writes, you might be trying to read row keys that don't exist, or a large range of row keys that contains only a small number of rows.
To make a valid comparison between reads and writes, aim for at least 90% of your reads to return valid results. Also, if you're reading a large range of row keys, measure performance based on the actual number of rows in that range, rather than the maximum number of rows that could exist.
Use the right type of write requests for your data. Choosing the optimal way to write your data helps maintain high performance.
Check the latency for a single row. If you observe unexpected latency when sending
ReadRowsrequests, you can check the latency of the first row of the request to narrow down the cause. By default, the overall latency for aReadRowsrequest includes the latency for every row in the request as well as the processing time between rows. If the overall latency is high but the first row latency is low, this suggests that the latency is caused by the number of requests or processing time, rather than by a problem with Bigtable.If you're using the [Bigtable client library for Java] [java-client], you can view the
read_rows_first_row_latencymetric in the Google Cloud console Metrics Explorer after enabling client side metrics.Use a separate app profile for each workload. If you experience performance issues after adding a new workload, create a new app profile for the new workload. Then you can monitor metrics for your app profiles separately to troubleshoot further. See How app profiles work for details on why it's a best practice to use multiple app profiles.
Enable client-side metrics. You can set up client-side metrics to help optimize and troubleshoot performance issues. For example, since Bigtable works best with evenly distributed, high QPS, increased P100 (max) latency for a small percentage of requests does not necessarily indicate a larger performance issue with Bigtable. Client-side metrics can give you insight into which portion of the request lifecycle might be causing latency.
Make sure your application consumes read requests before they time out. If your application processes data during a read stream, you run the risk of the request timing out before you've received all responses from the call. This results in an
ABORTEDmessage. If you see this error, reduce the amount of processing during the read stream.
What's next
- Learn how to design a Bigtable schema.
- Find out how to monitor Bigtable performance.
- Learn how to troubleshoot issues with Key Visualizer.
- View sample code for programmatically adding nodes to a Bigtable cluster.