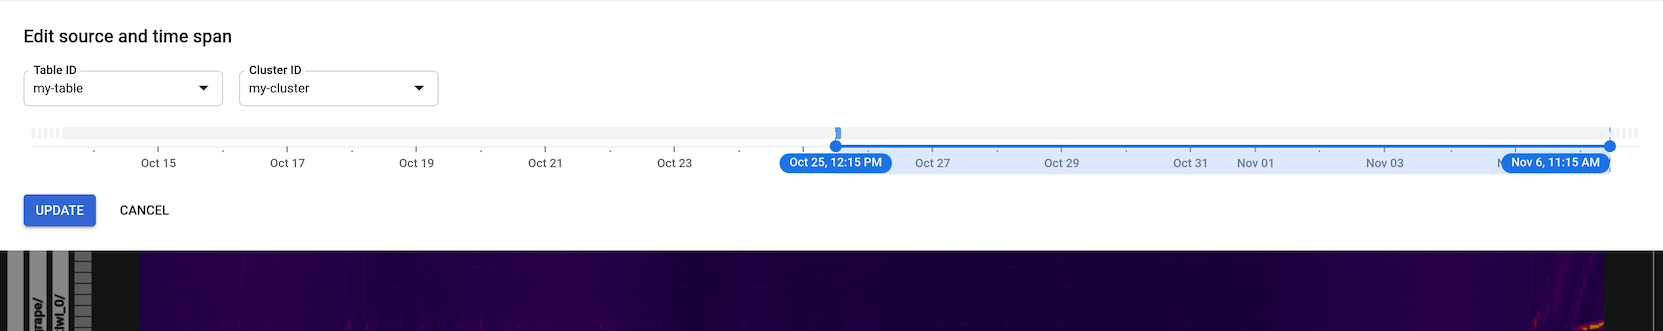
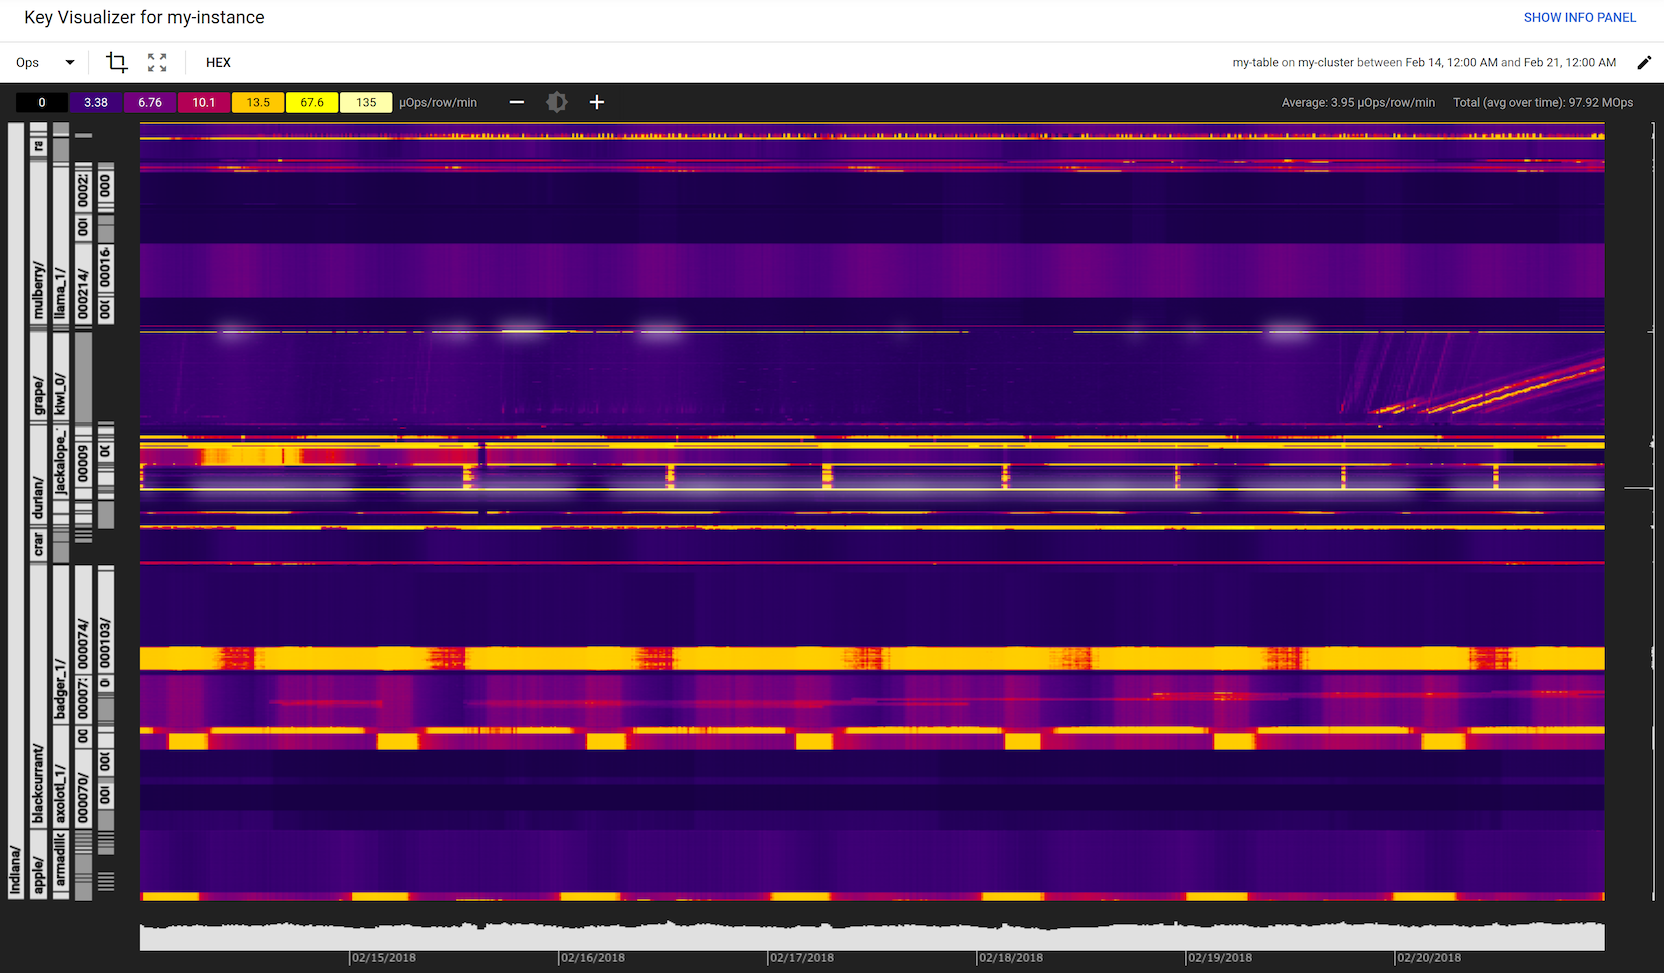
[[["容易理解","easyToUnderstand","thumb-up"],["確實解決了我的問題","solvedMyProblem","thumb-up"],["其他","otherUp","thumb-up"]],[["難以理解","hardToUnderstand","thumb-down"],["資訊或程式碼範例有誤","incorrectInformationOrSampleCode","thumb-down"],["缺少我需要的資訊/範例","missingTheInformationSamplesINeed","thumb-down"],["翻譯問題","translationIssue","thumb-down"],["其他","otherDown","thumb-down"]],["上次更新時間:2025-08-27 (世界標準時間)。"],[[["\u003cp\u003eKey Visualizer helps identify performance issues related to Bigtable usage patterns, and it is recommended to run a check at least once.\u003c/p\u003e\n"],["\u003cp\u003eTo use Key Visualizer, navigate to your Bigtable instance in the Google Cloud console, select "Key Visualizer," and choose the table and cluster to visualize.\u003c/p\u003e\n"],["\u003cp\u003eThe Ops metric in Key Visualizer heatmaps shows the number of operations per row per minute, helping to identify significant differences in usage patterns across different key ranges.\u003c/p\u003e\n"],["\u003cp\u003eWarnings metrics such as Read pressure index, Write pressure index, and Large rows indicate potential performance problems, and high values often suggest the need for schema or application adjustments.\u003c/p\u003e\n"],["\u003cp\u003eIf no major warnings or unexpected patterns are found after an initial check, you can stop using Key Visualizer; otherwise, further exploration of metrics and key ranges is advised.\u003c/p\u003e\n"]]],[],null,["# Use Key Visualizer\n==================\n\nThis page describes how to use Key Visualizer to check for performance issues\nthat are related to your Bigtable usage patterns. If you haven't used\nKey Visualizer before, it's a good idea to complete this check at least once.\n\n\nBefore you read this page, you should be familiar with the\n[overview of Key Visualizer](/bigtable/docs/keyvis-overview).\n\nView a scan for a time period\n-----------------------------\n\n\nKey Visualizer is available for tables that contain at least 1 GB of data per cluster. It can\ntake up to an hour after a table reaches that size for scans to be available.\n\n\u003cbr /\u003e\n\nTo launch Key Visualizer:\n\n1.\n Open the list of Bigtable instances in the Google Cloud console.\n\n\n [Open the instance list](https://console.cloud.google.com/bigtable/instances)\n2.\n Click the instance whose metrics you want to view.\n\n3. In the left-hand navigation pane, click **Key Visualizer**.\n\n4. Choose the table and cluster you wish to visualize, then click **Select**.\n\n Key Visualizer opens and displays data for the time period beginning the\n last time the table's [key buckets were recalculated](/bigtable/docs/keyvis-overview#key-buckets)\n and ending at the current time.\n\nTo change the time period:\n\n1. Select **Resource** \\\u003e **Key Visualizer**.\n\n2. Use the slider paddles to select the start and end time for the time span\n you want to see a heatmap for.\n\n When you release the paddles, they \"snap\" to the nearest available time.\n\n3. Click **Update**.\n\n Depending on the time span length, it may take a few moments for the\n data to load.\n\nAs you review the scan, keep in mind that Key Visualizer heatmaps group metrics\ninto key buckets, or contiguous ranges of rows, rather than showing metrics for\neach individual row. See [Key buckets](/bigtable/docs/keyvis-overview#key-buckets) for details.\n\nIf you want to compare metrics or look for data correlations, you can display\nseveral Key Visualizer metrics together at the same time for the scan you've\nchosen. See [Finding connections between different metrics](/bigtable/docs/keyvis-exploring-heatmaps#finding-connections) for instructions.\n\nCheck for performance issues\n----------------------------\n\nThe following sections explain how to complete an initial check for performance\nissues.\n\n### View an activity overview\n\nAs a first step, review the heatmap for the **Ops** metric, which measures the\nnumber of operations per row per minute. This metric is roughly equal to the\ncombined number of reads and writes. Key Visualizer shows this metric by default\nwhen you open a heatmap.\n\nThe following example shows a heatmap where there are major differences in the\nusage pattern for different key ranges:\n\n- Ranges shown in dark colors have little or no activity.\n- Ranges in bright colors have significantly more activity.\n- The glowing white range in the middle has very high activity.\n\nIn the example, some of these patterns repeat every 24 hours, possibly because a\nlarge batch job runs every day at the same time.\n\nAs you look at the heatmap for the **Ops** metric, keep in mind that brightly\ncolored areas do not necessarily indicate poor performance. In many cases,\nBigtable can perform well even if reads and writes are not\nperfectly balanced across a table.\n\n### Review Warnings metrics\n\nThe presence of **Warnings** metrics usually indicates that there is a\nperformance issue. For **Warnings** metrics, Key Visualizer provides details\nabout the row keys or key ranges that caused the metric to appear. [Learn more\nabout the **Warnings** metrics](/bigtable/docs/keyvis-metrics#warnings).\n\nIf any of the **Warnings** metrics include high values, a diagnostic message\nappears above the heatmap to identify the issue. [Learn more about diagnostic\nmessages](/bigtable/docs/keyvis-diagnostics).\n\nTo review a **Warnings** metric, find the **Metric** drop-down list above the\nheatmap, then select one of the following metrics:\n\n- **Read pressure index**\n- **Write pressure index**\n- **Large rows**\n\nIf an item in this list is disabled, there are no warnings in that category.\nOtherwise, you should view the metric and drill down into the issue that it\nidentifies. See [exploring heatmaps](/bigtable/docs/keyvis-exploring-heatmaps) for details.\n\nIf the heatmap shows only low values for a **Warnings** metric, or if there are\nhigh values that occur for less than 30 minutes, it's likely that you do not\nneed to take any action. If you see high values for long periods of time, it's a\ngood idea to investigate further.\n\nIf the **Read pressure index** metric for a key bucket is 100 or greater for a\nlong period of time, you can take the following actions to lower the index:\n\n- Use [filters](/bigtable/docs/filters) to reduce the amount of data that you read.\n- Change your [schema design](/bigtable/docs/schema-design) or your application so that the data in a heavily used row, or in an excessively large row, is spread across multiple rows.\n- Update your application to cache the results of reads from Bigtable.\n\nIf the **Write pressure index** metric for a key bucket is 100 or greater for a\nlong period of time, you can take the following actions to lower the index:\n\n- Change your [schema design](/bigtable/docs/schema-design) or your application so that the data in a heavily used row, or in an excessively large row, is spread across multiple rows.\n- Update your application to batch and deduplicate writes to Bigtable.\n\nIf the **Large rows** metric is present for a key bucket, examine the rows in\nthe highlighted key bucket, then change your [schema design](/bigtable/docs/schema-design) or\nyour application so that less data is stored in those rows.\n\nContinue your investigation\n---------------------------\n\nIf you complete the initial check for performance issues, and you don't see any\nmajor warnings or unexpected access patterns, you can close Key Visualizer and\nmove on. Otherwise, continue your investigation by looking at other metrics and\nfocusing more closely on key ranges that might be causing problems. [Learn\nmore](/bigtable/docs/keyvis-exploring-heatmaps).\n\nWhat's next\n-----------\n\n- Learn to recognize [common patterns in heatmaps](/bigtable/docs/keyvis-patterns).\n- Find out how to [explore a heatmap in depth](/bigtable/docs/keyvis-exploring-heatmaps).\n- Read about the [metrics you can view in a heatmap](/bigtable/docs/keyvis-metrics).\n- Understand the [diagnostic messages that Key Visualizer can\n display](/bigtable/docs/keyvis-diagnostics)."]]