Cloud Monitoring provides a dashboard that summarizes all your services, the Services Overview dashboard. The Services Overview dashboard is also the entry point for other service-monitoring tasks.
This page describes the summary information on the Services Overview dashboard of the Google Cloud console. From this dashboard, you can do the following:
See the status of your services, and drill down into any one for additional details.
Modify the configuration of services:
- For services on Cloud Service Mesh, Istio on Google Kubernetes Engine, and App Engine, you can define service-level objectives (SLOs) using standard availability and latency metrics.
- For custom services, you can do the following:
- Create new custom services.
- Identify metrics to act as service-level indicators (SLIs).
- Define SLOs based on those SLIs.
- Set up alerting policies to notify you when performance does not meet the SLOs.
For information on configuration tasks, see the following:
You can also use the Monitoring API to manage services programmatically. For more information, see Using the API.
Before you begin
To understand service monitoring, you need to be familiar with concepts like service-level indicators (SLIs), SLOs, error budgets, and SLO-based alerting policies. These concepts are described on other pages, for example:
For an introduction to SLIs, SLOs and error budgets, see Concepts in service monitoring.
For an introduction to SLO-based alerting policies, see Alerting on your burn rate.
Services Overview dashboard
The Services Overview dashboard provides a summary view of all the services in your project, including basic information about the health of those services.
In the Google Cloud console, go to the
![]() SLOs page:
SLOs page:
If you use the search bar to find this page, then select the result whose subheading is Monitoring.
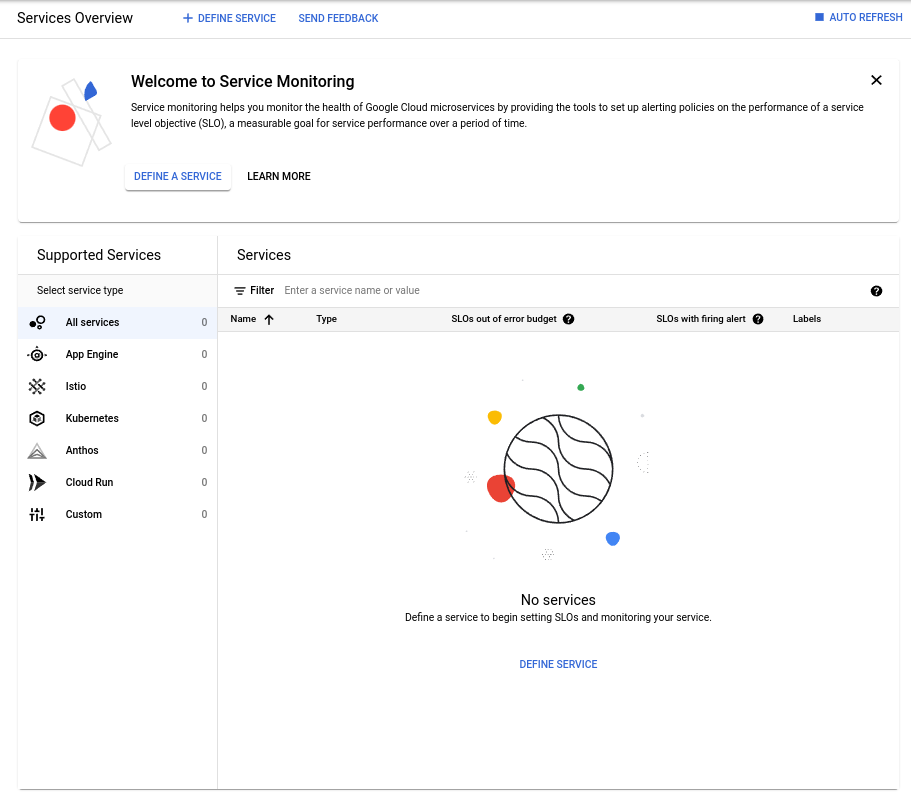
If you have not yet created any services, then the Services Overview provides a welcome message and an empty list of services:
After you have created services, the Services Overview page includes the following information:
A Current status summary that displays an overview of the status of of your services. This region is described in Summary of services.
An inventory table, Services, that displays information about each service. By default, the table shows all services, but you can filter the table so that it shows particular groups of services. The information in this table is described in Inventory table.
A Supported Services list that classifies your defined services into categories. You can use this list to limit what is displayed in the the Services table. When you select a service type in the list, the table shows only the services of that type.
Summary of services
The summary card displays the number of services and provides information about their health and configuration:
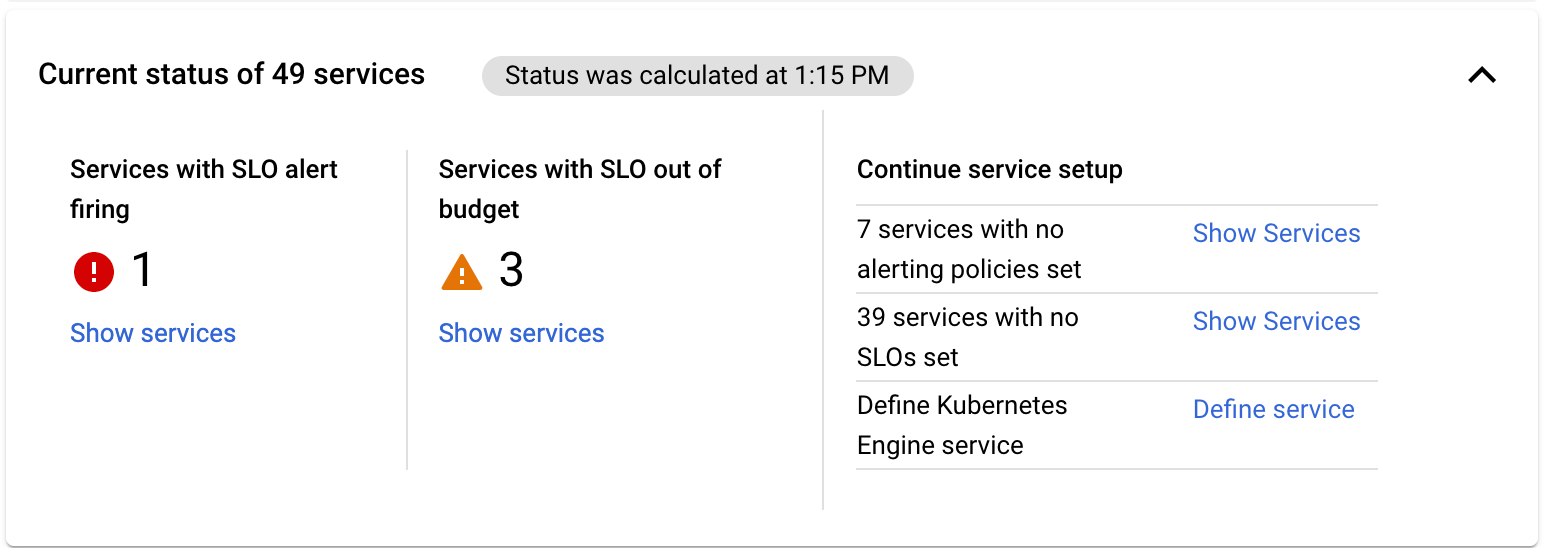
The information displayed on the summary card includes the following:
- The number of services found.
- A timestamp indicating when the summary information was collected.
- The number of services with SLO alerts firing.
- The number of services out of SLO budget.
- Services with additional configuration options available.
If there are services with firing SLO alerts or exhausted error budgets, the summary card displays a count and provides a Show services option for those services. Clicking Show services filters the inventory table so that it shows only the affected services.
If there are services without defined SLOs or alerting policies, the summary card describes them and provides a Show Services option. Clicking Show Services filters the inventory table so that it shows only those services. The summary card then provides a Learn more option that describes SLOs or alerting policies.
If you have GKE entities with no associated custom services, the summary card provides a Define Service option. For more information, see Defining a microservice.
Inventory table
The Services Overview inventory table includes a row for each service, as shown in the following screenshot:
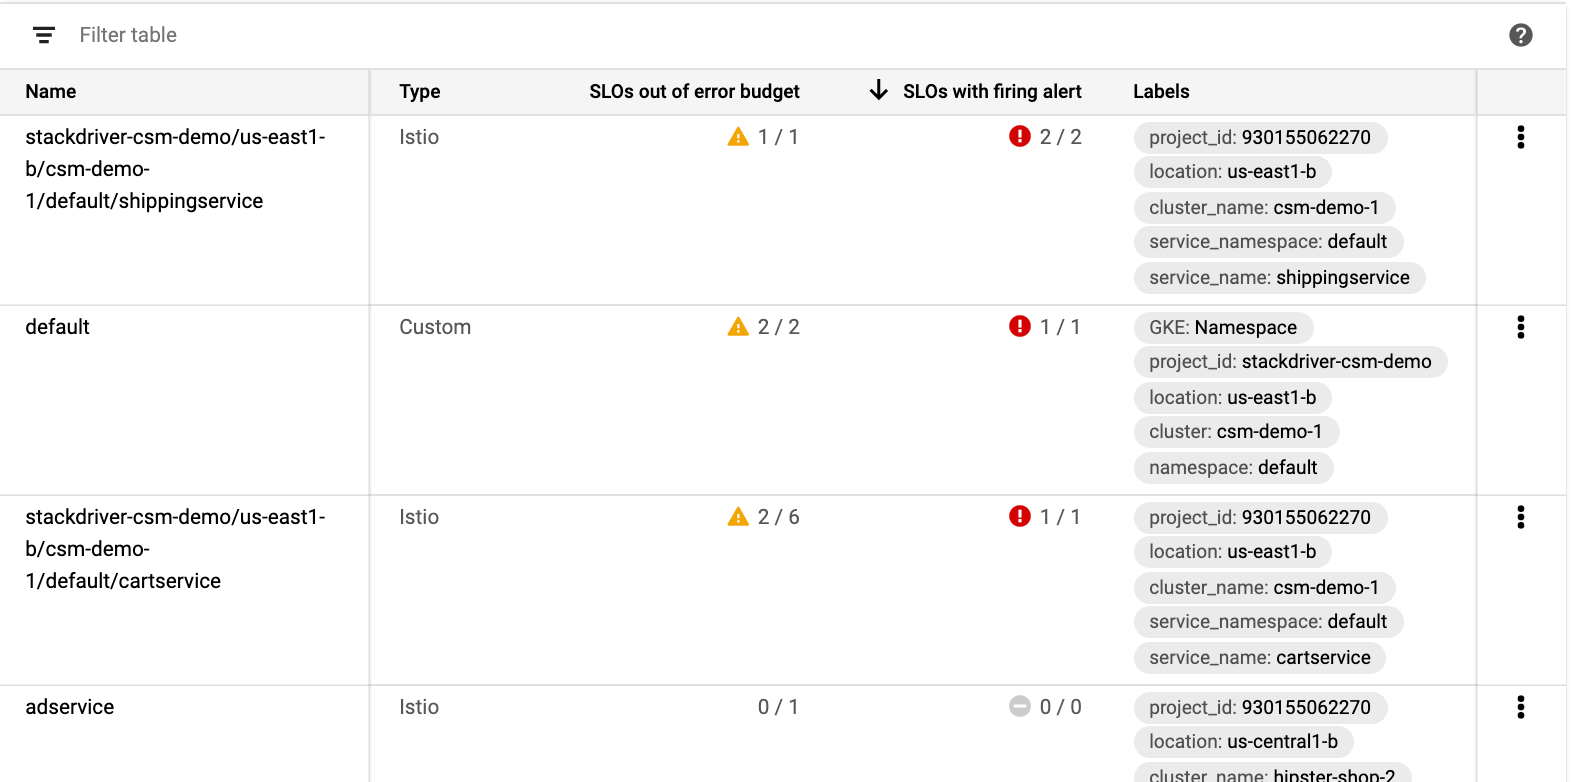
The inventory table provides the following information for each service listed in the table:
Name: The display name of the service.
Clicking on the name of a service brings up a dashboard for that service. For more information, see Using microservice dashboards.
Type: One of the following values:
Istio: an automatically detected Istio on Google Kubernetes Engine or Cloud Service Mesh service.App Engine: an automatically detected App Engine service.Custom: a GKE service.
SLOs out of error budget: The ratio of out-of-budget SLOs to the total SLO count. Services with out-of-budget SLOs are also badged to make them stand out in the table.
SLOs with firing alert: The ratio of alerting policies that are firing to the total count of alerting policies. Services with firing policies are also badged to make them stand out in the table.
Labels: Information about the service. The types of information displayed varies with the type of service.
more_vert More options: Lists changes you can make to the service. The choices depend on the service type:
- Edit display name: available for all service types.
- Delete service: available only for custom services.
By default, the inventory table includes all the services in your project, but you can filter the table to reduce the number of entries. You can filter the table from options on the summary card as described in Summary of services, or you can filter the table directly.
Filtering the inventory table
You can filter the inventory table in the following ways:
By clicking one of the service-type entries in the Supported Services list.
By clicking one of the Show services options in the summary card, as described in Summary of services.
By manually adding filters to the inventory table.
To manually add a filter to the inventory table, do the following:
Click filter_list Filter. A list of filter options is displayed:
- Name: filter by SLO name.
- Type: filter by SLO type.
- Labels: filter by value of service labels.
- SLO count: filter by number of SLOs configured.
- SLO alerts policies count: filter by number of SLO-based alerting policies configured.
Choose one of the options off the filter list. The chosen option appears in the filter bar.
How you complete the filter varies with the option you select:
If you select Type, you then get a list of the available service types. Select a type from the list.
If you select Name or Labels, then click next to the text in the filter bar and start typing. Values that match are provided on a list. Select a value from the list.
If you select SLO count or SLO alert policies count, you then get a list of comparison operators to choose from.
- Select an operator.
- Click next to the operator and enter a comparison value.
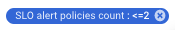
The completed filter is replaced by a filter chip. For example, the following chip filters for services that have 2 or fewer SLO-based alerting policies configured:
You can add multiple filters by repeating this process.
After you add one filter, the filter-options menu also includes an OR option
for evaluating the filters. By default, services must meet a logical AND of
all the filters to appear on the table.
To remove a filter, click the close on the filter chip.
What's next?
For information on service-configuration tasks, see the following:
For information on per-service dashboards, see Using microservice dashboards.