This document describes how can use the Ops Agent and the OpenTelemetry Protocol (OTLP) receiver to collect user-defined metrics and traces from applications instrumented by using OpenTelemetry and running on Compute Engine.
This document is organized as follows:
- An overview that describes the use cases for the OTLP receiver.
- Prerequisites for using the OTLP receiver.
- Configuring the agent to use the OTLP receiver.
- Using the receiver to collect metrics. This section describes how to query your OpenTelemetry metrics in Cloud Monitoring.
- Using the receiver to collect traces. This section describes how to authorize a service account to write data to Cloud Trace.
Overview of using the OTLP receiver
With the Ops Agent OTLP receiver, you can do the following:
- Instrument your application by using one of the language-specific SDKs for
OpenTelemetry. For information about the supported languages, see OpenTelemetry
Instrumentation. The combination
of OpenTelemetry SDKs and the Ops Agent do the following for you:
- Collect OTLP metrics from your application and send those metrics to Cloud Monitoring for analysis.
- Collect OTLP spans—trace data—from your application and then send those spans to Cloud Trace for analysis.
- Collect traces from third-party applications that have built-in support for OTLP or plugins with such support, applications such as Nginx. The OTLP receiver in the Ops Agent can collect those traces. For an example, see OpenTelemetry nginx module.
- Use OpenTelemetry custom instrumentation.
- Use OpenTelemetry automatic instrumentation.
You can use the receiver to collect metrics, traces, or both. After the Ops Agent has collected your metrics, you can use the features of Cloud Monitoring, including charts, dashboards, and alerting policies, to monitor your metrics. If your application also sends trace data, then you can use Cloud Trace to analyze that data.
Benefits
Before the availability of the OTLP plugin for the Ops Agent, the primary ways to instrument your applications to collect user-defined metrics and traces included the following:
- Using client libraries that implement the Monitoring API or the Trace API.
- Using the older OpenCensus libraries.
Using OpenTelemetry with the OTLP receiver has several benefits over these methods, including the following:
- OpenTelemetry is the replacement for OpenCensus. The OpenCensus project is being archived. For more information, see What is OpenTelemetry?.
- Ingestion is controlled at the agent level, so you don't have to redeploy your applications if the agent configuration changes.
- Your applications don't need to set up Google Cloud credentials; all authorization is handled at the agent level.
- Your application code contains no Google Cloud-specific monitoring or tracing code. You don't have to use the Monitoring API or the Trace API directly.
- Your application pushes data to the Ops Agent, and if your application crashes, any data that has been collected by the Ops Agent isn't lost.
Limitations
The OTLP listener exposed by the Ops Agent receiver supports the gRPC transport. HTTP, which is used primarily for JavaScript clients, isn't supported. For more information about the OpenTelemetry Protocol, see Protocol Details.
The OTLP receiver doesn't collect logs. You can collect logs by using the Ops Agent and other receivers and you can include log information in OTLP spans, but the OTLP receiver doesn't support the direct collection of logs. For information about using the Ops Agent to collect logs, see Logging configurations.
Prerequisites
To collect OTLP metrics and traces by using the OTLP receiver and the Ops Agent, you must install the Ops Agent version 2.37.0 or higher.
This document assumes that you already have an OpenTelemetry-based application written by using one of the OpenTelemetry SDKs. This document doesn't cover using OpenTelemetry SDKs. For information about SDKs and the supported languages, see OpenTelemetry Instrumentation.
Configure the Ops Agent
To configure the Ops Agent to use the OTLP receiver, do the following:
- Modify the user configuration file for the Ops Agent to include the OTLP receiver.
- Restart the Ops Agent.
The following sections describe each step.
Modify the Ops Agent user-configuration file
Add the configuration elements for the OTLP receiver to the the user-configuration file for the Ops Agent:
- For Linux:
/etc/google-cloud-ops-agent/config.yaml - For Windows:
C:\Program Files\Google\Cloud Operations\Ops Agent\config\config.yaml
For general information about configuring the agent, see Configuration model.
The OTLP receiver introduces the combined configuration section
for the Ops Agent. Using the receiver requires you to configure services for
metrics and traces, even if you aren't using both of them.
The following sections describe the configuration steps for the OTLP receiver.
Add the combined receiver section
You place the receiver for OTLP metrics and traces in the combined
section. No processors or services are permitted in the combined section.
You must not configure any other receiver with the
same name as a receiver in the combined section. The following example
uses otlp as the name of the receiver.
The minimal combined configuration for OTLP looks like the following:
combined:
  receivers:
    otlp:
      type: otlp
The otlp receiver has the following configuration options:
type: Required. Must beotlpgrpc_endpoint: Optional. The gRPC endpoint on which the OTLP receiver listens. Defaults to0.0.0.0:4317.metrics_mode: Optional. Defaults togooglemanagedprometheus, which means the receiver sends OTLP metrics as Prometheus-formatted metrics by using the Prometheus API also used by Managed Service for Prometheus.To send the metrics as Cloud Monitoring custom metrics by using the Monitoring API instead, set the
metrics_modeoption to the valuegooglecloudmonitoring.This choice affects how your metrics are ingested and how they are measured for billing. For more information about metrics formats, see Ingestion formats for OTLP metrics.
Add OTLP pipelines to your services
The OTLP receiver can collect metrics and traces, so you must define a service for metrics and for traces. If you aren't going to collect either metrics or traces, you can create empty services. If you already have services with other pipelines, you can add the OTLP pipeline to them.
The following shows the metrics and traces services with the OTLP
receiver included in the pipelines:
combined:
  receivers:
    otlp:
      type: otlp
metrics:
  service:
    pipelines:
      otlp:
        receivers: [otlp]
traces:
  service:
    pipelines:
      otlp:
        receivers: [otlp]
If you don't want to use either the metrics or traces service for OTLP
collection, then leave the OTLP receiver out of the pipeline for the service.
The service must exist, even if it has no pipelines. If you application sends
data of a given type and there is no corresponding pipeline that includes the
receiver, then the Ops Agent discards the data.
Restart the Ops Agent
To apply your configuration changes, you must restart the Ops Agent.
Linux
- To restart the agent, run the following command on your instance:
sudo systemctl restart google-cloud-ops-agent
- To confirm that the agent restarted, run the following command and
verify that the components "Metrics Agent" and "Logging Agent" started:
sudo systemctl status "google-cloud-ops-agent*"
Windows
- Connect to your instance using RDP or a similar tool and login to Windows.
- Open a PowerShell terminal with administrator privileges by right-clicking the PowerShell icon and selecting Run as Administrator
- To restart the agent, run the following PowerShell command:
Restart-Service google-cloud-ops-agent -Force
- To confirm that the agent restarted, run the following command and
verify that the components "Metrics Agent" and "Logging Agent" started:
Get-Service google-cloud-ops-agent*
Collect OTLP metrics
When you use the OTLP receiver to collect metrics from your OpenTelemetry applications, the primary configuration choice for the receiver is the API that you want to use to ingest the metrics.
You make this choice by changing the metrics_mode option in the
configuration of the otlp receiver or using the default value.
The choice affects how your OTLP metrics are ingested into
Cloud Monitoring and how that data is measured for billing purposes.
The metrics_mode choice doesn't affect your ability to create charts,
dashboards, and alerting policies in Monitoring.
- For information about creating charts and dashboards, see Dashboards and charts overview.
- For information about alerting policies, see Alerting overview.
The following sections describe differences in the formats used by the metric modes and how to query the ingested data for use in Monitoring.
Ingestion formats for OTLP metrics
The OTLP receiver provides the metrics_mode option, which specifies
the API that is used to ingest your metric data. By default, the receiver
uses the Prometheus API; the default value for the metrics_mode option
is googlemanagedprometheus. The metrics are ingested using the same
API that is used by Managed Service for Prometheus.
You can configure the receiver to send your metric data to the
Cloud Monitoring API instead. To send data to the Monitoring API,
set the value of the metrics_mode option to googlecloudmonitoring, as
shown in the following example:
combined:
  receivers:
    otlp:
      type: otlp
      metrics_mode: googlecloudmonitoring
The ingestion format you use determines how the OTLP metrics are mapped into Cloud Monitoring. You can create charts, dashboards, and alerting policies in Monitoring for metrics of either metric format, but you refer to the metrics differently in queries.
The ingestion format also determines the pricing model used for data ingestion.
The following sections describe pricing, the structural differences between a metric ingested by the Prometheus API and the same metric ingested by the Monitoring API, and how to refer to the metrics in queries.
Pricing and quota
The ingestion format you use determines how the OTLP metrics are charged:
Prometheus API: When you use the Prometheus API to ingest your application's metrics, the data is subject to sample-based pricing, as if the metrics had come in by using Managed Service for Prometheus.
- For current pricing, see Cloud Monitoring pricing summary.
- For more information about counting samples and estimating costs, see Metrics charged by samples ingested.
Monitoring API: When you use the Monitoring API to ingest your application's metrics, the data is subject to volume-based pricing, like data from other integrations with the Ops Agent.
- For current pricing, see Cloud Monitoring pricing summary.
- For more information about ingestion volume and estimating costs, see Metrics charged by bytes ingested.
Metrics ingested by using the OTLP receiver are considered types of "custom" metrics when ingested into Cloud Monitoring and are subject to the quotas and limits for custom metrics.
Metric structure
Cloud Monitoring describes the format of metric data by using a schema called a metric descriptor. The metric descriptor includes the name of the metric, the data type of metric values, how each value is related to prior values, and any labels associated with the values. If you configure the OTLP receiver to ingest metrics by using the Prometheus API, then the metric descriptor that is created differs from the metric descriptor created when you use the Monitoring API.
Prometheus API: When you use the Prometheus API to ingest your application's metrics, each metric is transformed by using the standard OpenTelemetry-to-Prometheus transformation and mapped to a Cloud Monitoring monitored-resource type.
- The transformation includes the following changes:
- The OTLP metric name is prefixed with the string
prometheus.googleapis.com/. - Any non-alphanumeric characters, such as periods (
.), in the OTLP metric name are replaced by underscores (_). - The OTLP metric name is postfixed with a string that indicates the
metric kind, like
/gaugeor/counter.
- The OTLP metric name is prefixed with the string
- The following labels, populated with values from the OTLP resource,
are added to the metric:
instance_name: The value of thehost.nameresource attribute.machine_type: The value of thehost.typeresource attribute.
The monitored resource recorded with the metric measurements is the generic
prometheus_targettype. The generated Prometheus time series includes the following labels from theprometheus_targetresource, populated with values from the OTLP resource:location: The value of thecloud.availability_zoneresource attribute.namespace: The value of thehost.idresource attribute.
The
prometheus_targetresource type also includes these labels:project_id: The identifier of the Google Cloud project, likemy-project, in which the Ops Agent is running.cluster: The value is always__gce__when metrics are collected by the Ops Agent.
If the incoming OTLP data is missing the resource attributes used for label values, then the values are taken from information about the VM running the Ops Agent. This behavior means that OTLP data without these resource attributes appears with the same labels as data collected by the Ops Agent Prometheus receiver.
Monitoring API: When you use the Monitoring API to ingest your application's metrics, each metric is handled as follows:
- The OTLP metric name is prefixed with the string
workload.googleapis.com/, unless the OTLP metric name already contains this string or another valid metric domain, likecustom.googleapis.com. We recommend using the "workload" domain. - The monitored resource recorded with the metric measurements is
the Compute Engine virtual-machine type
gce_instance.
The following examples show the metric descriptors for a pair of OpenTelemetry
metrics. The metrics are created by an application that uses the
Go OpenTelemetry metrics library.
The Prometheus API tab shows the
metric descriptor created when the OTLP receiver uses the default
Prometheus metrics mode. The Monitoring API tab shows the
metric descriptor created when the OTLP receiver uses the
googlecloudmonitoring metric mode.
Nothing changes in the application that creates the metric; the only change is the metric mode used by the OTLP receiver.
The application creates an OTLP gauge metric, otlp.test.gauge, that
records 64-bit floating-point values.
The following tabs show the metric descriptor that each ingestion API creates:
Prometheus API
{
  "name": "projects/PROJECT_ID/metricDescriptors/prometheus.googleapis.com/otlp_test_gauge/gauge",
  "labels": [
    {
      "key": "instance_name"
    },
    {
      "key": "machine_type"
    }
  ],
  "metricKind": "GAUGE",
  "valueType": "DOUBLE",
  "type": "prometheus.googleapis.com/otlp_test_gauge/gauge",
  "monitoredResourceTypes": [
    "prometheus_target"
  ]
}
Monitoring API
{
  "name": "projects/PROJECT_ID/metricDescriptors/workload.googleapis.com/otlp.test.gauge",
  "labels": [
    {
      "key": "instrumentation_source"
    }
  ],
  "metricKind": "GAUGE",
  "valueType": "DOUBLE",
  "type": "workload.googleapis.com/otlp.test.gauge",
  "monitoredResourceTypes": [
    "gce_instance",
    ...many other types deleted...
  ]
}
The application creates an OTLP counter metric, otlp.test.cumulative,
that records increasing 64-bit floating-point values.
The following tabs show the metric descriptor that each ingestion API creates:
Prometheus API
{
  "name": "projects/PROJECT_ID/metricDescriptors/prometheus.googleapis.com/otlp_test_cumulative/counter",
  "labels": [
    {
      "key": "instance_name"
    },
    {
      "key": "machine_type"
    }
  ],
  "metricKind": "CUMULATIVE",
  "valueType": "DOUBLE",
  "type": "prometheus.googleapis.com/otlp_test_cumulative/counter",
  "monitoredResourceTypes": [
    "prometheus_target"
  ]
}
Monitoring API
{
  "name": "projects/PROJECT_ID/metricDescriptors/workload.googleapis.com/otlp.test.cumulative",
  "labels": [
    {
      "key": "instrumentation_source"
    }
  ],
  "metricKind": "CUMULATIVE",
  "valueType": "DOUBLE",
  "type": "workload.googleapis.com/otlp.test.cumulative",
  "monitoredResourceTypes": [
    "gce_instance",
    ...many other types deleted...
  ]
}
The following table summarizes some of the format differences imposed by the APIs used to ingest OTLP metrics:
| Prometheus API | Monitoring API | |
|---|---|---|
| Metric domain | prometheus.googleapis.com |
workload.googleapis.com |
| OTLP metric name | Modified during ingestion | Used as provided |
| Monitored resource |
prometheus_target |
gce_instance |
Ingestion formats and queries
The metrics mode used in the OTLP receiver affects the way you query the resulting metrics in Cloud Monitoring when you build charts, dashboards, and alerting policies.
When you configure a chart, dashboard, or alerting policy in Cloud Monitoring, the configuration includes a query for the data on which the chart, dashboard, or alerting policy operates.
Cloud Monitoring supports the following tools for querying metric data:
- A query-builder based interface built into tools like Metrics Explorer, the dashboard-builder interface, and the alert-policy configuration interface.
- Prometheus Query Language (PromQL): The text-based query language used by open source Prometheus.
For information about querying OTLP metrics by using these tools, see the following:
- Query OTLP metrics ingested by using the Prometheus API
- Query OTLP metrics ingested by using the Monitoring API
Query OTLP metrics ingested by using the Prometheus API
This section illustrates how you query OTLP metrics ingested by using the Prometheus API, which is the default metric mode for the OTLP receiver.
The queries are based on the OTLP metrics described in Metric structure:
otlp.test.gauge: An OTLP gauge metric that records 64-bit floating-point values.otlp.test.cumlative: An OTLP counter metric that records increasing 64-bit floating-point values.
These metrics are ingested into Cloud Monitoring with the following metric types, which function as names:
prometheus.googleapis.com/otlp_test_gauge/gaugeprometheus.googleapis.com/otlp_test_cumulative/counter
Metrics ingested by using the Prometheus API are written against the
monitored-resource type prometheus_target.
The tabs show what basic queries look like when query the metrics by using the Google Cloud console. These examples use Metrics Explorer, but the principles are the same for dashboards and alerting policies.
Query-builder interface
To use a query-builder interface to query metric data, you specify the metric type and the monitored-resource type by typing into search-enabled fields. There are far fewer resource types than metric types, so it's usually most efficient to search for the resource type and then use the menu of associated metrics to find the metric type.
If you enter "prometheus" in the search field, the results include the
prometheus_target monitored resource, shown by the display name "Prometheus
Target", and the set of metrics that write to the resource. The metrics are
categorized by name; the two example metrics appear as the Otlp category.
You can select Prometheus/otlp_test_cumulative/counter or
Prometheus/otlp_test_gauge/gauge.
For more information about using the query builder, see Build queries by using menus.
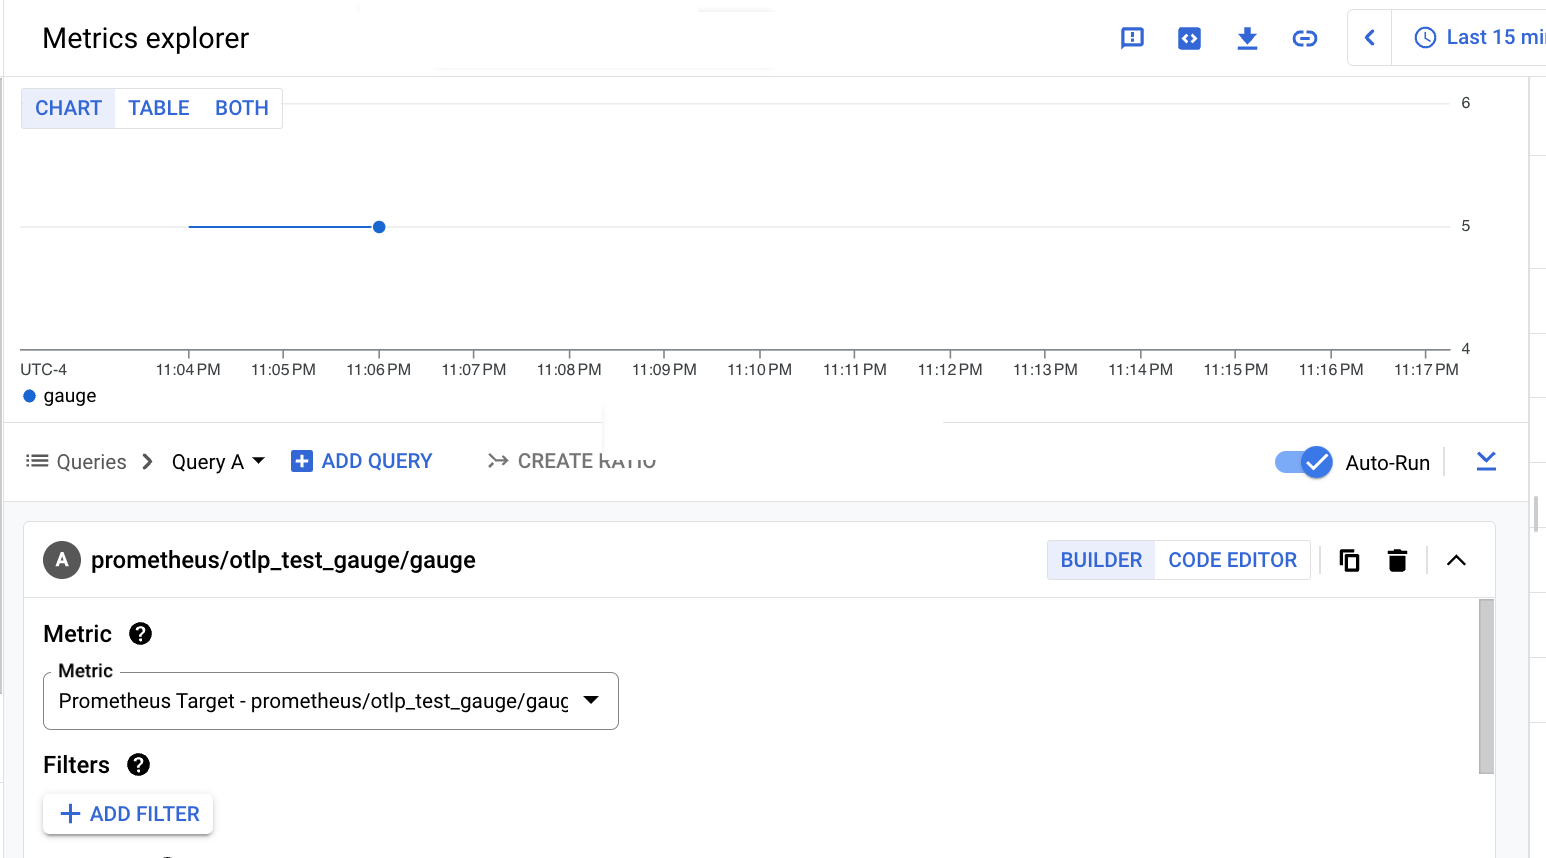
The following screenshot shows the result of querying the
prometheus.googleapis.com/otlp_test_gauge/gauge metric:
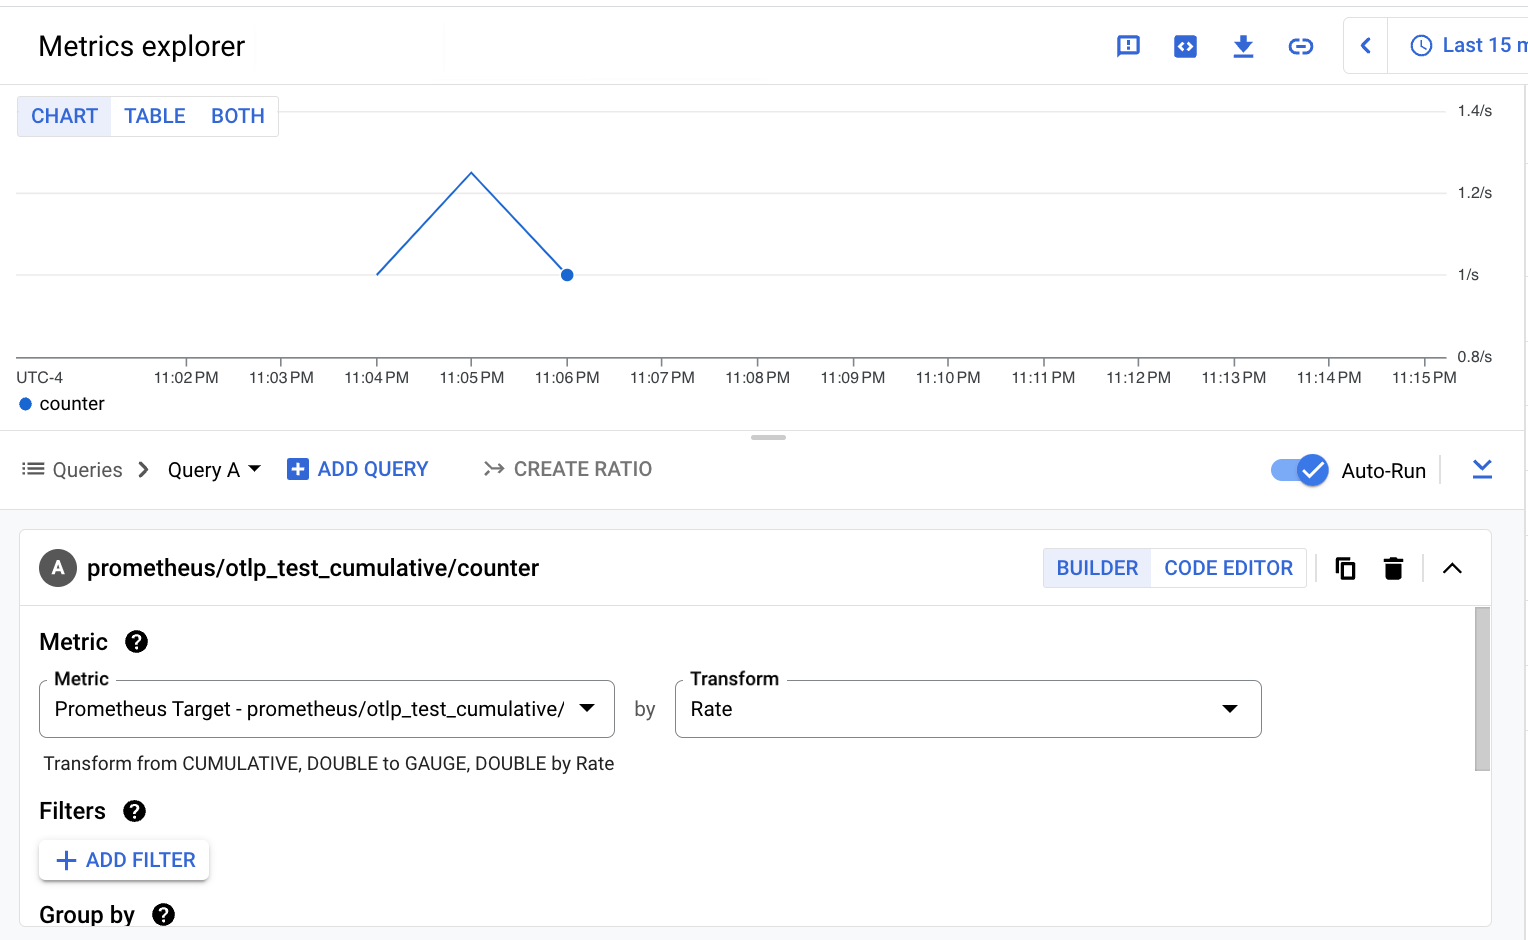
The following screenshot shows the result of querying the
prometheus.googleapis.com/otlp_test_cumulative/counter metric:
PromQL
When you use PromQL to query metric data that was ingested by using the
Prometheus API, you need only specify the modified form of the original OTLP
metric name. You don't need to specify the prefixed
prometheus.googleapis.com/ string or the postfixed type.
When the metric can be written against only one monitored-resource type,
you don't need to specify the resource. As described in Metric
structure, OTLP metrics ingested by using
the Prometheus API are written only against the
prometheus_target monitored-resource type.
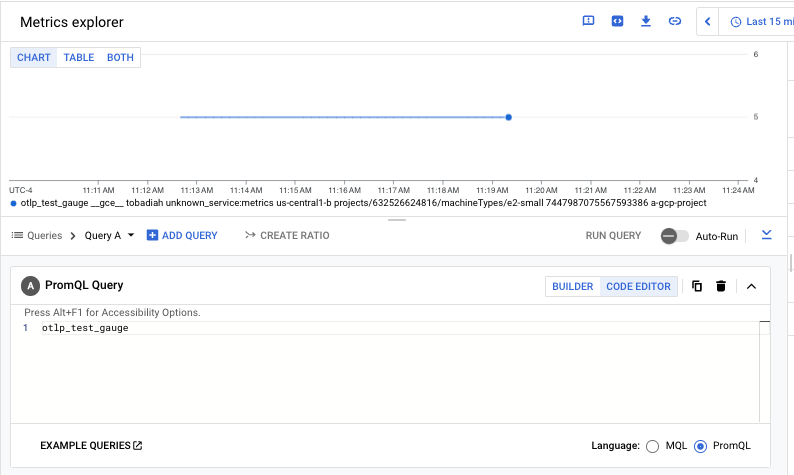
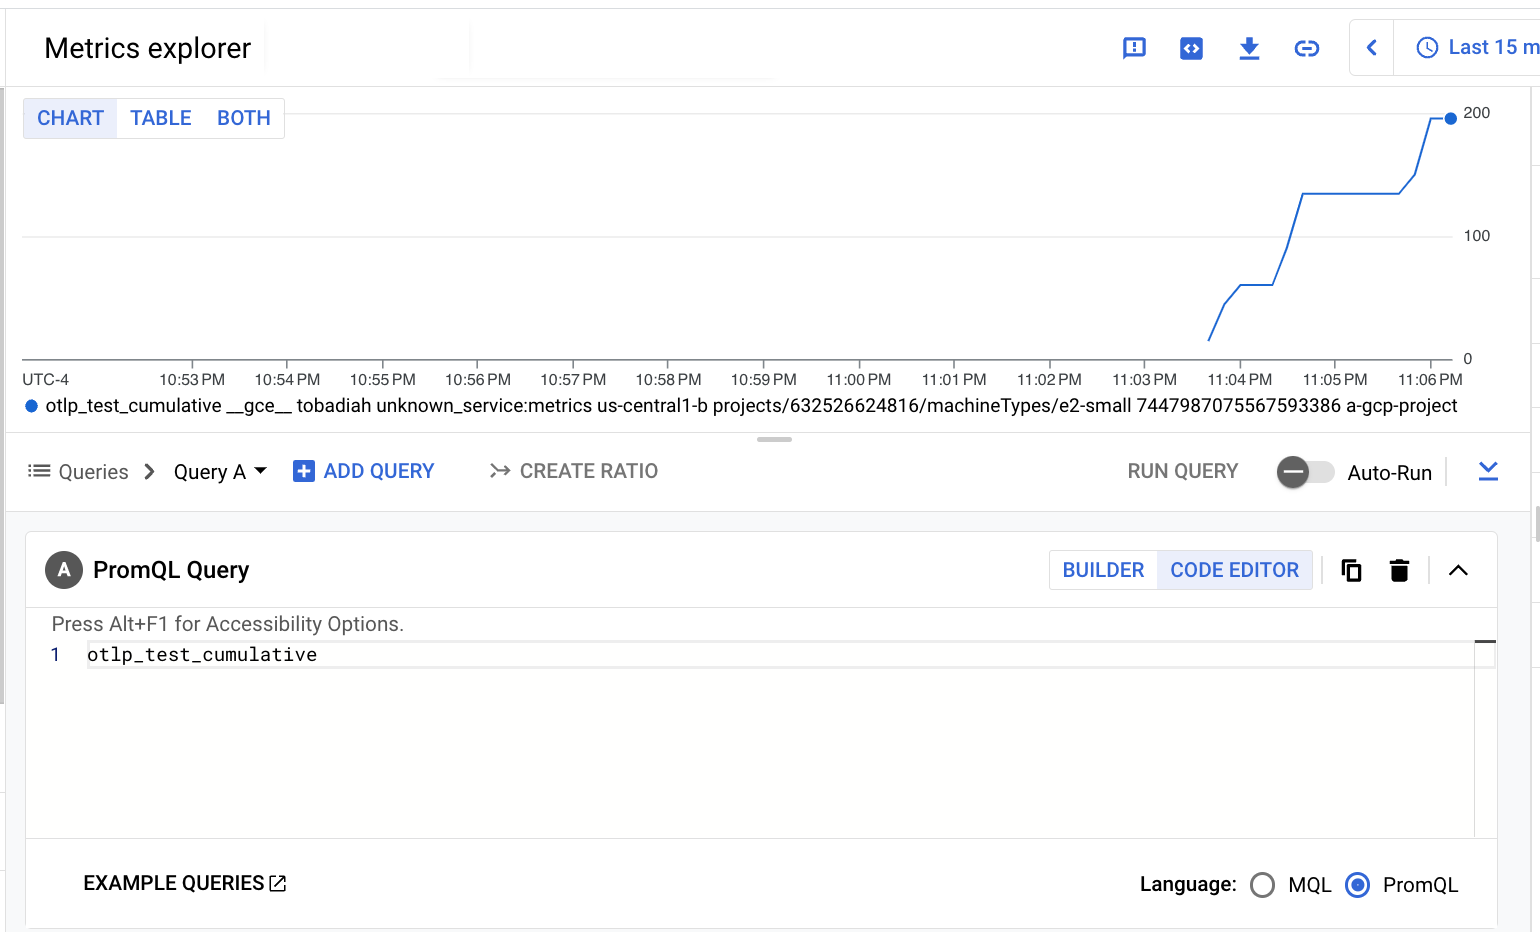
Trivial PromQL queries for the example metrics look like the following:
otlp_test_gaugeotlp_test_cumulative
For more information about using PromQL in Cloud Monitoring to query metrics ingested by using the Prometheus API, see Google Cloud Managed Service for Prometheus data in Cloud Monitoring. For information about the PromQL language, see Querying Prometheus.
The following screenshot shows the result of querying the
prometheus.googleapis.com/otlp_test_gauge/gauge metric:
The following screenshot shows the result of querying the
prometheus.googleapis.com/otlp_test_cumulative/counter metric:
Query OTLP metrics ingested by using the Monitoring API
This section illustrates how you query OTLP metrics ingested by using the
Monitoring API. You select the Cloud Monitoring API by setting
the metrics_mode field of the OTLP receiver to the value
googlecloudmonitoring.
The queries are based on the OTLP metrics described in Metric structure:
otlp.test.gauge: An OTLP gauge metric that records 64-bit floating-point values.otlp.test.cumlative: An OTLP counter metric that records increasing 64-bit floating-point values.
These metrics are ingested into Cloud Monitoring with the following metric types, which function as names:
workload.googleapis.com/otlp.test.gaugeworkload.googleapis.com/otlp.test.cumulative
Metrics ingested by using the Monitoring API are written against the
monitored-resource type gce_instance.
The tabs show what basic queries look like when query the metrics by using the Google Cloud console. These examples use Metrics Explorer, but the principles are the same for dashboards and alerting policies.
Query-builder interface
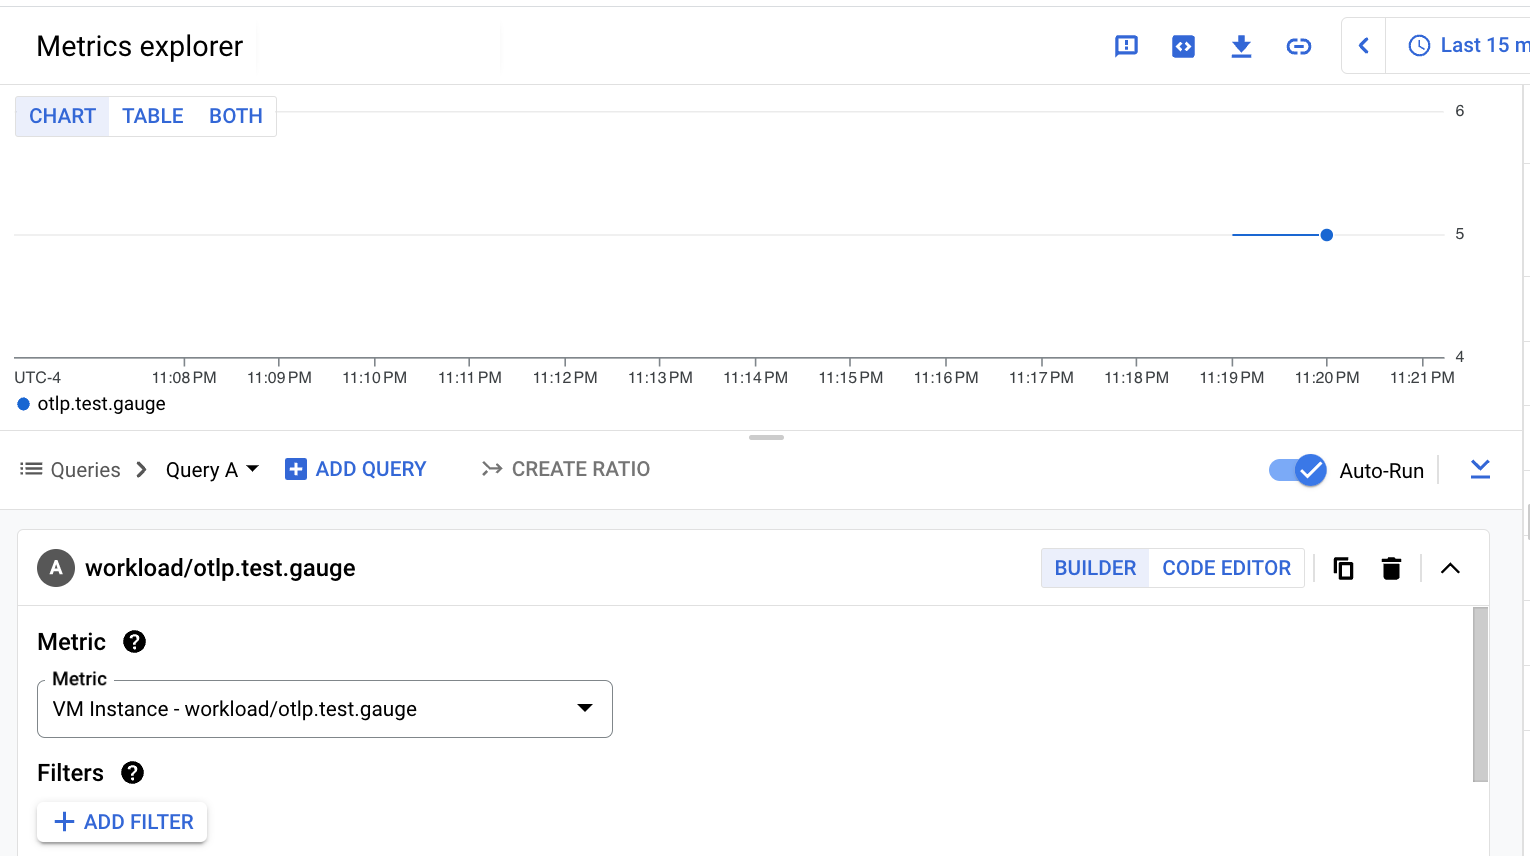
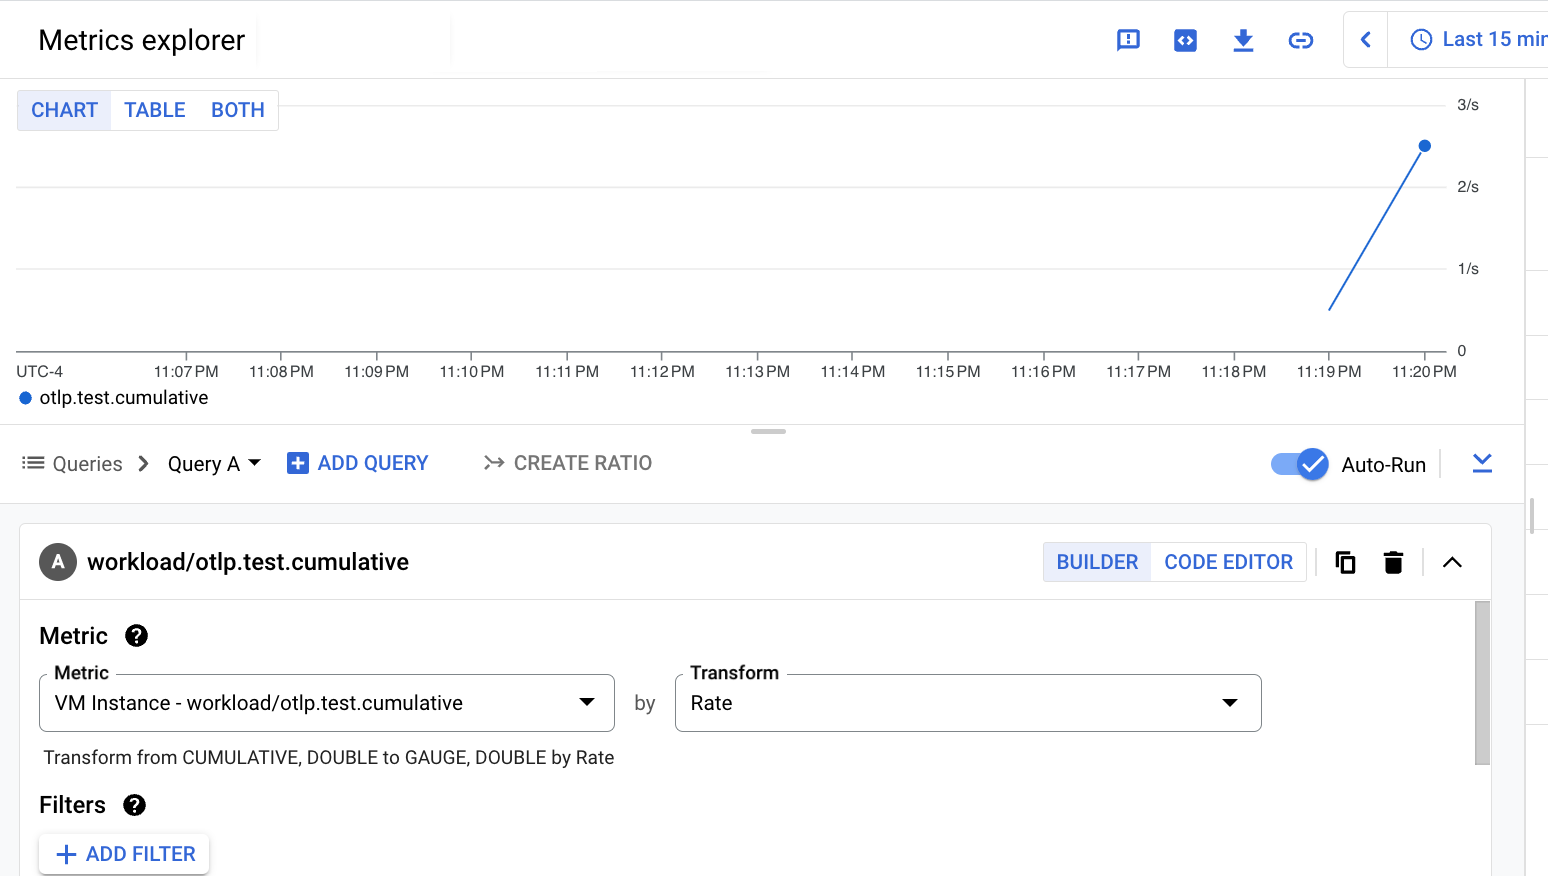
To use a query-builder interface to query metric data, you specify the metric type and the monitored-resource type by typing into search-enabled fields. There are far fewer resource types than metric types, so it's usually most efficient to search for the resource type and then use the menu of associated metrics to find the metric type.If you enter "gce_instance" in the search field, the results show the resource type by its display name, "VM Instance", and the set of metrics that write to the resource. The metrics are categorized by name; the two example metrics appear as the Otlp category. You can select Workload/otlp_test_cumulative or Workload/otlp_test_gauge.
For more information about using the query builder, see Build queries by using menus.
The following screenshot shows the result of querying the
workload.googleapis.com/otlp.test.gauge metric:
The following screenshot shows the result of querying the
workload.googleapis.com/otlp.test.cumulative metric:
PromQL
When you use PromQL to query metric data that was ingested by using the Monitoring API, you have to map the metric name to PromQL conventions. The basic mapping rules include the following:
- Replace the first
/with:. - Replace all other special characters (including
.and other/characters) with_.
For more information about the mapping rules, see Mapping Cloud Monitoring metrics to PromQL.
The Monitoring metric types for the example metrics are mapped to PromQL as follows:
workload_googleapis_com:otlp_test_gaugeworkload_googleapis_com:otlp_test_cumulative
When the metric can be written against only one monitored-resource type,
you don't need to specify the resource. The example metrics are written
against the gce_instance monitored-resource type,
but as described in Metric structure, gce_instance
is only one of the possible metric types. Therefore, the PromQL
queries for these metrics must include a filter for the gce_instance
resource type. To include the filter, add the following string to the
end of the mapped metric names: {monitored_resource="gce_instance"}
For more information about using PromQL in Cloud Monitoring, see PromQL in Cloud Monitoring. For information about the PromQL language, see Querying Prometheus.
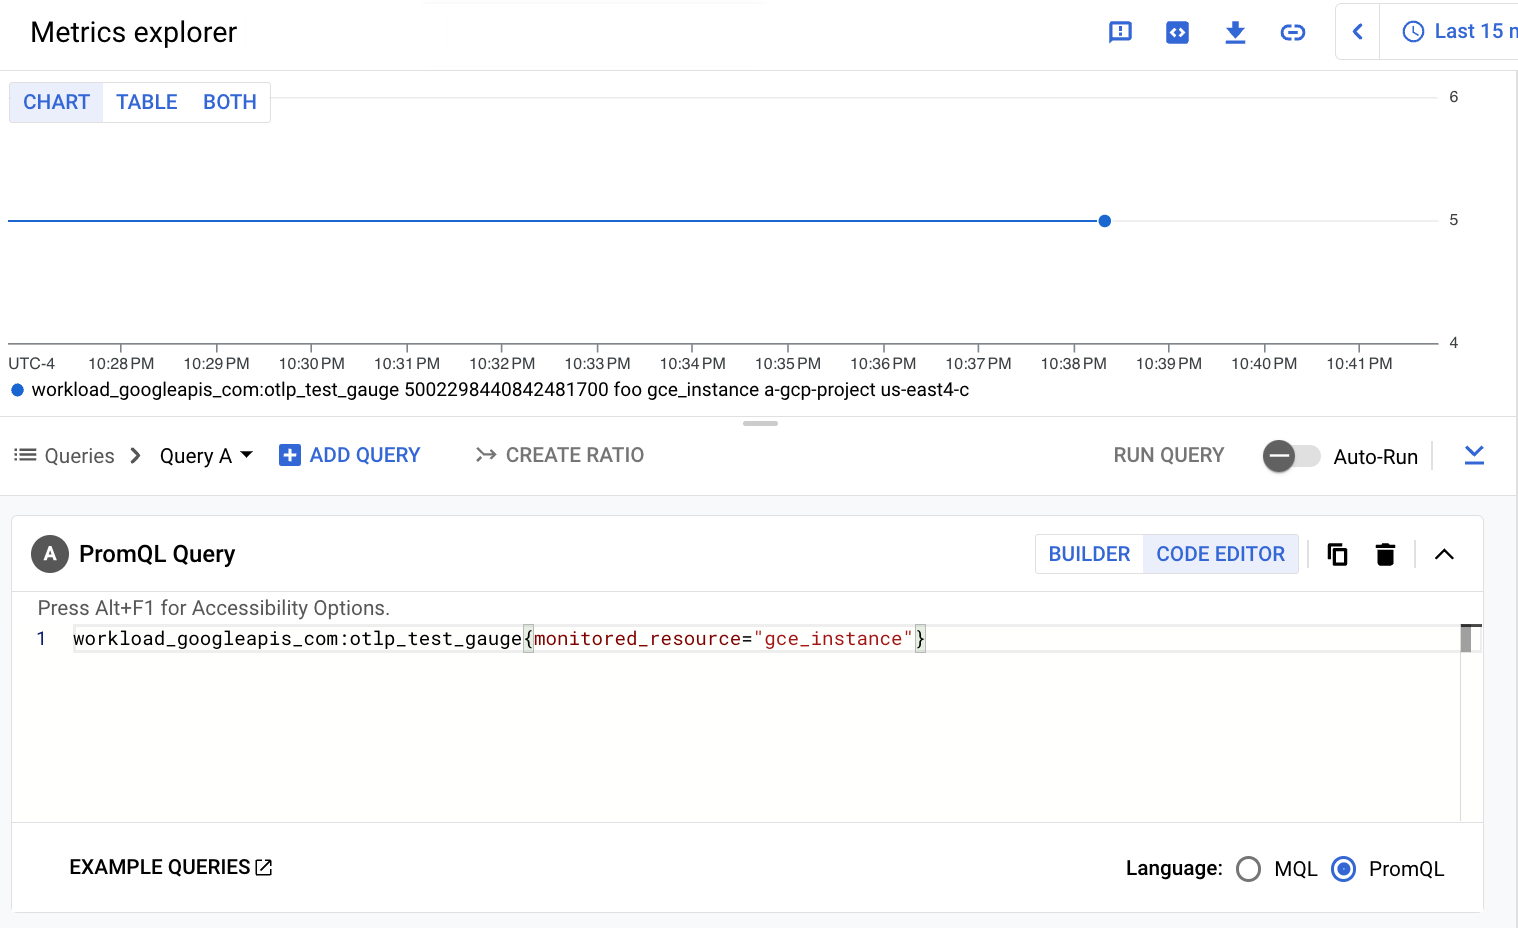
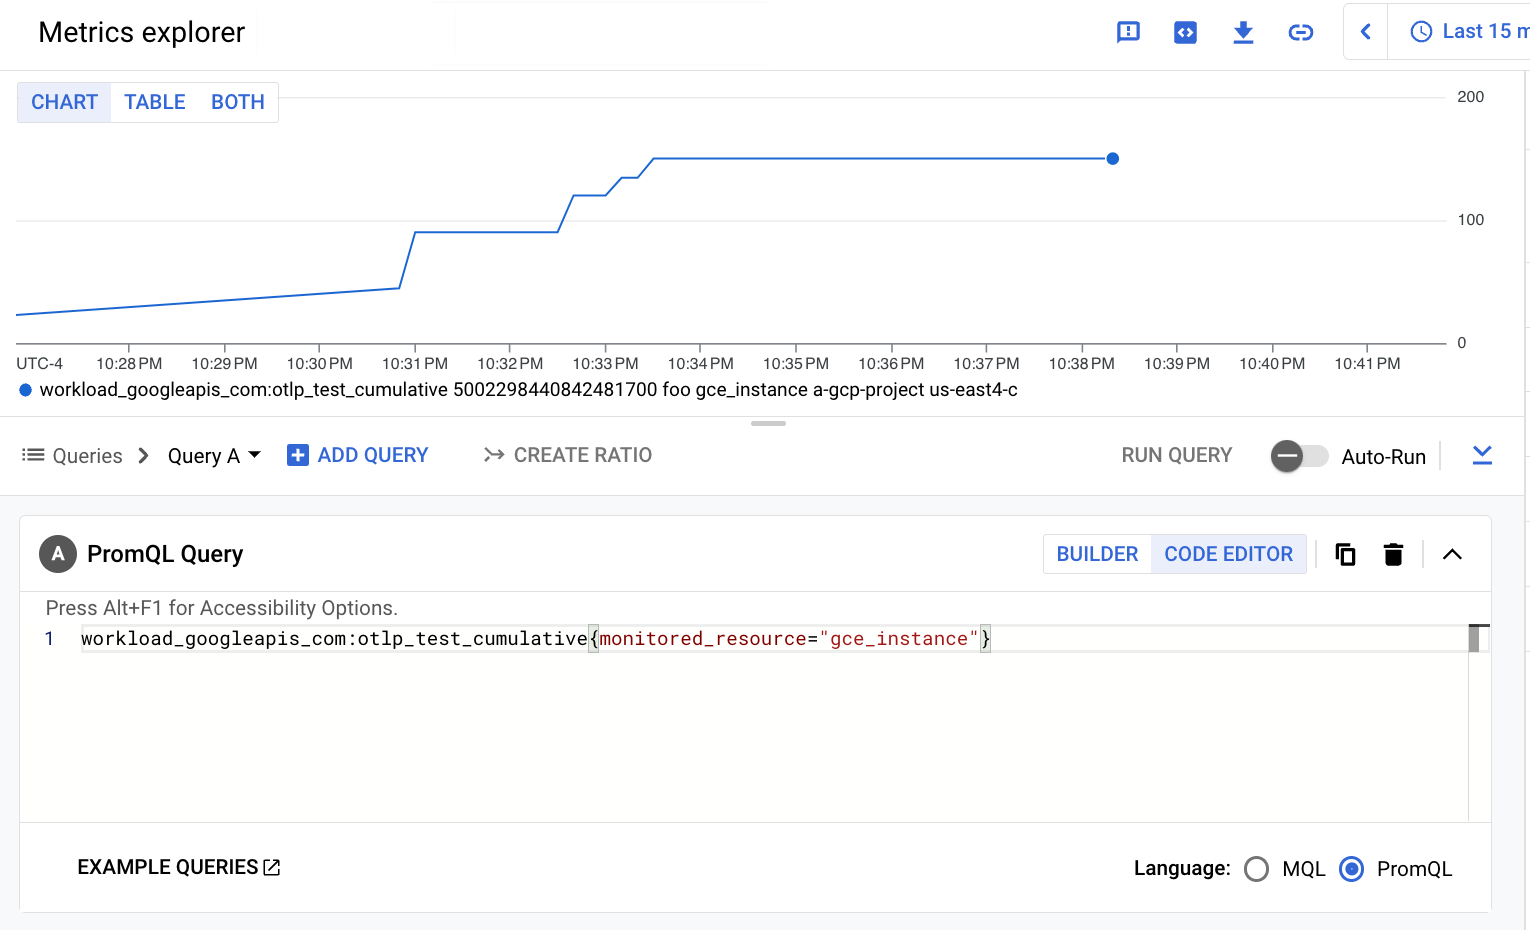
Trivial PromQL queries for the example metrics look like the following:
workload_googleapis_com:otlp_test_gauge{monitored_resource="gce_instance"}workload_googleapis_com:otlp_test_cumulative{monitored_resource="gce_instance"}
The following screenshot shows the result of querying the
workload.googleapis.com/otlp.test.gauge metric:
The following screenshot shows the result of querying the
workload.googleapis.com/otlp.test.cumulative metric:
View metric usage and diagnostics in Cloud Monitoring
The Cloud Monitoring Metrics Management page provides information that can help you control the amount you spend on billable metrics without affecting observability. The Metrics Management page reports the following information:
- Ingestion volumes for both byte- and sample-based billing, across metric domains and for individual metrics.
- Data about labels and cardinality of metrics.
- Number of reads for each metric.
- Use of metrics in alerting policies and custom dashboards.
- Rate of metric-write errors.
You can also use the Metrics Management page to exclude unneeded metrics, eliminating the cost of ingesting them.
To view the Metrics Management page, do the following:
-
In the Google Cloud console, go to the Metrics management page:
If you use the search bar to find this page, then select the result whose subheading is Monitoring.
- In the toolbar, select your time window. By default, the Metrics Management page displays information about the metrics collected in the previous one day.
For more information about the Metrics Management page, see View and manage metric usage.
Collect OTLP traces
If you have configured the Ops Agent to collect traces, but you get no traces in Cloud Trace when you run your application, then you might need to grant an additional role to the Compute Engine service account the agent uses. By default, the service account gets the roles necessary to write metrics and logs, but not traces.
This following sections describes how to grant the service account the necessary Cloud Trace authorization.
Determine the roles granted to to the service account
To see the roles granted to a service account, run the following
gcloud projects get-iam-policy command:
gcloud projects get-iam-policy PROJECT_ID --format="table(bindings.role)" --flatten="bindings[].members" --filter="bindings.members:SERVICE_ACCT_NAME@PROJECT_ID.iam.gserviceaccount.com"
You might see output like the following:
ROLE
roles/logging.logWriter
roles/monitoring.metricWriter
If the output includes either roles/cloudtrace.agent or
roles/cloudtrace.admin, then the service account has sufficient
permission to write traces. To grant one of these roles to the service
account, see the following section.
Grant the Cloud Trace role to the service account
For a service account, the Cloud Trace Agent role,
roles/cloudtrace.agent,
is usually appropriate. To grant this role to the service account,
run the following gcloud projects
add-iam-policy-binding command:
gcloud projects add-iam-policy-binding PROJECT_ID --member "serviceAccount:SERVICE_ACCT_NAME@PROJECT_ID.iam.gserviceaccount.com" --role="roles/cloudtrace.agent"
You can then run the gcloud projects get-iam-policy command to verify
that the change has been made:
gcloud projects get-iam-policy PROJECT_ID --format="table(bindings.role)" --flatten="bindings[].members" --filter="bindings.members:SERVICE_ACCT_NAME@PROJECT_ID.iam.gserviceaccount.com"
The output now includes roles/cloudtrace.agent:
ROLE
roles/cloudtrace.agent
roles/logging.logWriter
roles/monitoring.metricWriter
For more information about managing IAM roles, see Manage access to project, folders, and organizations.
After you authorize the service account used by the Ops Agent to write data to Cloud Trace, when you run your OpenTelemetry-based application, the traces appear in Cloud Trace.
Disable the OTLP receiver
If you are collecting both OTLP metrics and traces by using the Ops Agent, and you want to disable the collection of either metrics or traces but not both, then do the following:
Disable collection of either metrics or traces by making one of the following changes to the user configuration file,
config.yaml:- Remove the
otlppipeline from themetricsservice. - Remove the
otlppipeline from thetracesservice.
- Remove the
To disable the collection of OTLP metrics and traces by the Ops Agent, do the following:
Remove the OTLP configuration from the user configuration file:
- Delete the entire
combinedsection, which includes theotlpreceiver. - Remove the
otlppipeline from themetricsservice. - Delete the entire
tracesservice.
- Delete the entire
What's next
After your application metrics and traces have been ingested, you can use the Google Cloud console to monitor and analyze your data.
- For information about dashboards and the types of charts you can create, see Dashboards and charts.
- For information about alerting policies, see Using alerting policies.
- For information about analyzing trace data, see Find and explore traces.