このドキュメントでは、Google Cloud Managed Service for Prometheus で使用するGoogle Cloud プロジェクトの指標スコープを構成する方法について説明します。
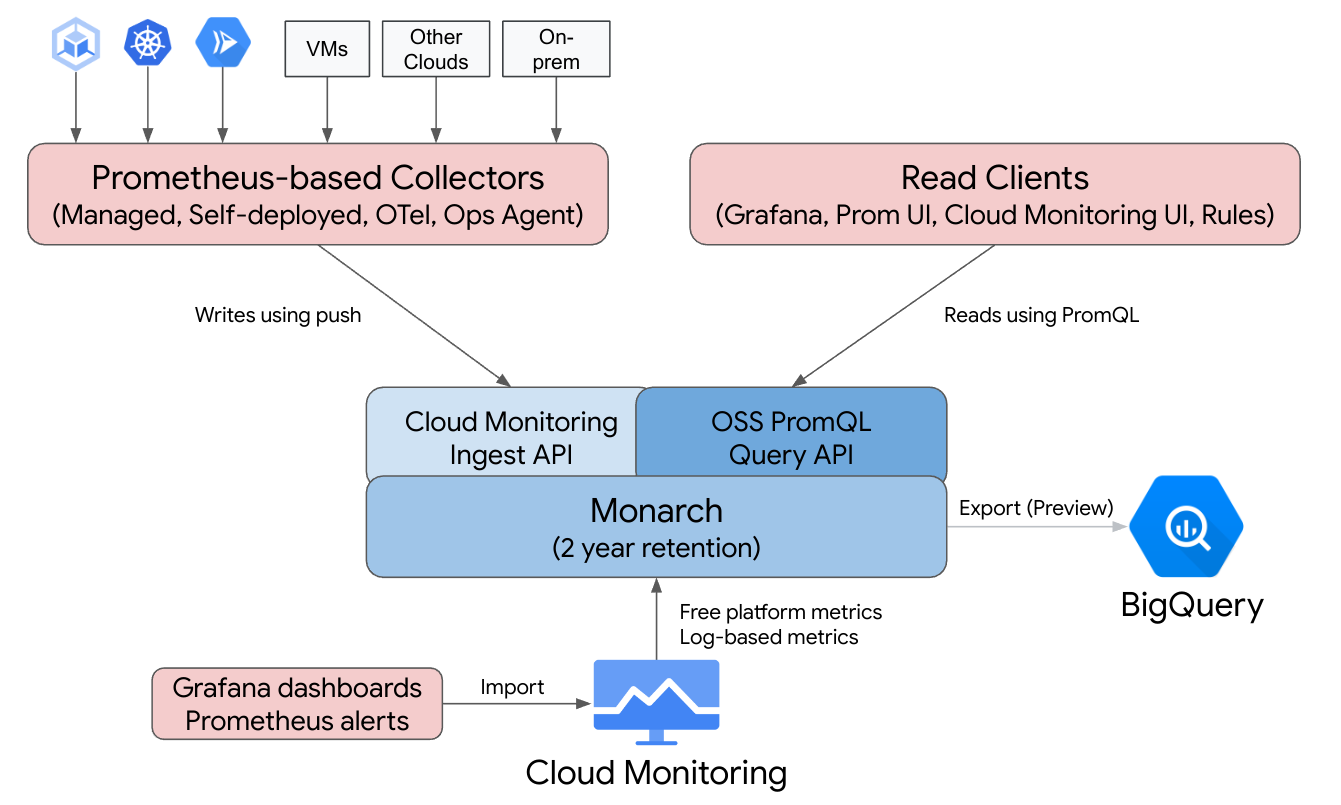
理想的な Managed Service for Prometheus のデプロイは、必要に応じた通常の Prometheus デプロイとは異なります。Prometheus は、データを収集する Prometheus サーバーでルールとクエリが実行される、インスタンス固有のスコープ(通常はクラスタ スコープ)です。Managed Service for Prometheus はグローバル バックエンド(Monarch)にデータを送信するため、ローカル クラスタではなく Monarch に対して実行されるようにクエリを構成する必要があります。マネージド コレクションを使用している場合、同じ要件がルールに適用されます。
Managed Service for Prometheus を使用してクエリを実行するデータは、データのクエリ方法に関係なく、Cloud Monitoring の構成の指標スコープによって決まります。
指標スコープ
Monitoring の指標スコープは読み取り専用のコンストラクトです。これを使用すると、複数の Google Cloud プロジェクトに属している指標データをクエリできます。すべての指標スコープは、スコープ対象プロジェクトと呼ばれる専用の Google Cloud プロジェクトによってホストされます。
[[["わかりやすい","easyToUnderstand","thumb-up"],["問題の解決に役立った","solvedMyProblem","thumb-up"],["その他","otherUp","thumb-up"]],[["わかりにくい","hardToUnderstand","thumb-down"],["情報またはサンプルコードが不正確","incorrectInformationOrSampleCode","thumb-down"],["必要な情報 / サンプルがない","missingTheInformationSamplesINeed","thumb-down"],["翻訳に関する問題","translationIssue","thumb-down"],["その他","otherDown","thumb-down"]],["最終更新日 2025-09-04 UTC。"],[],[],null,["# Configuring your metrics scopes\n\nThis document describes how to configure the metrics scopes of your\nGoogle Cloud projects for use with Google Cloud Managed Service for Prometheus.\n\nThe ideal Managed Service for Prometheus deployment is different from the\ntypical Prometheus deployment by necessity. Prometheus is highly scoped to\nits own instance---which is itself typically cluster-scoped---in that\nrules and queries run on the Prometheus server that collects the data.\nBecause Managed Service for Prometheus sends data to the global backend,\n[Monarch](https://research.google/pubs/pub50652/), queries must be configured to execute against\nMonarch, not the local cluster. If you are using managed collection,\nthen the same requirement applies to rules.\n\nThe data you query using Managed Service for Prometheus is determined\nby the Cloud Monitoring construct *metrics scope*, regardless of\nhow you query the data.\n\nMetrics scopes\n--------------\n\nA Monitoring metrics scope is a read-time-only construct that\nlets you query metric data belonging to multiple Google Cloud projects. Every\nmetrics scope is hosted by a designated Google Cloud project, called the\n*scoping project*.\n\nBy default, a project is the scoping project for its own metrics scope,\nand the metrics scope contains the metrics and configuration for that\nproject. A scoping project can have more than one monitored project in its\nmetrics scope, and the metrics and configurations from all the monitored\nprojects in the metrics scope are visible to the scoping project. A\nmonitored project can also belong to more than one metrics scope.\n\nWhen you query the metrics in a scoping project, and if that\nscoping project hosts a multi-project metrics scope, you can retrieve\ndata from multiple projects. If your metrics scope contains all your\nprojects, then your queries and rules evaluate globally.\n\nFor more information about scoping projects and metrics scope,\nsee [Metrics scopes](/monitoring/settings#concept-scope). For information about configuring\nmulti-project metrics scope, see [View metrics for multiple\nprojects](/monitoring/settings/multiple-projects).\n\nTo minimize the complexity of your permissions model, use as few metrics\nscopes as possible. If you do not consider your metric data to be sensitive\nand it is acceptable for all users to be able to access all metrics,\nthen use a single metrics scope that contains all your projects.\n\nGrouping projects together for querying\n---------------------------------------\n\nThe other best-practice scenarios use the following metrics-scope\nconfigurations:"]]