이 페이지에서는 Key Visualizer 히트맵에 표시될 수 있는 패턴 예시를 설명합니다. 이러한 패턴은 특정 성능 문제를 해결하는 데 도움이 될 수 있습니다.
Key Visualizer에 노출되는 일부 문제는 기본 키 정의와 관련됩니다. 기본 키는 변경될 수 없으므로 이러한 문제는 설계 또는 개념 증명 단계에서 가장 많이 발견됩니다.
인스턴스의 노드 할당과 관련된 다른 문제도 있을 수 있습니다. 전체 또는 가능한 특정 시간(일)에 추가 용량을 프로비저닝해야 할 수도 있습니다. 인스턴스와 연결된 노드의 수를 변경하려면 노드 수 변경을 참조하세요.
- Key Visualizer 스캔을 여는 방법에 대해 알아보려면 특정 기간의 스캔 보기를 참조하세요.
- Key Visualizer 스캔을 자세히 탐색하는 방법을 알아보려면 히트맵 탐색을 참조하세요.
이 페이지를 읽기 전에 Key Visualizer 개요를 숙지해야 합니다.
고르게 분포된 읽기 및 쓰기
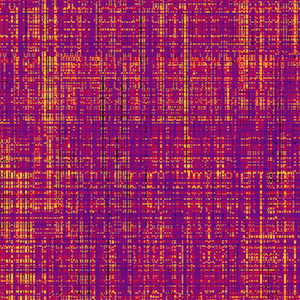
히트맵에 밝고 어두운 색상이 고운 결로 혼합되어 표시되는 경우에는 데이터베이스 전반에서 읽기 및 쓰기가 고르게 분포된 것입니다. 이 히트맵은 Spanner의 효과적인 사용 패턴을 나타내므로 어떠한 조치도 취할 필요가 없습니다.
자체 히트맵은 이와 같이 고르게 분산되지 않을 수 있지만 여전히 정상적인 스키마와 워크로드를 보여줍니다. 일부 핫스팟 수는 올바르게 리소스된 구성에서 발생할 수 있습니다.
단조롭게 증가하는 키

밝은 대각선 하나가 있거나 상단이 평평한 삼각형이 있는 히트맵은 순차 키를 사용하는 데이터베이스를 나타낼 수 있습니다. 순차 키는 Spanner에서 피해야 할 패턴입니다. 순차 키로 인해 핫스팟이 발생하는 이유는 스키마 설계 권장사항 페이지를 참조하세요.
영구 핫키 범위
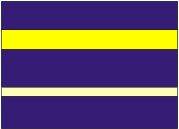
히트맵에 밝은 색상의 가로 밴드가 어두운 색상과 구분되어 있는 경우 이는 시간이 경과함에 따라 특정 행 범위가 지속적으로 과도하게 액세스되고 있음을 나타냅니다.
이 문제를 해결하려면 자주 사용되는 행이나 과도하게 큰 행에 있는 데이터가 여러 행에 분산되도록 스키마 설계나 애플리케이션을 변경하는 것이 좋습니다.
단일 핫 테이블

히트맵이 단일 테이블에 밝은 색상의 밴드를 표시하는 경우 이는 시간이 경과함에 따라 해당 테이블에 대한 액세스가 과도해짐을 나타냅니다.
이 패턴만으로는 문제가 발생하지 않습니다. 이 패턴이 성능 문제와 결합되어 있으면 컴퓨팅 용량이 부족한 것일 수 있습니다. 다음과 같은 사항을 고려하세요.
애플리케이션에서 전체 테이블 스캔을 요청 중일 수 있습니다. 이 스캔은 Key Visualizer에서 전체 테이블의 밝은 밴드로 표시됩니다. 대신 보다 제한적인 쿼리를 사용하거나 색인으로 쿼리하여 스캔할 행 수를 줄이는 것이 좋습니다.
이 인스턴스의 노드 수를 늘립니다.
시간 경과에 따른 읽기 및 쓰기 이동

히트맵에 밝은 색상의 대각선(올라가거나 내려감)이 여러 개 있는 경우 이는 일반적으로 단기간 동안의 행에 대한 순차 읽기나 쓰기를 나타냅니다.
선이 테이블 내보내기와 같은 읽기 활동과 일치하면 어떠한 조치도 필요하지 않습니다. 이러한 읽기 중에 성능 문제가 발생하는 경우 해당 기간 중에 인스턴스의 노드 수를 늘리는 것이 좋습니다. 마침표 사이에서 노드 수를 줄일 수 있습니다.
선이 쓰기 활동과 일치하고 성능 문제가 발생하는 경우 워크로드를 순차 쓰기 대신 임의 쓰기로 변경하는 것이 좋습니다.
갑작스러운 트래픽 증가
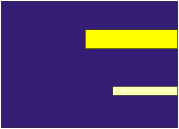
히트맵에서 히트맵의 일정 부분까지 밝은 색의 가로 밴드가 표시되는 경우 이는 데이터베이스 패턴 사용량이 갑작스럽게 변경됨을 나타냅니다. 이는 악성 쿼리이거나 특정 행의 활동에 대한 예기치 않은 급증일 수 있습니다.
주의사항
Key Visualizer에서 성능 및 리소스 사용량에 대한 완전한 그림을 제시하지 못하는 시나리오가 있을 수 있습니다.
| 시나리오 | 히트맵 내용 |
|---|---|
| 대형 데이터 테이블 하나와 작은 테이블 몇 개 | Key Visualizer가 작은 테이블보다 큰 테이블에서 더 많은 행 범위를 선택합니다. 따라서 작은 테이블이 히트맵에서 단일 행 범위로만 나타날 수 있습니다. 테이블 수가 1,000개 미만이면 모든 테이블을 나타내는 행 범위가 있습니다. 작은 테이블에서 키 또는 작은 범위의 키가 핫이면 사용자는 이 테이블이 핫임을 알 수 있지만 그 이상을 알 수 없습니다. |
| 많은 테이블/색인 예를 들어 크기에 상관없이 테이블이 수백 개 또는 수천 개 있는 데이터베이스입니다. |
Key Visualizer는 행 범위를 최대 1,000개까지 선택합니다. 테이블과 색인이 많으면 히트맵에서 이들 중 일부에 데이터 포인트가 0개 또는 1개만 있을 수 있습니다. 따라서 테이블을 건너뛰거나 다운샘플링하면 핫스팟이 누락될 수 있습니다. |
| 빠른 키 변경 | 키 공간이 빠르게 변경되면 행 범위가 자주 변경됩니다. 새로 삽입된 키로 인해 이전 행 범위를 분할해야 하거나 삭제된 키로 인해 여러 행 범위가 병합되면 측정항목이 근사치가 됩니다(예: 분할/조합). 측정항목 값의 근사치를 곱하면 정확도가 떨어질 수 있습니다. 또한 키 공간 변경 후 행 범위 업데이트가 지연되므로 행 범위가 업데이트될 때까지 세부사항이 손실될 수 있습니다. |
다음 단계
- Key Visualizer를 시작하는 방법 알아보기
- 히트맵을 세부적으로 탐색하는 방법 알아보기
- 히트맵에서 볼 수 있는 측정항목 알아보기