本頁說明 Key Visualizer 介面的功能。
閱讀本頁之前,請先熟悉 Key Visualizer 總覽,並確認您已存取 Key Visualizer。
熱視圖
Key Visualizer 掃描的核心是熱視圖,能隨時間變化顯示指標值,並細分為資料列索引鍵的連續範圍。熱圖的 X 軸代表時間,Y 軸代表資料列範圍。如果指標在某個時間點的資料列範圍內有低值,則該指標為冷門,並以深色顯示。高值表示熱門,並以亮色顯示。最高值會以白色顯示。
不同類型的使用狀況會讓熱視圖中有不同的視覺模式,您可以一目了然地診斷問題。如需更多範例,請參閱常見的熱點圖模式。
資料列範圍
資料列範圍是單一資料表或索引中的連續資料列集合。它是由開始鍵和結束鍵定義。
Spanner 資料庫通常包含許多資料表和索引。索引鍵檢視器會根據整個資料庫中所有資料表和索引的現有索引鍵,選取最多 1,000 個資料列範圍。在熱力圖上,系統會先依照表格或索引名稱的字母順序排序每個鍵。在每個資料表或索引中,鍵會依主鍵值排序。因此,資料列範圍只包含單一資料表或索引的鍵。對於交錯資料表,父項資料表的資料列範圍不會包含交錯子項資料表的任何索引鍵。
Key Visualizer 最多會選取 1,000 個列範圍。如果合併的表格和索引超過 1,000 個,部分表格會在熱力圖上合併為單一資料點,並以單一行顯示。因此,潛在熱點可能會因為表格合併和降樣而難以偵測。
如果資料表和索引少於 1,000 個,熱力圖至少會顯示一個資料列範圍,代表每個資料表。
調整亮度
Key Visualizer 熱視圖使用深色來標示正常或低值,亮色用來標示高值。若熱視圖中的顏色太亮或太暗,則可能很難看到指標的重要模式。
每個顏色對應的值會在「調整亮度」按鈕左側的圖例中定義。
請注意,對於大多數指標,Key Visualizer 會根據您對該資料庫的使用情形,判斷哪些值是「高」和「低」。舉例來說,如果您針對特定的資料列範圍每秒執行 20 次讀取,並在其他資料列範圍內每秒執行 1 次讀取,即使對 Spanner 而言每秒 20 次讀取並不是很高的數字,Key Visualizer 仍會在該特定資料列範圍使用亮色。
如要調整不同值使用的顏色,請使用「Adjust Brightness」圖示兩側的 + / - 按鈕。brightness_6當您要提升亮度時,可以降低每種顏色所代表的值的範圍;降低亮度時,可以增加值的範圍。
放大時間段及資料列索引鍵範圍
當您開啟熱視圖時,其會呈現掃描中包含整個時間區段的值,以及資料表中整個資料列索引鍵的範圍。當您在特定時間區段或是特定資料列索引鍵範圍中發現問題,您可以放大以更仔細地檢查問題。
以下有幾種方式可以進行縮放:
- 在熱視圖中向上或向下捲動。
- 按一下「矩形縮放」crop 按鈕,接著點選並拖曳來選取要放大的區域。
- 按住
Shift鍵,然後點選並拖曳要放大的區域。 - 按下
Backspace或Delete鍵,即可返回熱點圖的上一區域。 - 按一下「Reset Zoom」zoom_out_map 按鈕或按下
R鍵,即可縮小查看整個資料表。
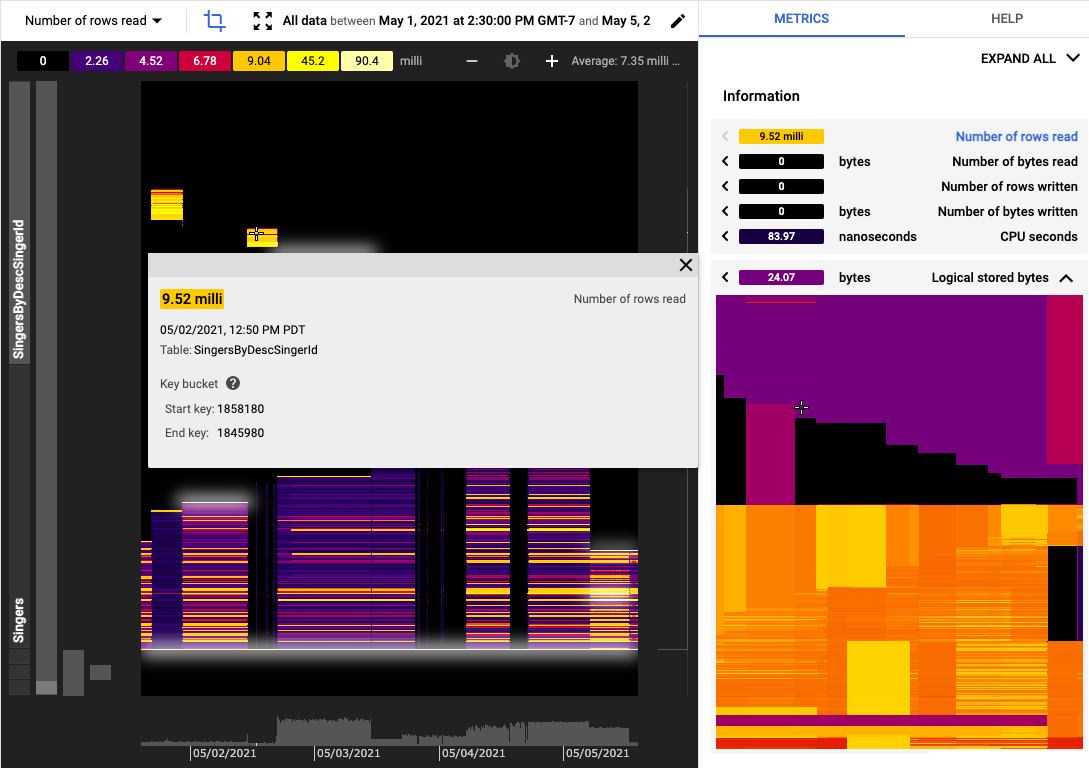
指標的固定細節
當您將游標移動至熱視圖上時,Key Visualizer 會顯示一個工具提示,其中包含游標所指的指標的詳細資訊。您可以按一下熱視圖,將此工具提示固定在一個地方。固定的工具提示會顯示與指標相關的更多詳細資料。固定工具提示還能讓您更輕鬆地擷取工具提示的畫面,或者複製工具提示中的資訊。
切換指標
您可以從頁面左上方的下拉式指標清單中,選擇要顯示在熱力圖中的指標。
如需每個指標的說明,請查看 Key Visualizer 指標。
尋找不同指標之間的關聯
如要比較指標或找出指標之間的相關性,您可以在 Key Visualizer 中同時查看多個指標。
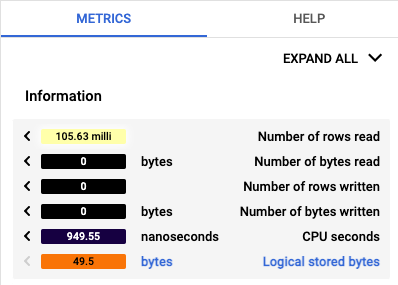
如要同時查看多個指標及其值,請按一下右上角附近的「顯示資訊面板」。熱圖右側的窗格會顯示指標清單。
如要一次檢視多個指標,請在資訊面板中使用下列工具:
- 如要顯示或隱藏所有指標的縮圖熱點圖,請按一下右上方的
Expand All或Collapse All。 - 若要顯示個別指標的熱視圖,請按一下指標名稱。
- 若要隱藏個別指標的熱視圖,只要再按一下指標名稱即可。
若要在主視窗中顯示指標的熱視圖,請按一下指標標題列左邊的實心箭頭。
將游標懸停在小型熱視圖上,即可在主要檢視中查看對應的活動。
如要比較同一時間點的不同資料列範圍指標,您可以在掃描中固定一個值,然後在同一時間點切換至其他指標:
- 在主視窗中,在大型熱視圖上指到您感興趣的位置。
- 按一下以固定工具提示。側邊面板中的值會固定在你已固定的資料列範圍和時間點。
- 若要在大型熱視圖中顯示指標,請按一下該指標左邊的實心箭頭。主視窗的工具提示會顯示該指標的完整詳細資料。
後續步驟
- 瞭解如何辨別熱視圖中的常見模式。
- 瞭解熱視圖中可以查看的指標。