This page describes how to use CPU utilization metrics and charts, along with other introspection tools, to investigate high CPU usage in your database.
Identify whether a system or user task is causing high CPU utilization
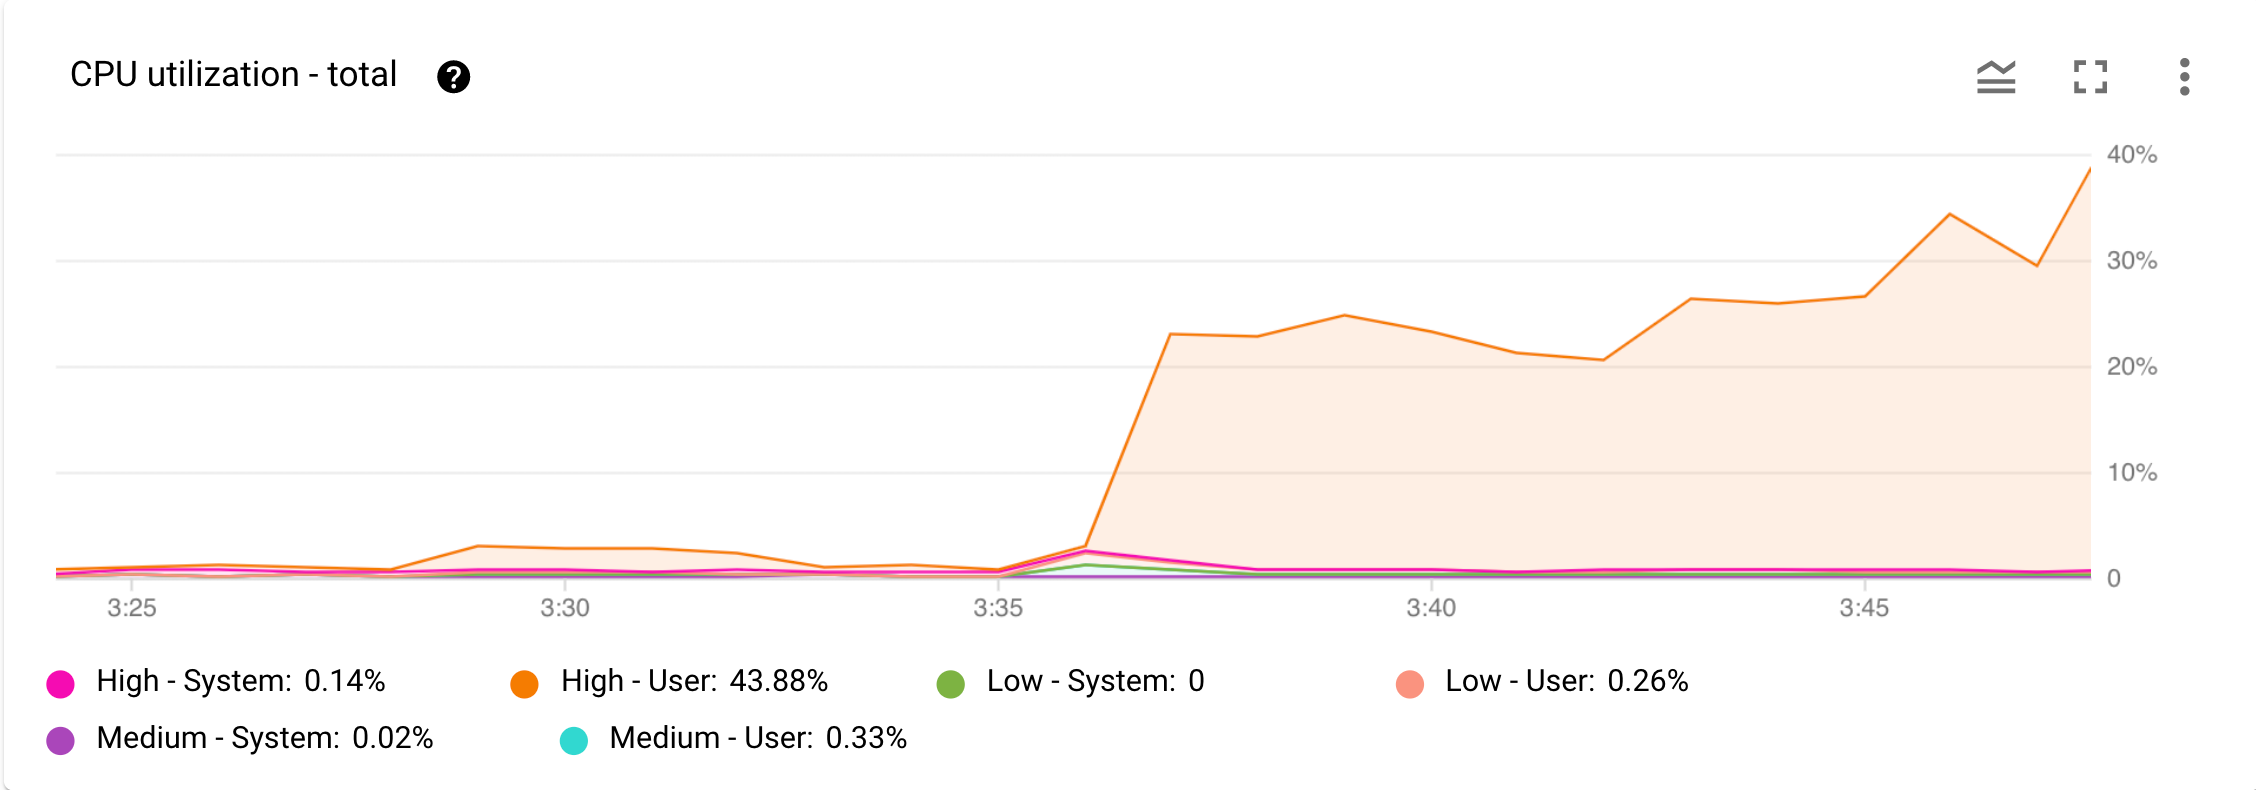
The Google Cloud console provides several monitoring tools for Spanner, allowing you to see the status of the most essential metrics for your instance. One of these is a chart called CPU utilization - Total. This chart shows you the total CPU utilization, as a percentage of the instance's CPU resources, broken down by task priority and operation type. There are two types of tasks: user tasks, such as reads and writes, and system tasks, which covers automated background tasks like compaction and index backfilling.
Figure 1 shows an example of the CPU utilization - Total chart.

Figure 1. CPU utilization - total chart in the Monitoring dashboard in Google Cloud console.
Now, imagine you receive an alert from Cloud Monitoring that CPU usage has increased significantly. You open the Monitoring dashboard for your instance in Google Cloud console and examine the CPU Utilization - Total chart in the Google Cloud console. As shown in Figure 1, you can see the increased CPU utilization from high-priority user tasks. The next step is to find out what high-priority user operation is causing this CPU usage increase.
You can visualize this and other metrics on a time series by using Query insights dashboards. These prebuilt dashboards help you view spikes in CPU utilization and identify inefficient queries.
Identify what user operation is causing the CPU utilization spike
The CPU utilization - Total chart in Figure 1 shows that high-priority user tasks are the cause of higher CPU usage.
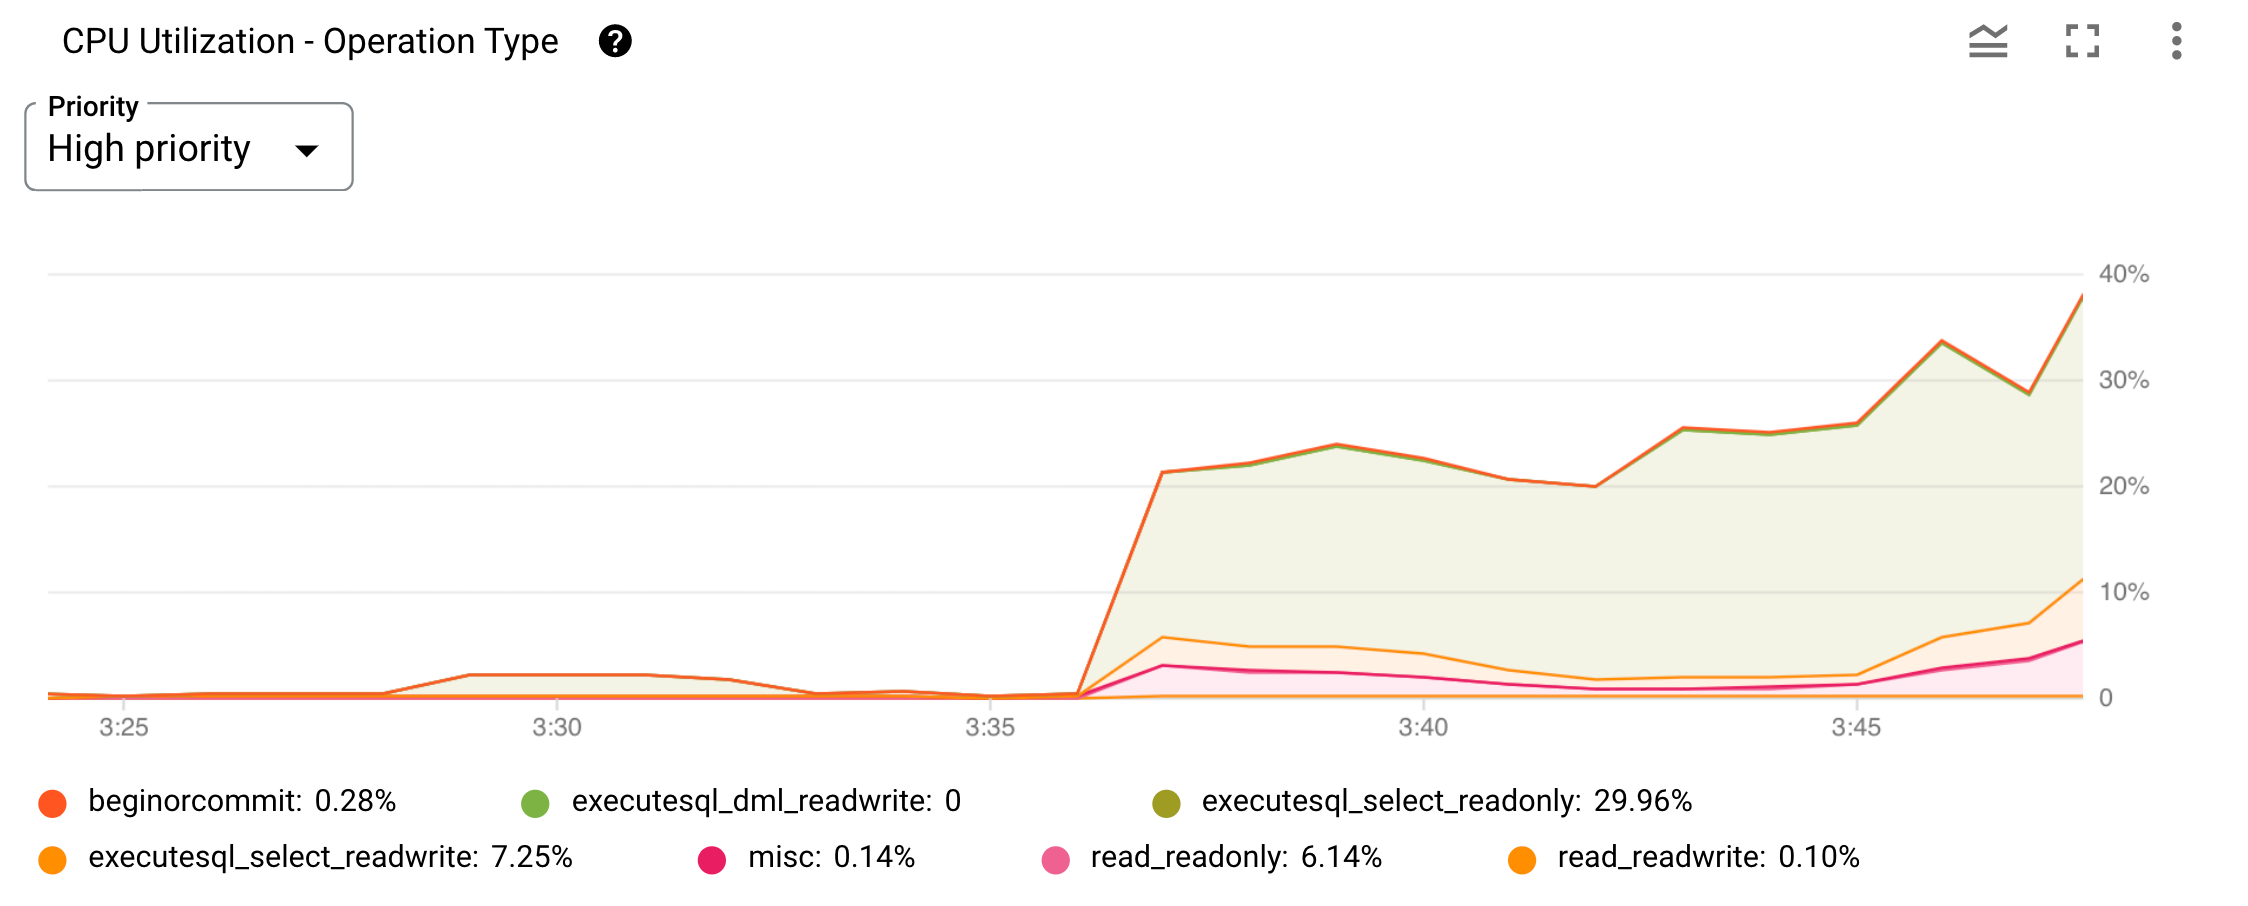
Next, you'll examine the CPU Utilization by operation type chart in Google Cloud console. This chart shows the CPU utilization broken down by high-, medium-, and low-priority user-initiated operations.
What is a user-initiated operation?
A user-initiated operation is an operation that is initiated through an API request. Spanner groups these requests into operation types or categories, and you can display each operation type as a line on the CPU utilization by operation type chart. The following table describes the API methods that are included in each operation type.
| Operation | API methods | Description |
|---|---|---|
| read_readonly | Read StreamingRead |
Includes reads which fetch rows from the database using key lookups and scans. |
| read_readwrite | Read StreamingRead |
Includes reads inside read-write transactions. |
| read_withpartitiontoken | Read StreamingRead |
Includes read operations performed using a set of partition tokens. |
| executesql_select_readonly | ExecuteSql ExecuteStreamingSql |
Includes execute Select SQL statement and change stream queries. |
| executesql_select_readwrite | ExecuteSql ExecuteStreamingSql |
Includes execute Select statement inside read-write transactions. |
| executesql_select_withpartitiontoken | ExecuteSql ExecuteStreamingSql |
Includes execute Select statement performed using a set of partition tokens. |
| executesql_dml_readwrite | ExecuteSql ExecuteStreamingSql ExecuteBatchDml |
Includes execute DML SQL statement. |
| executesql_dml_partitioned | ExecuteSql ExecuteStreamingSql ExecuteBatchDml |
Includes execute Partitioned DML SQL statement. |
| beginorcommit | BeginTransaction Commit Rollback |
Includes begin, commit, and rollback transactions. |
| misc | PartitionQuery PartitionRead GetSession CreateSession |
Includes PartitionQuery, PartitionRead, Create Database, Create Instance, session related operations, internal time-critical serving operations, etc. |
Here's an example chart of the CPU utilization by operation types metric.

Figure 2. CPU utilization by operation type chart in Google Cloud console.
You can limit display to a specific priority by using the Priority menu on top of the chart. It plots each operation type or category on a line graph. The categories listed below the chart identify each graph. You can hide and show each graph by selecting or deselecting its respective category filter.
Alternatively, you can also create this chart in metrics explorer as described below:
Create a chart for CPU utilization by operations type in Metrics Explorer
- In the Google Cloud console, select Monitoring, or use the following button:
- Select Metrics Explorer in the navigation pane.
-
In the Find resource type and metric field, enter the value
spanner.googleapis.com/instance/cpu/utilization_by_operation_type, then select the row that appears below the box. -
In the Filter field, enter the value
instance_id, then enter the instance ID you want to examine and click >Apply. -
In the Group By field, select
categoryfrom the dropdown list. The chart will show CPU utilization of user tasks grouped by operation type, or category.
While the CPU utilization by priority metric in the preceding section helped determine whether a user or system task caused an increase in CPU resource usage, with the CPU utilization by operation type metric you can dig deeper and find out the type of user-initiated operation behind this rise in CPU usage.
Identify which user request is contributing to increased CPU usage
To determine which specific user request is responsible for the spike in CPU utilization in the executesql_select_readonly operation type graph you see in Figure 2, you'll use the built-in introspection statistics tables to gain more insight.
Use the following table as a guide to determine which statistics table to query based on the operation type that is causing high CPU usage.
| Operation type | Query | Read | Transaction |
|---|---|---|---|
| read_readonly | No | Yes | No |
| read_readwrite | No | Yes | Yes |
| read_withpartitiontoken | No | Yes | No |
| executesql_select_readonly | Yes | No | No |
| executesql_select_withpartitiontoken | Yes | No | No |
| executesql_select_readwrite | Yes | No | Yes |
| executesql_dml_readwrite | Yes | No | Yes |
| executesql_dml_partitioned | No | No | Yes |
| beginorcommit | No | No | Yes |
For example, if read_withpartitiontoken is the problem, troubleshoot using read statistics.
In this scenario, the executesql_select_readonly operation seems to be the reason for the CPU usage increase you are observing. Based on the preceding table, you should look at query statistics next to find out what queries are expensive, run frequently or scan a lot of data.
To find out the queries with the highest CPU usage in the previous hour, you can
run the following query on the query_stats_top_hour statistics table.
SELECT text,
       execution_count AS count,
       avg_latency_seconds AS latency,
       avg_cpu_seconds AS cpu,
       execution_count * avg_cpu_seconds AS total_cpu
FROM spanner_sys.query_stats_top_hour
WHERE interval_end =
  (SELECT MAX(interval_end)
   FROM spanner_sys.query_stats_top_hour)
ORDER BY total_cpu DESC;
The output will show queries sorted by CPU usage. Once you identify the query with the highest CPU usage, you can try the following options to tune it.
Review the query execution plan to identify any possible inefficiencies that might contribute to high CPU utilization.
Review your query to make sure it is following SQL best practices.
Review the database schema design and update the schema to allow for more efficient queries.
Establish a baseline for the number of times Spanner executes a query during an interval. Using this baseline, you'll be able to detect and investigate the cause of any unexpected deviations from normal behavior.
If you didn't manage to find a CPU-intensive query, add compute capacity to the instance. Adding compute capacity provides more CPU resources and enables Spanner to handle a larger workload. For more information, see Increasing compute capacity.
What's next
Learn about CPU utilization metrics.
Learn about other Introspection tools.
Learn about Monitoring with Cloud Monitoring.
Learn more about SQL best practices for Spanner.
See the list of Metrics from Spanner.
