This document describes how you can create synthetic monitors to test the availability, consistency, and performance of your services, applications, web pages, and APIs. You provide tests for your application. The synthetic monitor executes that script and records the tests results and additional data such as the latency. To be notified when a test fails, you can configure an alerting policy to monitor the test results.
This feature is supported only for Google Cloud projects. For App Hub configurations, select the App Hub host project or the app-enabled folder's management project.
About synthetic monitors
A synthetic monitor periodically executes a single-purpose 2nd gen Cloud Run function that is deployed on Cloud Run. When you create the synthetic monitor, you define the Cloud Run function, which must be written in Node.js, and the execution frequency. For example, you can configure your Cloud Run function to interact with a web page by using Puppeteer. You can also configure your Cloud Run function to interact with an API by using the Axios module. You might also want to test resources that are within a VPC network.
To create your Cloud Run function, you can use an inline editor or you can upload a zip file. If you choose to use the inline editor, then you can start with a provided skeleton. After you create a synthetic monitor, Cloud Monitoring uses a scheduling system that schedules periodic execution of your Cloud Run function. While you specify the region where your Cloud Run function exists, the commands that trigger the execution can originate in any region supported by the uptime-check servers. For more information, see List uptime-check server IP addresses.
You can create an alerting policy so that you're notified when there are test failures:
When you create a synthetic monitor by using the Google Cloud console, the default behavior is to create an alerting policy. You supply the notification channels. The default alerting policy is configured to notify you when there are two, or more, consecutive test failures.
When you create a synthetic monitor by using the Cloud Monitoring API, you must create the alerting policy to monitor the
uptime_check/check_passedmetric type for the Cloud Run resource that the Cloud Run function is running on.
Execution frequency considerations
You configure how often your Cloud Run function is executed. To determine the frequency of executions, consider the service level objective (SLO) for your service. To catch potential SLO violations, you need to execute the tests frequently. However, the SLO for your service isn't the only consideration. You also need to consider how the rate of executions translates into load on your service and to your costs. Each execution provides load on your service, so the more frequently you execute your Cloud Run function, the more load you apply to your service. For reference, the default execution interval for uptime checks is one minute.
The execution frequency also determines how quickly you can be notified when your test fails. Monitoring opens an incident and sends a notification after the second consecutive failure of a test. For example, if your execution frequency is 5 minutes, then it can take 10 minutes before there are two failed tests. You're notified after the second test failure.
Cloud Run function sample code
For templates and samples, see Samples for synthetic monitors. You can use these samples as a starting point for your Cloud Run function. If you are an experienced developer, then consider using Gemini to generate code for synthetic monitors and thus reduce your development time. Using Gemini to generate code is in Public Preview.
The generic template, which you can select when you create a synthetic monitor by using the Google Cloud console, is configured to collect trace and log data for outbound HTTP requests. The solution leverages the OpenTelemetry auto-instrumentation-node module and the winston logger. Due to the dependency on open source products, you should expect changes in the structure of trace and log data. Therefore, the collected trace and log data should be used only for debugging purposes.
You can implement your own approach to collect trace and log data for outbound
HTTP requests. For an example of a custom approach,
see the class SyntheticAutoInstrumentation.
Cloud Run function configuration
When you configure your Cloud Run function, you must either specify the runtime, build, connections, and security settings, or accept the default settings:
The default value for the allocated memory might not be sufficient. We recommend that you set this field to be at least 2 GiB.
The default value for the inbound data transfer settings of your Cloud Run function is to allow all traffic. You can use this setting or a more restrictive setting.
When you allow all traffic, the first phase of validation performed by Cloud Run functions, which is done at the network-level, always passes. The second phase of validation determines whether the caller has been granted permission to execute the Cloud Run function. Authorization is dependent upon the caller's Identity and Access Management (IAM) role. By default, Cloud Monitoring is granted permission to execute your Cloud Run function. For information about how to view or modify the inbound data transfer settings, see Ingress settings.
Cloud Run function restrictions
The name of your Cloud Run function must not contain an underscore.
You can collect trace and log data for outbound HTTP requests only when you use the generic template.
Only HTTP functions are supported. If you use the Google Cloud console to create your synthetic monitor, then you're provided a default function that queries a URL. The source for the default function, which can be modified, is available in the
generic-synthetic-nodejsGit repository.For information about HTTP functions, see Write HTTP functions.
If you use the API, then the deployment command must specify that the Cloud Run function is 2nd generation. If you use the Google Cloud console, then deployment is handled for you. For more information, see Deploy a Cloud Run function.
The runtime environment is restricted to Node.js. For information, see Node. The following versions of Node.js are supported: 12, 14, 16, 18, and 20.
Data collected by synthetic monitors
This section describes the data that is collected for your synthetic monitor. For information about how to view execution results, see Explore synthetic monitor results.
Execution history
For each synthetic monitor, a history of execution results is collected. This data includes the following:
A time series that records success or failure of executions over time.
A time series that records the execution duration of the code. The execution time of the function isn't recorded. The latency data is written as an
uptime_check/request_latencytime series for the Cloud Run resource that the Cloud Run function is running on. A chart of this data is provided on the Synthetic monitor details page.Logs that contain information about synthetic monitor executions, such as information about the test and failure details. The available logs depend on your Cloud Run function. For example, if you use the Mocha template, then the logs include information about whether the test passed or failed and test duration. The stack trace, when included, lists the line of code that failed, the error types, and the error messages.
Optionally, traces and logs for outbound HTTP requests. For information about how to collect this data, see Request latency.
Cloud Run function metrics and logs
Metrics and logs for your Cloud Run function. This data, which is collected by Cloud Run functions, includes information on the number of executions per second, execution time, and memory utilization of your function.
Request latency
Latency data for the HTTP request made by the synthetic monitor is automatically collected and stored by Cloud Trace.
To collect trace, log, and latency data for the outbound HTTP requests made by your synthetic monitor, you must use the generic template. For more information, see Samples for synthetic monitors.
Before you begin
Complete the following steps in the Google Cloud project that will store the synthetic monitor:
-
To get the permissions that you need to view and modify synthetic monitors by using the Google Cloud console, ask your administrator to grant you the following IAM roles on your project:
-
Monitoring Editor (
roles/monitoring.editor) -
Cloud Functions Developer (
roles/cloudfunctions.developer)
For more information about granting roles, see Manage access to projects, folders, and organizations.
You might also be able to get the required permissions through custom roles or other predefined roles.
-
Monitoring Editor (
-
Enable the Cloud Monitoring API, Artifact Registry API, Cloud Build API, Cloud Functions API, Cloud Logging API, Pub/Sub API, and Cloud Run Admin API APIs.
Roles required to enable APIs
To enable APIs, you need the Service Usage Admin IAM role (
roles/serviceusage.serviceUsageAdmin), which contains theserviceusage.services.enablepermission. Learn how to grant roles. Verify that your Google Cloud project contains the default Compute Engine service account. This service account is created when you enable the Compute Engine API and has a name similar to
12345-compute@developer.gserviceaccount.com.In the Google Cloud console, go to the Service Accounts page:
If you use the search bar to find this page, then select the result whose subheading is IAM & Admin.
If the default Compute Engine service account doesn't exist, then click Create service account and complete the dialog.
Ensure that the default Compute Engine service account, or the service account that you created, has been granted the role of Editor (
roles/editor).To view the roles granted to your service account, do the following:
-
In the Google Cloud console, go to the IAM page:
If you use the search bar to find this page, then select the result whose subheading is IAM & Admin.
- Select Include Google-provided role grants.
- If the service account used by your synthetic monitor isn't listed, or if
it hasn't been granted a role that includes the permissions in the role
of Cloud Trace Agent (
roles/cloudtrace.agent), then grant this role to your service account.
-
- Configure the notification channels that you want to use to receive notifications. We recommend that you create multiple types of notification channels. For more information, see Create and manage notification channels and Create and manage notification channels by API.
-
Select the tab for how you plan to use the samples on this page:
Console
When you use the Google Cloud console to access Google Cloud services and APIs, you don't need to set up authentication.
gcloud
In the Google Cloud console, activate Cloud Shell.
At the bottom of the Google Cloud console, a Cloud Shell session starts and displays a command-line prompt. Cloud Shell is a shell environment with the Google Cloud CLI already installed and with values already set for your current project. It can take a few seconds for the session to initialize.
Terraform
To use the Terraform samples on this page in a local development environment, install and initialize the gcloud CLI, and then set up Application Default Credentials with your user credentials.
Install the Google Cloud CLI.
If you're using an external identity provider (IdP), you must first sign in to the gcloud CLI with your federated identity.
If you're using a local shell, then create local authentication credentials for your user account:
gcloud auth application-default login
You don't need to do this if you're using Cloud Shell.
If an authentication error is returned, and you are using an external identity provider (IdP), confirm that you have signed in to the gcloud CLI with your federated identity.
For more information, see Set up ADC for a local development environment in the Google Cloud authentication documentation.
REST
To use the REST API samples on this page in a local development environment, you use the credentials you provide to the gcloud CLI.
Install the Google Cloud CLI.
If you're using an external identity provider (IdP), you must first sign in to the gcloud CLI with your federated identity.
For more information, see Authenticate for using REST in the Google Cloud authentication documentation.
Create a synthetic monitor
Console
When you create a synthetic monitor by using the Google Cloud console, a new Cloud Run function (2nd gen) is deployed and the monitor for that Cloud Run function is created. You can't create a synthetic monitor that monitors an existing Cloud Run function.
- Ensure that you've enabled the
required APIs, that your project contains
a default Compute Engine service account, and that this account has
been granted the role of Editor (
roles/editor). For more information, see Before you begin. -
In the Google Cloud console, go to the
 Synthetic monitoring page:
If you use the search bar to find this page, then select the result whose subheading is Monitoring.
- In the toolbar of the Google Cloud console, select your Google Cloud project. For App Hub configurations, select the App Hub host project or the app-enabled folder's management project.
- Select Create Synthetic Monitor.
Select the template for your Cloud Run function:
Custom synthetic monitor: Use this template when you want to collect log data or trace data for outbound HTTP requests.
Mocha synthetic monitor: Use this template when you write Mocha test suites.
Broken link checker: Use this template to test a URI and a configurable number of links found at that URI. For information about the fields for this checker, see Create a broken-link checker.
Enter a name for the monitor.
Optional: Update the Response Timeout, the Check Frequency, and add user-defined labels.
Do one of the following:
If you have access to Gemini Code Assist in this project and want help writing your code, then click Help me code. This feature is in Public Preview. For guidance on prompts, see Learn about writing prompts for synthetic monitors.
After you are satisfied with the code, click Insert into Cloud Function.
Click Create Function.
In the Cloud Run function dialog, do the following:
Enter a display name and select a region. Names must be unique within a region.
In the Runtime, build, connections and security settings section, do the following:
Review the default settings and update them when necessary.
In the Runtime service account field, select a service account.
Edit generated code, or write or upload code for your Cloud Run function:
To edit generated code, enter your own code, or load the default sample function, select Inline Editor. The sample function, which is dependent upon the template that you selected previously, sends a request to a specific URL. You can modify the default function.
To load a zip file from your local system, select ZIP upload.
If you upload a zip file from your local system, then you must also specify a Cloud Storage bucket for the zip file. If you don't have an appropriate Cloud Storage bucket, then create one.
To load a zip file from your Cloud Storage, select ZIP from Cloud Storage, select the storage bucket, and then select the zip file to load.
You can also create a Cloud Run function by using the Cloud Run functions pages in the Google Cloud console. To create a synthetic monitor that monitors a copy of that Cloud Run function, go to the Source tab and click Download zip. You can then upload the zip file.
Click Apply function.
Configure the alerting policy:
Optional: Update the alerting policy name and the duration of failure before notifications are sent.
Add the notification channels.
Click Create.
The Cloud Run function that you defined is built and deployed as 2nd gen, and the synthetic monitor is created.
gcloud
When you create a synthetic monitor by using the Google Cloud CLI or the Cloud Monitoring API, you pass the function name to the API call. Therefore, you can only create a synthetic monitor that monitors an existing Cloud Run function.
- Ensure that you've enabled the
required APIs, that your project contains
a default Compute Engine service account, and that this account has
been granted the role of Editor (
roles/editor). For more information, see Before you begin. - Configure the Google Cloud CLI to set a
default project by using the
gcloud config setcommand:gcloud config set project PROJECT_IDBefore you run the previous command, replace the following:
- PROJECT_ID: The identifier of the project. For App Hub configurations, select the App Hub host project or the app-enabled folder's management project.
- Write and deploy your 2nd gen
Cloud Run function.
For example, to deploy the
synthetics-sdk-nodejssample in theGoogle Cloud/synthetics-sdk-nodejsrepository, do the following:Clone the repository and go to the location of the source code:
git clone https://github.com/GoogleCloudPlatform/synthetics-sdk-nodejs.git
cd synthetics-sdk-nodejs/samples/generic-synthetic-nodejs
Deploy the Cloud Run function by using the
gcloud functions deploycommand:gcloud functions deploy FUNCTION_NAME \ --gen2 --region="us-west2" --source="." \ --entry-point=SyntheticFunction --trigger-http --runtime=nodejs18In the
gcloud functions deploycommand, do the following:Ensure that the value of the FUNCTION_NAME field is unique within its deployment region.
Include the
--gen2flag and set the deployment region.Set the
--entry-pointfield as follows:- Mocha:
SyntheticMochaSuite - Not Mocha:
SyntheticFunction.
- Mocha:
Set the
--runtimefield tonodejs18.Include the
--trigger-httpflag.Set the
--ingress-settingsfield when you don't want to use the default setting, which allows all traffic.
Cloud Run functions builds and then deploys your Cloud Run function. The results of the Google Cloud CLI command include information about the function, including its fully-qualified name:
name: projects/PROJECT_ID/locations/REGION/functions/FUNCTION_NAMEFor more information about deploying a function, see Deploy a Cloud Run function.
To list the Cloud Run functions in your Google Cloud project, use the
gcloud functions listcommand:gcloud functions listThe response of this call is a list entries, each entry lists a Cloud Run function:
NAME: function-1
STATE: ACTIVE
TRIGGER: HTTP Trigger
REGION: us-west2
ENVIRONMENT: 2nd gen
To find the fully-qualified name for a specific Cloud Run function, run the
gcloud monitoring uptime describecommand. To create the synthetic monitor, run the
gcloud monitoring uptime createcommand:gcloud monitoring uptime create DISPLAY_NAME --synthetic-target=TARGETBefore you run the previous command, replace the following:
- DISPLAY_NAME: The name for your synthetic monitor.
- TARGET: The fully-qualified name of your Cloud Run function.
Create an alerting policy.
Due to the complexity of the alerting policy configuration, we recommend that you go the Synthetic monitors page in the Google Cloud console, and use the options to create an alerting policy. With this approach, most alerting policy fields are populated for you. To create the alerting policy by using the Google Cloud console, click Create policy from the Synthetic monitors page.
If you plan to use the Google Cloud CLI or the Cloud Monitoring API, then configure the filter of the condition as follows:
"filter": "resource.type = \"cloud_run_revision\" AND
            metric.type = \"monitoring.googleapis.com/uptime_check/check_passed\" AND
            metric.labels.check_id = \"CHECK_ID\"",
The condition monitors
uptime_check/check_passedtime series that are written by your synthetic monitor. Be sure to replace CHECK_ID with the identifier of the synthetic monitor, and which is included in the response data of a create command.For information about how to create an alerting policy, see Create alerting policies by using the API.
Terraform
To learn how to apply or remove a Terraform configuration, see Basic Terraform commands. For more information, see the Terraform provider reference documentation.
To create a synthetic monitor and an alerting policy to monitor that check, do the following:
Install and configure Terraform for you project. For App Hub configurations, select the App Hub host project or the app-enabled folder's management project.
Ensure that you've enabled the required APIs, that your project contains a default Compute Engine service account, and that this account has been granted the role of Editor (
roles/editor). For more information, see Before you begin.Edit your Terraform configuration file and add a
google_storage_bucketresource, and then apply your changes.The following code defines a Cloud Storage bucket in the
USlocation:resource "google_storage_bucket" "gcf_source" { name = "gcf-v2-source-9948673986912-us" location = "US" uniform_bucket_level_access = true }Edit your Terraform configuration file and add a
google_storage_bucket_objectresource, and then apply your changes.The resource specifies the name of the object in your bucket, and the location of the zip file on your local system. For example, when you apply the following code, a file with the name
example-function.zipis added to your storage bucket:resource "google_storage_bucket_object" "object" { name = "example-function.zip" bucket = google_storage_bucket.gcf_source.name source = "generic-synthetic-node.js.zip" }Edit your Terraform configuration file and add a
google_cloudfunctions2_functionresource, and then apply your changes.Ensure that your
google_cloudfunctions2_functionresource specifies a Node.js runtime and the entry point used by synthetic monitors. For example, when you apply the following code, a function with the namesm-central1is deployed:resource "google_cloudfunctions2_function" "central1" { name = "sm-central1" location = "us-central1" build_config { runtime = "nodejs20" entry_point = "SyntheticFunction" source { storage_source { bucket = google_storage_bucket.gcf_source.name object = google_storage_bucket_object.object.name } } } service_config { max_instance_count = 1 available_memory = "256Mi" timeout_seconds = 60 } }To create a synthetic monitor, edit your Terraform configuration file and add a
google_monitoring_uptime_check_configresource, and then apply your changes.For this resource, specify the
synthetic_monitorblock:resource "google_monitoring_uptime_check_config" "synthetic" { display_name = "sm-central1" timeout = "30s" synthetic_monitor { cloud_function_v2 { name = google_cloudfunctions2_function.central1.id } } }Optional: Create a notification channel and an alerting policy.
The following steps use the Google Cloud console to create the notification channel and alerting policy. This approach ensures that the alerting policy only monitors the data generated by your synthetic monitor.
To create a notification channel, do the following:
-
In the Google Cloud console, go to the notifications Alerting page:
If you use the search bar to find this page, then select the result whose subheading is Monitoring.
- Select Manage notification channels.
- Go to the type of channel that you want to add, click Add, and then complete the dialog.
-
To create an alerting policy, do the following:
-
In the Google Cloud console, go to the
Synthetic monitoring page:
If you use the search bar to find this page, then select the result whose subheading is Monitoring.
- Locate your synthetic monitor, select more_vert More, and then select Add alert policy.
- In the dialog, go to the Notifications and name section, expand Notification Channels, and make your selections.
- Name the alerting policy and then click Create policy.
-
REST
When you create a synthetic monitor by using the Google Cloud CLI or the Cloud Monitoring API, you pass the function name to the API call. Therefore, you can only create a synthetic monitor that monitors an existing Cloud Run function.
- Ensure that you've enabled the
required APIs, that your project contains
a default Compute Engine service account, and that this account has
been granted the role of Editor (
roles/editor). For more information, see Before you begin. - Configure the Google Cloud CLI to set a
default project by using the
gcloud config setcommand:gcloud config set project PROJECT_IDBefore you run the previous command, replace the following:
- PROJECT_ID: The identifier of the project. For App Hub configurations, select the App Hub host project or the app-enabled folder's management project.
- Write and deploy your 2nd gen
Cloud Run function.
For example, to deploy the
synthetics-sdk-nodejssample in theGoogle Cloud/synthetics-sdk-nodejsrepository, do the following:Clone the repository and go to the location of the source code:
git clone https://github.com/GoogleCloudPlatform/synthetics-sdk-nodejs.git
cd synthetics-sdk-nodejs/samples/generic-synthetic-nodejs
Deploy the Cloud Run function by using the
gcloud functions deploycommand:gcloud functions deploy FUNCTION_NAME \ --gen2 --region="us-west2" --source="." \ --entry-point=SyntheticFunction --trigger-http --runtime=nodejs18In the
gcloud functions deploycommand, do the following:Ensure that the value of the FUNCTION_NAME field is unique within its deployment region.
Include the
--gen2flag and set the deployment region.Set the
--entry-pointfield as follows:- Mocha:
SyntheticMochaSuite - Not Mocha:
SyntheticFunction.
- Mocha:
Set the
--runtimefield tonodejs18.Include the
--trigger-httpflag.Set the
--ingress-settingsfield when you don't want to use the default setting, which allows all traffic.
Cloud Run functions builds and then deploys your Cloud Run function. The results of the Google Cloud CLI command include information about the function, including its fully-qualified name:
name: projects/PROJECT_ID/locations/REGION/functions/FUNCTION_NAMEFor more information about deploying a function, see Deploy a Cloud Run function.
To list the Cloud Run functions in your Google Cloud project, use the
gcloud functions listcommand:gcloud functions listThe response of this call is a list entries, each entry lists a Cloud Run function:
NAME: function-1
STATE: ACTIVE
TRIGGER: HTTP Trigger
REGION: us-west2
ENVIRONMENT: 2nd gen
To find the fully-qualified name for a specific Cloud Run function, run the
gcloud monitoring uptime describecommand. To create a synthetic monitor, do the following:
- Click
projects.uptimeCheckConfigs.createto open the API reference page for the method. - Click Try it to open APIs Explorer.
Set the following fields and then run the command.
Parent field: The project in which to create the synthetic monitor. For App Hub configurations, select the App Hub host project or the app-enabled folder's management project. This field has the following format:
projects/PROJECT_IDIn the request body, specify the following:
displayName: Set to the display name for your synthetic monitor.syntheticMonitor: Set to the fully-qualified name of your Cloud Run function.
On success, the response of the API call is similar to the following:
{
"name": "projects/myproject/uptimeCheckConfigs/17272586127463315332",
"displayName": "MyMonitor",
...
"syntheticMonitor": {
 "cloudFunctionV2": {
    "name": "projects/myproject/locations/us-west2/functions/function-1",
    "cloudRunRevision": {
    "type": "cloud_run_revision",
    "labels": {
       "project_id": "myproject",
       "configuration_name": "",
       "location": "us-west2",
       "revision_name": "",
       "service_name": "function-1"
    }
    }
 }
}
}
- Click
Create an alerting policy.
Due to the complexity of the alerting policy configuration, we recommend that you go the Synthetic monitors page in the Google Cloud console, and use the options to create an alerting policy. With this approach, most alerting policy fields are populated for you. To create the alerting policy by using the Google Cloud console, click Create policy from the Synthetic monitors page.
If you plan to use the Google Cloud CLI or the Cloud Monitoring API, then configure the filter of the condition as follows:
"filter": "resource.type = \"cloud_run_revision\" AND
            metric.type = \"monitoring.googleapis.com/uptime_check/check_passed\" AND
            metric.labels.check_id = \"CHECK_ID\"",
The condition monitors
uptime_check/check_passedtime series that are written by your synthetic monitor. Be sure to replace CHECK_ID with the identifier of the synthetic monitor, and which is included in the response data of a create command.For information about how to create an alerting policy, see Create alerting policies by using the API.
Pricing
In general, Cloud Monitoring system metrics are free, and metrics from external systems, agents, or applications are not. Billable metrics are billed by either the number of bytes or the number of samples ingested.
For more information, see the Cloud Monitoring sections of the Google Cloud Observability pricing page.
Troubleshoot synthetic monitors
This section provides information that you can use to help you troubleshoot your synthetic monitors.
Error message after enabling the APIs
You open the create flow for a synthetic monitor and are prompted to enable at least one API. After you enable the APIs, a message similar to the following is displayed:
An error occurred during fetching available regions: Cloud Functions API has
not been used in project PROJECT_ID before or it is disabled.
The error message recommends that you verify that the API is enabled and then advises that you wait and retry the action.
To verify that the API is enabled, go to the APIs & Services page for your project:
After you've verified that the API is enabled, you can continue with the create flow. The condition resolves automatically after the API enablement propagates through the backend.
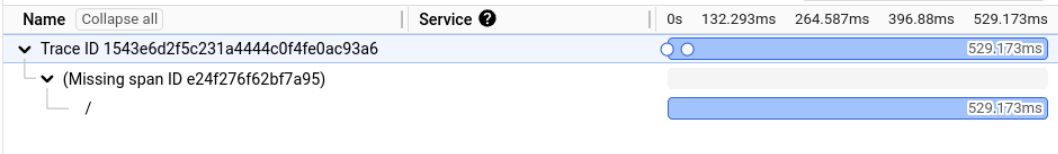
Outbound HTTP requests aren't being traced
You configure your synthetic monitor to collect trace data for output HTTP requests. Your trace data only shows one span, similar to the following screenshot:
To resolve this situation, ensure that your service account
has been granted the role of Cloud Trace Agent (roles/cloudtrace.agent).
A role of Editor (roles/editor) is also sufficient.
To view the roles granted to your service account, do the following:
-
In the Google Cloud console, go to the IAM page:
If you use the search bar to find this page, then select the result whose subheading is IAM & Admin.
- In the toolbar of the Google Cloud console, select your Google Cloud project. For App Hub configurations, select the App Hub host project or the app-enabled folder's management project.
- Select Include Google-provided role grants.
If the service account used by your synthetic monitor isn't listed, or if it hasn't been granted a role that includes the permissions in the role of Cloud Trace Agent (
roles/cloudtrace.agent), then grant this role to your service account.If you don't know the name of your service account, then in the navigation menu, select Service Accounts.
In progress status
The Synthetic monitors page lists a synthetic monitor
with a status of In progress. A status of In progress means that
the synthetic monitor was recently created and there isn't any data to display,
or that the function failed to deploy.
To determine if the function failed to deploy, try the following:
Ensure that the name of your Cloud Run function doesn't contain an underscore. If an underscore is present, remove the underscore and redeploy the Cloud Run function.
Open the Synthetic monitor details page for the synthetic monitor.
If you see the following message, then delete the synthetic monitor.
Cloud Function not found for this Synthetic monitor. Please confirm it exists or delete this monitor.
The error message indicates that the function was deleted and therefore the synthetic monitor is unable to execute the function.
Open the Cloud Run functions page for the function. To open this page from the Synthetic monitor details page, click Code, and then click the function name.
If you see a message similar to the following, then the function failed to deploy.
This function has failed to deploy and will not work correctly. Please edit and redeploy
To resolve this failure, review the function code and correct the errors that are preventing the function from building or deploying.
When you create a synthetic monitor, it might take several minutes for the function to be deployed and executed.
Warning status
The Synthetic monitors lists a synthetic monitor
with a status of Warning. A status of Warning means that the execution
results are inconsistent. This might indicate a design issue with your
test, or it might indicate that what is being tested has inconsistent behavior.
Failing status
The Synthetic monitors lists a synthetic monitor with a status of
Failing. To get more information about the failure reason,
view the most recent execution history.
If the error message
Request failed with status code 429is shown, then the target of the HTTP request rejected the command. To resolve this failure, you must change the target of your synthetic monitor.The endpoint
https://www.google.comrejects requests made by synthetic monitors.If the failure is returning an execution time of
0ms, then the Cloud Run function might be running out of memory. To resolve this failure, edit your Cloud Run function, and then increase the memory to at least 2 GiB and set the CPU field to1.
Delete fails for a synthetic monitor
You use the Cloud Monitoring API to delete a synthetic monitor, but the API call fails with a response similar to the following:
{
  "error": {
    "code": 400,
    "message": "Request contains an invalid argument.",
    "status": "INVALID_ARGUMENT",
    "details": [
      {
        "@type": "type.googleapis.com/google.rpc.DebugInfo",
        "detail": "[ORIGINAL ERROR] generic::invalid_argument: Cannot delete check 1228258045726183344. One or more alerting policies is using it.Delete the alerting policy with id projects/myproject/alertPolicies/16594654141392976482 and any other policies using this uptime check and try again."
      }
    ]
  }
}
To resolve the failure, delete alerting policies that monitor the results of the synthetic monitor, and then delete the synthetic monitor.