本文档介绍了如何创建公开拨测。公开拨测可以从全球多个位置向可公开访问的网址或 Google Cloud 资源发出请求,以查看资源是否响应。如需了解如何为专用网络创建拨测,请参阅创建非公开拨测。
公开拨测可以确定以下受监控的资源的可用性:- 拨测网址
- 虚拟机实例
- App Engine 应用
- Kubernetes 服务
- Amazon Elastic Compute Cloud (EC2) 实例
- Amazon Elastic 负载均衡器
- Cloud Run 修订版本
如需查看有关管理和监控拨测的信息链接,请参阅本文档的后续步骤部分。
此功能仅适用于 Google Cloud 项目。对于 App Hub 配置,请选择 App Hub 宿主项目或已启用应用的文件夹的管理项目。
关于拨测
对于 HTTP 和 HTTPS,将遵循所有网址重定向,并使用拨测收到的最终响应来评估任何成功标准。对于 HTTPS 检查,SSL 证书过期时间根据最终响应中收到的服务器证书计算。
要想让拨测成功,必须满足以下条件:
- HTTP 状态必须符合您指定的条件。
- 响应数据不包含所需内容,或者所需内容已存在。
拨测不会加载页面资产或运行 JavaScript,并且拨测的默认配置不包含身份验证。
准备工作
在将存储拨测的 Google Cloud 项目中完成以下步骤:
-
如需获得创建拨测所需的权限,请让您的管理员向您授予项目的以下 IAM 角色:
-
Monitoring Editor (
roles/monitoring.editor) - Google Cloud 控制台用户 -
Monitoring Uptime Check Configurations Editor (
roles/monitoring.uptimeCheckConfigEditor) - API 用户 -
Monitoring AlertPolicy Editor (
roles/monitoring.alertPolicyEditor) - API 用户 -
Monitoring NotificationChannel Editor (
roles/monitoring.notificationChannelEditor) - API 用户
如需详细了解如何授予角色,请参阅管理对项目、文件夹和组织的访问权限。
-
Monitoring Editor (
验证您要检查的资源是否具有公共端点,或者是否位于可配置的防火墙后面。
对于所有其他配置,您必须创建非公开拨测。如需了解详情,请参阅创建非公开拨测。
如果您的资源受防火墙保护,请将该防火墙配置为允许来自拨测服务器 IP 地址的传入流量。如需了解详情,请参阅列出拨测服务器 IP 地址。
配置您要用于接收通知的通知渠道。我们建议您创建多种类型的通知渠道。如需了解详情,请参阅创建和管理通知渠道。
为拨测指定至少三个检查工具。 拨测区域
USA包含USA_OREGON、USA_IOWA和USA_VIRGINIA区域。每个USA_*区域都有一个检查工具,USA包含所有三个检查工具。其他拨测区域EUROPE、SOUTH_AMERICA和ASIA_PACIFIC各有一个检查工具。如果您在使用 Google Cloud 控制台时选择全球,或者在使用 API 时选择
REGION_UNSPECIFIED,则系统会从所有拨测区域发出拨测。-
Select the tab for how you plan to use the samples on this page:
Console
When you use the Google Cloud console to access Google Cloud services and APIs, you don't need to set up authentication.
gcloud
In the Google Cloud console, activate Cloud Shell.
At the bottom of the Google Cloud console, a Cloud Shell session starts and displays a command-line prompt. Cloud Shell is a shell environment with the Google Cloud CLI already installed and with values already set for your current project. It can take a few seconds for the session to initialize.
Terraform
如需在本地开发环境中使用本页面上的 Terraform 示例,请安装并初始化 gcloud CLI,然后使用您的用户凭证设置应用默认凭证。
安装 Google Cloud CLI。
如果您使用的是外部身份提供方 (IdP),则必须先使用联合身份登录 gcloud CLI。
If you're using a local shell, then create local authentication credentials for your user account:
gcloud auth application-default login
You don't need to do this if you're using Cloud Shell.
If an authentication error is returned, and you are using an external identity provider (IdP), confirm that you have signed in to the gcloud CLI with your federated identity.
如需了解详情,请参阅 Google Cloud 身份验证文档中的为本地开发环境设置 ADC。
C#
如需在本地开发环境中使用本页面上的 .NET 示例,请安装并初始化 gcloud CLI,然后使用您的用户凭证设置应用默认凭证。
安装 Google Cloud CLI。
如果您使用的是外部身份提供方 (IdP),则必须先使用联合身份登录 gcloud CLI。
If you're using a local shell, then create local authentication credentials for your user account:
gcloud auth application-default login
You don't need to do this if you're using Cloud Shell.
If an authentication error is returned, and you are using an external identity provider (IdP), confirm that you have signed in to the gcloud CLI with your federated identity.
Google Cloud
Go
如需在本地开发环境中使用本页面上的 Go 示例,请安装并初始化 gcloud CLI,然后使用您的用户凭证设置应用默认凭证。
安装 Google Cloud CLI。
如果您使用的是外部身份提供方 (IdP),则必须先使用联合身份登录 gcloud CLI。
If you're using a local shell, then create local authentication credentials for your user account:
gcloud auth application-default login
You don't need to do this if you're using Cloud Shell.
If an authentication error is returned, and you are using an external identity provider (IdP), confirm that you have signed in to the gcloud CLI with your federated identity.
Google Cloud
Java
如需在本地开发环境中使用本页面上的 Java 示例,请安装并初始化 gcloud CLI,然后使用您的用户凭证设置应用默认凭证。
安装 Google Cloud CLI。
如果您使用的是外部身份提供方 (IdP),则必须先使用联合身份登录 gcloud CLI。
If you're using a local shell, then create local authentication credentials for your user account:
gcloud auth application-default login
You don't need to do this if you're using Cloud Shell.
If an authentication error is returned, and you are using an external identity provider (IdP), confirm that you have signed in to the gcloud CLI with your federated identity.
Google Cloud
Node.js
如需在本地开发环境中使用本页面上的 Node.js 示例,请安装并初始化 gcloud CLI,然后使用您的用户凭证设置应用默认凭证。
安装 Google Cloud CLI。
如果您使用的是外部身份提供方 (IdP),则必须先使用联合身份登录 gcloud CLI。
If you're using a local shell, then create local authentication credentials for your user account:
gcloud auth application-default login
You don't need to do this if you're using Cloud Shell.
If an authentication error is returned, and you are using an external identity provider (IdP), confirm that you have signed in to the gcloud CLI with your federated identity.
Google Cloud
PHP
如需在本地开发环境中使用本页面上的 PHP 示例,请安装并初始化 gcloud CLI,然后使用您的用户凭证设置应用默认凭证。
安装 Google Cloud CLI。
如果您使用的是外部身份提供方 (IdP),则必须先使用联合身份登录 gcloud CLI。
If you're using a local shell, then create local authentication credentials for your user account:
gcloud auth application-default login
You don't need to do this if you're using Cloud Shell.
If an authentication error is returned, and you are using an external identity provider (IdP), confirm that you have signed in to the gcloud CLI with your federated identity.
如需了解详情,请参阅 Google Cloud 身份验证文档中的为本地开发环境设置 ADC。
Python
如需在本地开发环境中使用本页面上的 Python 示例,请安装并初始化 gcloud CLI,然后使用您的用户凭证设置应用默认凭证。
安装 Google Cloud CLI。
如果您使用的是外部身份提供方 (IdP),则必须先使用联合身份登录 gcloud CLI。
If you're using a local shell, then create local authentication credentials for your user account:
gcloud auth application-default login
You don't need to do this if you're using Cloud Shell.
If an authentication error is returned, and you are using an external identity provider (IdP), confirm that you have signed in to the gcloud CLI with your federated identity.
Google Cloud
Ruby
如需在本地开发环境中使用本页面上的 Ruby 示例,请安装并初始化 gcloud CLI,然后使用您的用户凭证设置应用默认凭证。
安装 Google Cloud CLI。
如果您使用的是外部身份提供方 (IdP),则必须先使用联合身份登录 gcloud CLI。
If you're using a local shell, then create local authentication credentials for your user account:
gcloud auth application-default login
You don't need to do this if you're using Cloud Shell.
If an authentication error is returned, and you are using an external identity provider (IdP), confirm that you have signed in to the gcloud CLI with your federated identity.
Google Cloud
REST
如需在本地开发环境中使用本页面上的 REST API 示例,请使用您提供给 gcloud CLI 的凭证。
安装 Google Cloud CLI。
如果您使用的是外部身份提供方 (IdP),则必须先使用联合身份登录 gcloud CLI。
如需了解详情,请参阅 Google Cloud 身份验证文档中的使用 REST 时进行身份验证。
创建拨测
本部分介绍如何创建和配置正常运行时间检查。
如需为至少配置了一个 TCP 或 HTTP/s 端口的外部负载均衡器创建拨测,您可以按照以下说明操作。或者,您也可以前往相应服务的服务详情页面,然后点击创建拨测。如果您从服务详情页面开始,系统会预填充服务专属字段。
控制台
如需使用 Google Cloud 控制台创建拨测,请执行以下操作:
-
在 Google Cloud 控制台中,前往
 拨测页面:
拨测页面:如果您使用搜索栏查找此页面,请选择子标题为监控的结果。
- 在 Google Cloud 控制台的工具栏中,选择您的 Google Cloud 项目。对于 App Hub 配置,请选择 App Hub 宿主项目或已启用应用的文件夹的管理项目。
点击创建拨测。
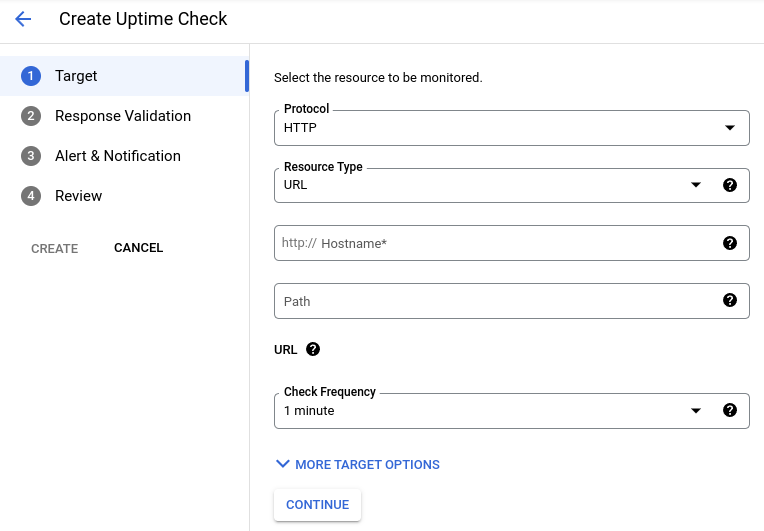
指定正常运行时间检查的目标:
选择协议。您可以选择 HTTP、HTTPS 或 TCP。
选择以下资源类型之一:
- 网址:任何 IPv4 地址或主机名。路径和端口分开输入。
- Kubernetes LoadBalancer Service:LoadBalancer 类型的 Kubernetes Service。
- Instance:Compute Engine 或 AWS EC2 实例。
- App Engine:App Engine 应用(模块)。
- Elastic Load Balancer:AWS 负载平衡器。
输入特定于协议的字段:
对于 TCP 检查,请输入端口。
对于 HTTP 和 HTTPS 检查,您可以输入主机或资源中的路径。使用这些协议的所有正常运行时间检查都会向
http://target/path发送请求。在此表达式中,对于网址资源,target是主机名或 IP 地址。对于 App Engine 资源,target是派生自服务名称的主机名。对于实例和负载均衡器资源,target是根据您为资源或资源组提供的名称派生的 IP 地址。如果您将
path字段留空或将值设置为/,则将向http://target/发出请求。例如,要向网址资源
example.com/tester发出拨测,请将主机名字段设置为example.com,将路径字段设置为/tester。假设您已使用支持
/和/hello的调度程序将服务器部署到 App Engine。如需向“/”处理程序发出拨测,请将路径字段留空。如需向/hello处理程序发出拨测,请将路径字段的值设置为/hello。
输入特定于资源的字段:
对于网址资源,请在主机名字段中输入主机名。例如,输入
example.com。对于 App Engine 资源,请在服务字段中输入服务名称。
对于 Elastic Load Balancer 和实例资源,请填写适用范围字段,如下所示:
- 如需向单个实例或负载均衡器发出拨测,请选择单个,然后使用菜单选择特定实例或负载均衡器。
- 要向 Monitoring 组发出拨测,请选择组,然后使用菜单选择组名称。
可选:如需设置拨测的执行频率,请使用检查频率字段。
可选:如需选择检查工具区域,或为 HTTP 和 HTTPS 检查配置 SSL 证书、身份验证、标头和端口,请点击更多目标选项:
- 区域:选择正常运行时间检查将从中接收请求的区域。拨测必须至少有 3 个检查工具。除美国有 3 个检查工具外,其他所有区域都只有 1 个检查工具。默认设置(全球)包括所有区域。
- ICMP ping:将拨测配置为最多发送 3 条 ping 命令。如需了解详情,请参阅使用 ICMP ping。
- 请求方法:对于 HTTP 检查,请选择请求方法。
- 正文:对于 HTTP POST 检查,请输入网址编码正文;您必须自行进行编码。对于其他所有检查,请将此字段留空。
- Host 标头:填写此字段以检查虚拟主机。此字段不适用于 TCP 检查。
- Port:指定端口号。
- 自定义标头:提供自定义标头,并根据需要对其进行加密。加密后,表单中标头的值会被隐藏。 对您不想向他人显示的身份验证相关标头使用加密。
身份验证:这些值将作为 Authorization 标头发送。此字段不适用于 TCP 检查。
根据需要选择下列其中一项:
SSL 证书验证:如果您为网址资源选择了 HTTPS,则默认情况下,服务会尝试通过 HTTPS 连接并验证 SSL 证书。如果网址的证书无效,则拨测会失败。导致证书无效的原因包括:
- 证书已过期
- 自签名证书
- 证书域名不匹配
- 使用授权信息访问 (AIA) 扩展程序的证书。
如需强制执行 HTTPS 拨测以验证 SSL 证书,请选择验证 SSL 证书。
要停用 SSL 证书验证,请清除验证 SSL 证书。
如果您拥有带 AIA 扩展程序的 SSL 证书,则必须停用 SSL 证书验证。这些类型的证书不受支持,且不会通过验证序列。通常,错误消息为“在 10000 毫秒内以 SSL 握手错误响应”。
您可以使用指标
monitoring.googleapis.com/uptime_check/time_until_ssl_cert_expires创建在证书到期前向您发送通知的提醒政策。如需了解详情,请参阅示例政策:正常运行时间检查政策。选中验证 SSL 证书复选框。
点击继续并配置响应要求。本部分中的所有设置均具有默认值:
如需更改拨测的超时期限,请使用响应超时字段。如果在此期限内未收到多个位置的响应,则拨测会失败。
如需配置拨测以执行内容匹配,请确保切换标签为已启用内容匹配功能:
- 从选项菜单中选择响应内容匹配类型。此字段用于确定如何将响应内容与返回的数据进行比较。例如,假设响应内容为
abcd,且内容匹配类型为包含。只有在响应数据包含abcd时,拨测才会成功。如需了解详情,请参阅验证响应数据。 - 输入响应内容。响应内容必须是长度不超过 1024 个字节的字符串。在 API 中,此字段是
ContentMatcher对象。
- 从选项菜单中选择响应内容匹配类型。此字段用于确定如何将响应内容与返回的数据进行比较。例如,假设响应内容为
为了防止由于拨测而导致系统创建日志条目,请清除日志检查失败。
对于 HTTP 拨测,请配置可接受的响应代码。默认情况下,HTTP 拨测会将任何
2xx响应标记为成功响应。
点击继续并配置通知。
如需在拨测失败时收到通知,请创建提醒政策并为该政策配置通知渠道:
- 可选:更新提醒政策的名称。
- 可选:在时长字段中,选择拨测必须失败多长时间才发送通知。默认情况下,当至少两个区域报告拨测失败且拨测失败的时长至少为 1 分钟时,系统会发送通知。
在标有通知渠道的框中,点击 arrow_drop_down 菜单,选择要添加的渠道,然后点击确定。
在菜单中,系统会针对每种渠道类型按字母顺序将通知渠道分组。
如果您不想创建提醒政策,请确保切换按钮对应的文本为不创建提醒。
点击继续并完成拨测:
为拨测输入一个描述性标题。
可选:如需为拨测添加用户定义的标签,请执行以下操作:
- 点击expand_more 显示用户标签。
- 在键字段中,输入标签的名称。标签名称必须以小写字母开头,可以包含小写字母、数字、下划线和短划线。例如,输入
severity。 - 在值字段中,为标签输入值。标签值可以包含小写字母、数字、下划线和短划线。例如,输入
critical。 - 对于每个附加标签,请点击添加用户标签,然后输入标签的键和值。
要验证您的正常运行时间检查配置,请点击测试。 如果结果与您的预期不符,请参阅检查失败,更正您的配置,然后重复验证步骤。
点击创建。如果您选择创建,但未填充必填字段,系统会显示错误消息。
gcloud
如需创建拨测,请运行
gcloud monitoring uptime create命令:gcloud monitoring uptime create DISPLAY_NAME REQUIRED_FLAGS OPTIONAL_FLAGS --project=PROJECT_ID在运行上述命令之前,请替换以下内容:
PROJECT_ID:项目的标识符。 对于 App Hub 配置,请选择 App Hub 宿主项目或已启用应用的文件夹的管理项目。
DISPLAY_NAME:拨测的名称。
REQUIRED_FLAGS:配置以指定拨测探测的资源。例如,以下命令会创建一项拨测,用于测试特定项目的网址 EXAMPLE.com:
gcloud monitoring uptime create DISPLAY_NAME \
--resource-labels=host=EXAMPLE.com,project_id=PROJECT_ID \
--resource-type=uptime-url
上一条命令为资源类型
uptime-url所需的每个标签指定了值。OPTIONAL_FLAGS:配置这些标志以替换默认值。例如,如果协议不是
http,则必须设置--protocol标志。
Terraform
如需了解如何应用或移除 Terraform 配置,请参阅基本 Terraform 命令。 如需了解详情,请参阅 Terraform 提供程序参考文档。
如需创建拨测以及用于监控该检查的提醒政策,请执行以下操作:
- 为您的项目安装和配置 Terraform。对于 App Hub 配置,请选择 App Hub 宿主项目或已启用应用的文件夹的管理项目。
修改 Terraform 配置文件并添加
google_monitoring_uptime_check_config资源,然后应用该配置文件。以下示例展示了检查公共网址的配置:
resource "google_monitoring_uptime_check_config" "example" {
    display_name = "example"
    timeout      = "60s"

    http_check {
        port = "80"
        request_method = "GET"
    }

    monitored_resource {
        type = "uptime_url"
        labels = {
            project_id = "PROJECT_ID"
            host="EXAMPLE.com"
        }
    }

    checker_type = "STATIC_IP_CHECKERS"
}
在上述表达式中:
- PROJECT_ID 是您的项目 ID。 对于 App Hub 配置,请选择 App Hub 宿主项目或已启用应用的文件夹的管理项目。
- EXAMPLE.com 是主机网址。
可选:创建通知渠道和提醒政策:
以下步骤使用 Google Cloud 控制台创建通知渠道和提醒政策。这种方法可确保提醒政策仅监控拨测生成的数据。
要创建通知渠道,请执行以下操作:
如需创建提醒政策,请执行以下操作:
您可以通过向配置文件添加
google_monitoring_alert_policy资源并应用新配置来创建提醒政策。
C#
如需向 Monitoring 进行身份验证,请设置应用默认凭据。 如需了解详情,请参阅为本地开发环境设置身份验证。
Java
如需向 Monitoring 进行身份验证,请设置应用默认凭证。 如需了解详情,请参阅为本地开发环境设置身份验证。
Go
如需向 Monitoring 进行身份验证,请设置应用默认凭证。 如需了解详情,请参阅为本地开发环境设置身份验证。
Node.js
如需向 Monitoring 进行身份验证,请设置应用默认凭证。 如需了解详情,请参阅为本地开发环境设置身份验证。
PHP
如需向 Monitoring 进行身份验证,请设置应用默认凭证。 如需了解详情,请参阅为本地开发环境设置身份验证。
Python
如需向 Monitoring 进行身份验证,请设置应用默认凭证。 如需了解详情,请参阅为本地开发环境设置身份验证。
Ruby
如需向 Monitoring 进行身份验证,请设置应用默认凭证。 如需了解详情,请参阅为本地开发环境设置身份验证。
REST
如需创建拨测,请调用
projects.uptimeCheckConfigs.create方法。设置该方法的参数,如下所示:parent:必需。用于创建拨测的项目。对于 App Hub 配置,请选择 App Hub 宿主项目或已启用应用的文件夹的管理项目。此字段采用以下格式:
projects/PROJECT_ID请求正文必须包含新正常运行时间检查的
UptimeCheckConfig对象。本页面提供了几个字段的信息。如需查看有关此对象及其字段的完整文档,请参阅UptimeCheckConfig:将配置对象的
name字段留空。系统会在构造响应配置对象时设置此字段。如果要配置 HTTP 或 HTTPS 检查,则必须填充
UptimeCheckConfig对象的HttpCheck字段。在此对象中,将requestMethod字段设置为GET或POST。如果省略此字段或将其设置为METHOD_UNSPECIFIED,则发出GET请求。如果您要配置
POST请求,则填写contentType、customContentType(可选)和body字段。
create方法会返回新配置的UptimeCheckConfig对象。如果创建的正常运行时间配置未按照预期方式工作,请参阅本页面中的检查失败部分。
正常运行时间检查结果最长可能会延迟 5 分钟才开始流入 Monitoring。在此期间,正常运行时间检查信息中心会将状态报告为“no data available”。
使用 ICMP ping
为帮助您排查公开拨测失败问题,您可以将拨测配置为在检查期间发送最多 3 条 ICMP ping 命令。这些 ping 命令可以帮助您区分由应用中的网络连接问题和超时等原因导致的失败。
默认情况下,拨测不会发送 ping 命令。每条 ping 命令都会为拨测增加一些延迟时间。非公开拨测无法发送 ping 命令。
当公开拨测失败时,ping 命令的结果会写入 Cloud Logging 日志。如果 ping 命令失败,系统会将以下字段添加到日志条目中的
httpRequest字段:rtt_usec:每个未成功的 ping 请求的往返时间。unreachable_count:返回状态代码ICMP_DEST_UNREACH的 ping 请求数量。no_answer_count:超时且未返回响应的 ping 请求数。
成功的拨测的 ping 命令结果未记录。
配置 ping 命令
每项拨测配置都包含一个
HttpCheck对象或一个TcpCheck对象。这两个对象都包含pingConfig字段。使用此字段指定要为每次检查添加的 ICMP ping 命令的数量,最多 3 条。默认情况下,系统不会发送 ping 命令。如需配置 ping 命令,请执行以下操作之一:
使用 Google Cloud 控制台时,展开更多目标选项,然后在 ICMP Ping 字段中输入值。
使用 Cloud Monitoring API 时,请使用
PingConfig对象,其结构如下所示:{ "pingsCount": integer }
验证正常运行时间检查
在 Google Cloud 控制台中创建拨测时,您可以先测试配置,然后再保存。
成功的检查
如果满足以下条件,则拨测会成功:
- HTTP 状态符合您选择的条件。
- 响应不包含所需内容,或者在响应中成功搜索到所需内容。
失败的检查
以下是导致正常运行时间检查失败的原因:
- 连接错误 - 拒绝 (Connection Error - Refused):如果您使用的是默认的 HTTP 连接类型,请检查您是否安装了响应 HTTP 请求的网络服务器。如果您尚未安装网络服务器,则新实例可能会发生连接错误;请参阅 Compute Engine 快速入门。 如果您使用的是 HTTPS 连接类型,则可能必须执行其他配置步骤。如需了解防火墙问题,请参阅列出拨测服务器 IP 地址。
- Name or service not found:主机名可能不正确。
- 403 Forbidden:服务向正常运行时间检查工具返回错误代码。例如,在 Amazon Linux 中,默认的 Apache 网络服务器配置会返回此代码;但在其他一些 Linux 版本中,该网络服务器配置会返回代码 200 (Success)。请参阅 Amazon Linux 的 LAMP 教程或您 Web 服务器的文档。
- 404 Not found:路径可能不正确。
408 Request timeout 或无响应:端口号可能不正确、服务可能未运行、服务可能无法访问或者超时值可能太小。检查您的防火墙是否允许来自正常运行服务器的流量;请参阅列出拨测服务器 IP 地址。超时限制是响应验证选项的一部分。
由于网络拥塞,可能会发生请求超时。例如,由于临时网络拥塞,您可能会发现一个检查器失败,但所有其他检查器都成功。如果提醒政策使用默认配置,单个检查器的失败不会导致系统发出通知。
如果您的拨测已配置为发送 ping 命令,则针对失败的拨测的 ping 命令结果会写入 Cloud Logging。如需了解详情,请参阅使用 ICMP ping。
后续步骤
如未另行说明,那么本页面中的内容已根据知识共享署名 4.0 许可获得了许可,并且代码示例已根据 Apache 2.0 许可获得了许可。有关详情,请参阅 Google 开发者网站政策。Java 是 Oracle 和/或其关联公司的注册商标。
最后更新时间 (UTC):2025-09-03。
-