This page describes the metrics and dashboards available for monitoring startup latency of Google Kubernetes Engine (GKE) workloads and the underlying cluster nodes. You can use the metrics to track, troubleshoot, and reduce startup latency.
This page is for Platform admins and operators who need to monitor and optimize startup latency of their workloads. To learn more about common roles that we reference in Google Cloud content, see Common GKE user roles and tasks.
Overview
Startup latency significantly impacts how your application responds to traffic spikes, how quickly its replicas recover from disruptions, and how efficient the operating costs of your clusters and workloads can be. Monitoring the startup latency of your workloads can help you detect latency degradations and track the impact of workload and infrastructure updates on the startup latency.
Optimizing workload startup latency has the following benefits:
- Lowers the response latency of your service to users during traffic spikes.
- Reduces the excess serving capacity that's needed to absorb demand spikes while new replicas are created.
- Reduces the idle time of resources that are already deployed and waiting for the remaining resources to start up during batch computations.
Before you begin
Before you start, make sure that you have performed the following tasks:
- Enable the Google Kubernetes Engine API. Enable Google Kubernetes Engine API
- If you want to use the Google Cloud CLI for this task,
install and then
initialize the
gcloud CLI. If you previously installed the gcloud CLI, get the latest
version by running the
gcloud components updatecommand. Earlier gcloud CLI versions might not support running the commands in this document.
Enable the Cloud Logging and Cloud Monitoring APIs.
Roles required to enable APIs
To enable APIs, you need the Service Usage Admin IAM role (
roles/serviceusage.serviceUsageAdmin), which contains theserviceusage.services.enablepermission. Learn how to grant roles.
Requirements
To view metrics and dashboards for startup latency of workloads, your GKE cluster must meet the following requirements:
- You must have GKE version 1.31.1-gke.1678000 or later.
- You must configure collection of system metrics.
- You must configure collection of system logs.
- Enable kube state metrics with
the
PODcomponent on your clusters to view the Pod and container metrics.
Required roles and permissions
To get the permissions that you need to enable log generation and to access and process logs, ask your administrator to grant you the following IAM roles:
-
View GKE clusters, nodes and workloads:
Kubernetes Engine Viewer (
roles/container.viewer) on your project -
Access startup latency metrics and view the dashboards:
Monitoring Viewer (
roles/monitoring.viewer) on your project -
Access logs with latency information, such as Kubelet image pull events, and view them in Logs Explorer and Log Analytics:
Logs Viewer (
roles/logging.viewer) on your project
For more information about granting roles, see Manage access to projects, folders, and organizations.
You might also be able to get the required permissions through custom roles or other predefined roles.
Startup latency metrics
Startup latency metrics are included in GKE system metrics and are exported to Cloud Monitoring in the same project as the GKE cluster.
The Cloud Monitoring metric names in this table must be prefixed with
kubernetes.io/. That prefix has been omitted from the
entries in the table.
| Metric type (Resource hierarchy levels) Display name |
|
|---|---|
|
Kind, Type, Unit
Monitored resources |
Description Labels |
pod/latencies/pod_first_ready
(project)
Pod first ready latency |
|
GAUGE, Double, s
k8s_pod |
The Pod end-to-end startup latency (from Pod Created to Ready), including image pulls. Sampled every 60 seconds. |
node/latencies/startup
(project)
Node startup latency |
|
GAUGE, INT64, s
k8s_node |
The total startup latency of the node, from GCE instance's CreationTimestamp to Kubernetes node ready for the first time. Sampled every 60 seconds.accelerator_family: a classification of nodes based on hardware accelerators: gpu, tpu, cpu.
kube_control_plane_available: whether the node creation request was received when KCP (kube control plane) was available.
|
autoscaler/latencies/per_hpa_recommendation_scale_latency_seconds
(project)
Per HPA recommendation scale latency |
|
GAUGE, DOUBLE, s
k8s_scale |
Horizontal Pod Autoscaler (HPA) scaling recommendation latency (time between metrics being created and corresponding scaling recommendation being applied to the apiserver) for the HPA target. Sampled every 60 seconds. After sampling, data is not visible for up to 20 seconds.metric_type: the type of metric source. It should be one of "ContainerResource", "External", "Object", "Pods" or "Resource".
|
View the Startup Latency dashboard for workloads
The Startup Latency dashboard for workloads is only available for Deployments. To view startup latency metrics for Deployments, perform the following steps in the Google Cloud console:
Go to the Workloads page.
To open the Deployment details view, click the name of the workload that you want to inspect.
Click the Observability tab.
Select Startup Latency from the menu on the left.
View startup latency distribution of Pods
The startup latency of Pods refers to the total startup latency, including image
pulls, which measures the time from the Created status of the Pod until the
Ready status. You can assess the startup latency of Pods by using the
following two charts:
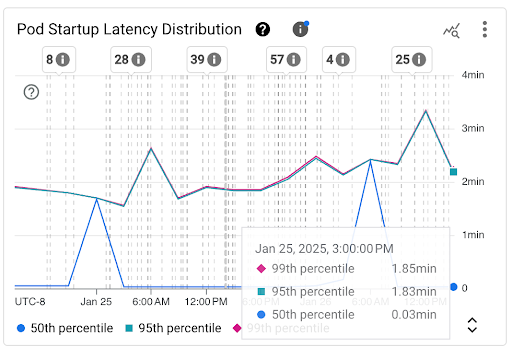
Pod Startup Latency Distribution chart: this chart shows the startup latency percentiles of Pods (fiftieth percentile, ninety-fifth percentile, and ninety-ninth percentile) that are calculated based on the observations of Pod startup events over fixed 3-hour time intervals, for example, 12:00 AM-3:00 AM and 3:00 AM-6:00 AM. You can use this chart for the following purposes:
- Understand your baseline Pod startup latency.
- Identify changes in Pod startup latency over time.
- Correlate changes in Pod startup latency with recent events, such as Workload Deployments or Cluster Autoscaler events. You can select the events in the Annotations list at the top of the dashboard.
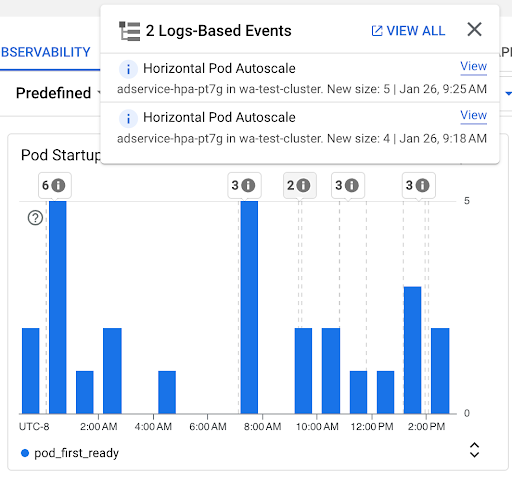
Pod Startup Count chart: this chart shows the count of Pods that were started during the selected time intervals. You can use this chart for the following purposes:
- Understand the Pod sample sizes that are used to calculate the percentiles of Pod startup latency distribution for a given time interval.
- Understand the causes of Pod starts, such as Workload Deployments or Horizontal Pod Autoscaler events. You can select the events in the Annotations list at the top of the dashboard.
View startup latency of individual Pods
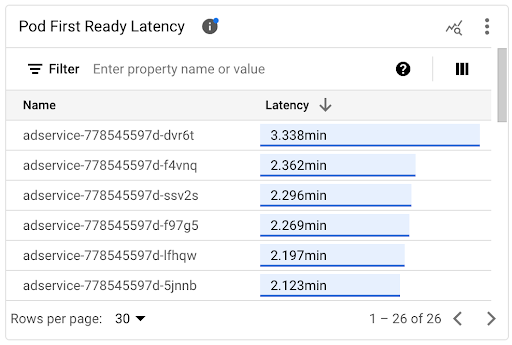
You can view the startup latency of individual Pods on the Pod First Ready Latency timeline chart and the associated list.
- Use the Pod First Ready Latency timeline chart to correlate individual Pod starts with recent events, such as Horizontal Pod Autoscaler or Cluster Autoscaler events. You can select these events in the Annotations list at the top of the dashboard. This chart helps you determine potential causes for any changes in startup latency compared to other Pods.
- Use the Pod First Ready Latency list to identify individual Pods that took the most or the least time to start. You can sort the list by the Latency column. When you identify Pods that have the highest startup latency, you can troubleshoot latency degradation by correlating the Pod start events with other recent events.
You can find out when an individual Pod was created by looking at the value in
the timestamp field in a corresponding Pod creation event. To see the
timestamp field, run the following query in
Logs Explorer:
   log_id("cloudaudit.googleapis.com/activity") AND
   protoPayload.methodName="io.k8s.core.v1.pods.create" AND
   resource.labels.project_id=PROJECT_ID AND
   resource.labels.cluster_name=CLUSTER_NAME AND
   resource.labels.location=CLUSTER_LOCATION AND
   protoPayload.response.metadata.namespace=NAMESPACE AND
   protoPayload.response.metadata.name=POD_NAME
To list all Pod creation events for your workload, use the following filter
in the preceding query:
protoPayload.response.metadata.name=~"POD_NAME_PREFIX-[a-f0-9]{7,10}-[a-z0-9]{5}"
When you compare the latencies of individual Pods, you can test the impact of various configurations on Pod startup latency and identify an optimal configuration based on your requirements.
Determine Pod scheduling latency
Pod scheduling latency is the amount of time between when a Pod was created and when the Pod was scheduled on a node. Pod scheduling latency contributes to a Pod's end-to-end startup time, and is calculated by subtracting the timestamps of a Pod scheduling event and a Pod creation request.
You can find a timestamp of an individual Pod scheduling event from the
jsonPayload.eventTime field in a corresponding Pod scheduling event. To see
the jsonPayload.eventTime field, run the following query in
Logs Explorer:
  log_id("events")
  jsonPayload.reason="Scheduled"
  resource.type="k8s_pod"
  resource.labels.project_id=PROJECT_ID
  resource.labels.location=CLUSTER_LOCATION
  resource.labels.cluster_name=CLUSTER_NAME
  resource.labels.namespace_name=NAMESPACE
  resource.labels.pod_name=POD_NAME
To list all Pod scheduling events for your workload, use the following filter
in the preceding query:
resource.labels.pod_name=~"POD_NAME_PREFIX-[a-f0-9]{7,10}-[a-z0-9]{5}"
View image pull latency
Container image pull latency contributes to Pod startup latency in scenarios when the image is not yet available on the node or the image needs to be refreshed. When you optimize image pull latency, you reduce your workload startup latency during cluster scale-out events.
You can view the Kubelet Image Pull Events table to see when the workload container images were pulled and how long the process took.
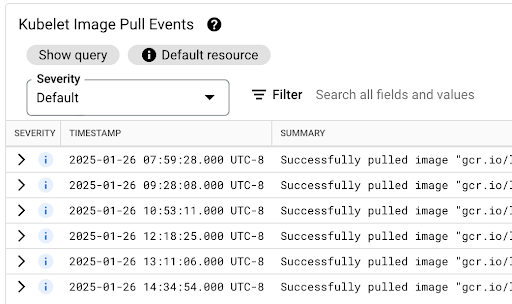
The image pull latency is available in the jsonPayload.message field, which
contains a message like the following:
"Successfully pulled image "gcr.io/example-project/image-name" in 17.093s (33.051s including waiting). Image size: 206980012 bytes."
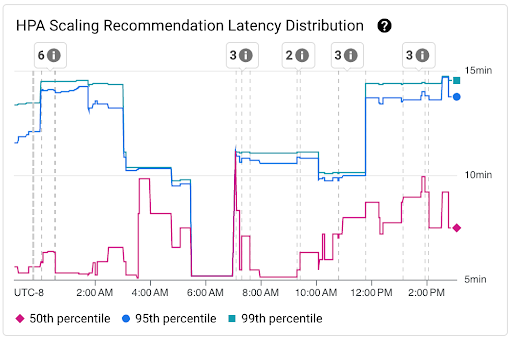
View the latency distribution of HPA scaling recommendations
The latency of Horizontal Pod Autoscaler (HPA) scaling recommendations for the HPA target is the amount of time between when the metrics are created and when the corresponding scaling recommendation is applied to the API server. When you optimize HPA scaling recommendation latency, you reduce your workload startup latency during scale-out events.
HPA scaling can be viewed on the following two charts:
HPA Scaling Recommendation Latency Distribution chart: this chart shows the percentiles of HPA scaling recommendation latency (fiftieth percentile, ninety-fifth percentile, and ninety-ninth percentile) that are calculated based on the observations of HPA scaling recommendations over trailing 3-hour time intervals. You can use this chart for the following purposes:
- Understand your baseline HPA scaling recommendation latency.
- Identify changes in HPA scaling recommendation latency over time.
- Correlate changes in HPA scaling recommendation latency with recent events. You can select the events in the Annotations list at the top of the dashboard.
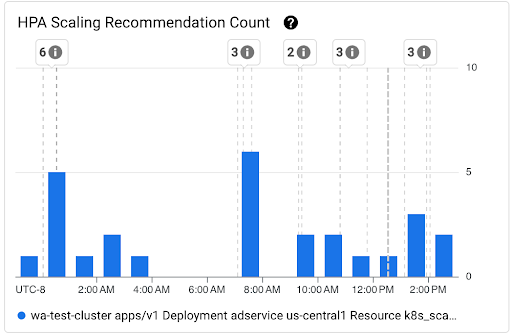
HPA Scaling Recommendation Count chart: this chart shows the count of HPA scaling recommendations that were observed during the selected time interval. Use the chart for the following tasks:
- Understand the HPA scaling recommendation sample sizes. The samples are used to calculate the percentiles in the distribution of latency for HPA scaling recommendations for a given time interval.
- Correlate HPA scaling recommendations with new Pod startup events and with Horizontal Pod Autoscaler events. You can select the events in the Annotations list at the top of the dashboard.
View scheduling issues for Pods
Pod scheduling issues might impact the end-to-end startup latency of your workload. To reduce the end-to-end startup latency of your workload, troubleshoot and reduce the number of these issues.
The following are the two charts available for tracking such issues:
- The Unschedulable/Pending/Failed Pods chart shows the counts of unschedulable, pending, and failed Pods over time.
- The Backoff/Waiting/Readiness Failed Containers chart shows the counts of containers in these states over time.
View startup latency dashboard for nodes
To view startup latency metrics for nodes, perform the following steps in the Google Cloud console:
Go to the Kubernetes Clusters page.
To open the Cluster details view, click the name of the cluster that you want to inspect.
Click the Observability tab.
From the menu on the left, select Startup Latency.
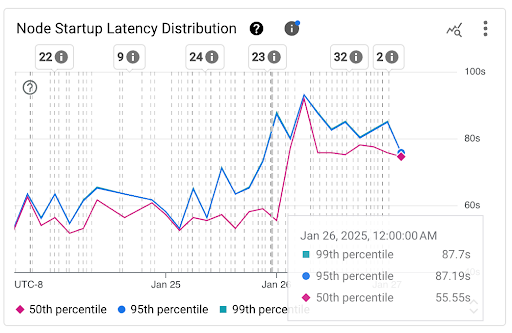
View distribution of startup latency of nodes
The startup latency of a node refers to the total startup latency, which
measures the time from the CreationTimestamp of the node until the
Kubernetes node ready status. Node startup latency can be viewed on the
following two charts:
Node Startup Latency Distribution chart: this chart shows the percentiles of node startup latency (fiftieth percentile, ninety-fifth percentile, and ninety-ninth percentile) that are calculated based on the observations of node startup events over fixed 3-hour time intervals, for example, 12:00 AM-3:00 AM and 3:00 AM-6:00 AM. You can use this chart for the following purposes:
- Understand your baseline node startup latency.
- Identify changes in node startup latency over time.
- Correlate changes in node startup latency with recent events, such as Cluster Updates or Node Pool Updates. You can select the events in the Annotations list at the top of the dashboard.
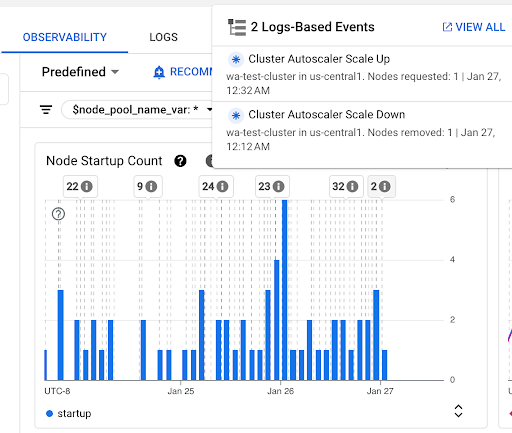
Node Startup Count chart: this chart shows the count of nodes started during the selected time intervals. You can use the chart for the following purposes:
- Understand the node sample sizes, used to calculate the node startup latency distribution percentiles for a given time interval.
- Understand the causes of node starts such as Node Pool Updates or Cluster Autoscaler events. You can select the events in the Annotations list at the top of the dashboard.
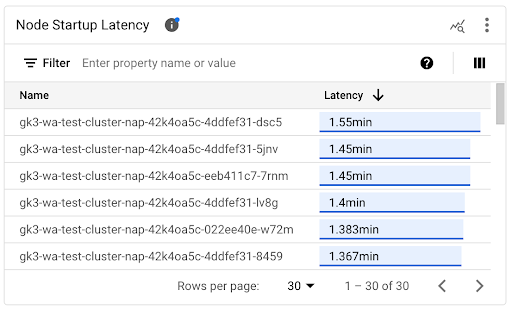
View startup latency of individual nodes
When you compare the latencies of individual nodes, you can test the impact of various node configurations on the node startup latency and identify an optimal configuration based on your requirements. You can view the startup latency of individual nodes on the Node Startup Latency timeline chart and the associated list.
Use the Node Startup Latency timeline chart to correlate individual node starts with recent events, such as Cluster Updates or Node Pool Updates. You can determine potential causes for changes in startup latency compared to other nodes. You can select the events in the Annotations list at the top of the dashboard.
Use the Node Startup Latency list to identify individual nodes that took the most or the least time to start. You can sort the list by the Latency column. When you identify nodes with the highest startup latency, you can troubleshoot latency degradation by correlating node start events with other recent events.
You can find out when an individual node was created by looking at the value of the
protoPayload.metadata.creationTimestamp field in a corresponding node creation
event. To see the protoPayload.metadata.creationTimestamp field, run the
following query in Logs Explorer:
   log_id("cloudaudit.googleapis.com/activity") AND
   protoPayload.methodName="io.k8s.core.v1.nodes.create" AND
   resource.labels.project_id=PROJECT_ID AND
   resource.labels.cluster_name=CLUSTER_NAME AND
   resource.labels.location=CLUSTER_LOCATION AND
   protoPayload.response.metadata.name=NODE_NAME
View startup latency in a node pool
If your node pools have different configurations, for example, to run different workloads, you might need to monitor node startup latency separately by node pools. When you compare node startup latencies across your node pools, you can get insights into how node configuration impacts node startup latency and consequently optimize latency.
By default, the Node Startup Latency dashboard shows the aggregated Startup
Latency Distribution and individual Node Startup Latencies across all node pools
in a cluster. To view node startup latency for a specific node pool, select the
name of the node pool by using the $node_pool_name_var filter located at the
top of the dashboard.
What's next
- Learn how to optimize Pod autoscaling based on metrics.
- Learn more about ways to reduce cold start latency on GKE.
- Learn how to reduce image pull latency with Image streaming.
- Learn about the surprising economics of Horizontal Pod Autoscaling tuning.
- Monitor your workloads with automatic application monitoring.