Dialogflow CX 主控台提供數據分析面板,可顯示各種檢視畫面,用於追蹤服務機器人成效資料。舉例來說,您可以追蹤升級事件、有許多不相符項目的網頁,以及有許多失敗事件的 webhook。您可以依日期範圍篩選每個檢視畫面。系統會每小時計算一次所有顯示的統計資料。
透過這些數據分析檢視畫面,您可以透過不同的對話路徑瞭解服務專員的成效,並採取修正措施來改善成效。
限制
對於大型代理程式,分析資料可能需要較長時間才能載入。
啟用互動記錄功能
數據分析工具會使用互動記錄中的資料。您可以使用「啟用互動記錄」代理程式設定,啟用及停用這項記錄功能。
開啟數據分析面板
如要開啟數據分析面板,請按照下列步驟操作:
- 前往 Dialogflow CX 主控台。
- 選擇專案。
- 選取代理程式。
- 選取「管理」分頁標籤。
- 按一下「數據分析」。
- 您也可以使用頂端附近的連結存取舊版 Analytics。
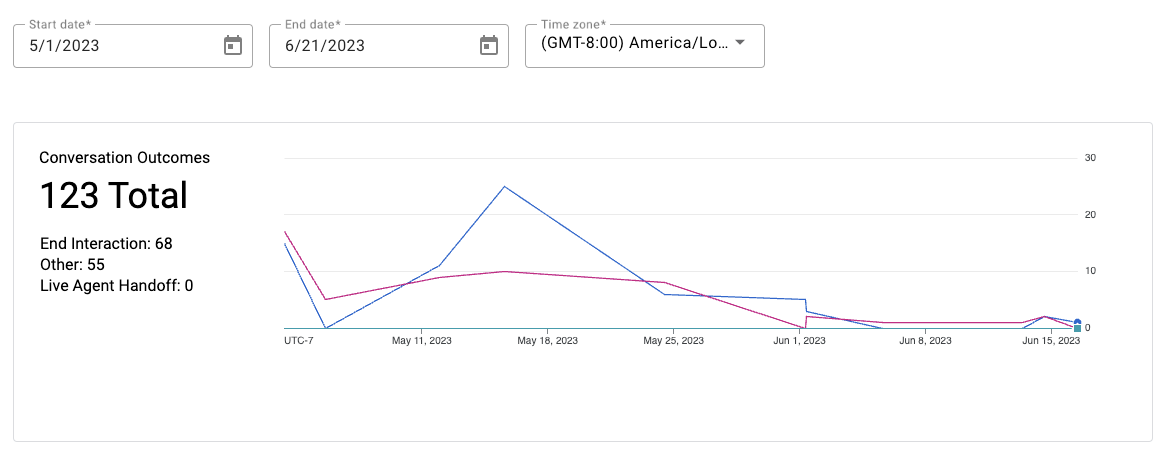
對話結果
這個檢視畫面會以時間序列圖的形式顯示特定對話結果的計數。
系統會顯示下列指標:
| X | 項目 |
|---|---|
| 結束互動 | 放棄的對話數量。 |
| 線上服務專員交接 | 要求人工提報的對話數量。 |
| 其他 | 萬一對話未交由真人服務專員處理,且未顯示在 END SESSION 頁面上,則會歸類為這個安全防護類別。舉例來說,如果使用者說「Hi」,然後立即關閉對話,對話就會歸類為 Other。 |
意圖提報
這個檢視畫面會顯示意圖表格,其中顯示人工升級次數最多的意圖。這項功能也會以時間序列圖表的形式,顯示所選意圖的升級趨勢。如果您已將特定意圖標示為主意圖,則可將檢視畫面限制為僅顯示這些意圖。
系統會顯示下列指標:
| X | 項目 |
|---|---|
| 工作階段 | 系統偵測到意圖的工作階段總數。 |
| 提報率 | 要求人工升級的工作階段百分比。 |
| 轉向 | 系統偵測到意圖的對話輪次數。每個對話可能有多個與單一意圖相符的項目。 |
| 提報主意圖 | 在意圖為最終主意圖的工作階段中,升轉要求的百分比。 |

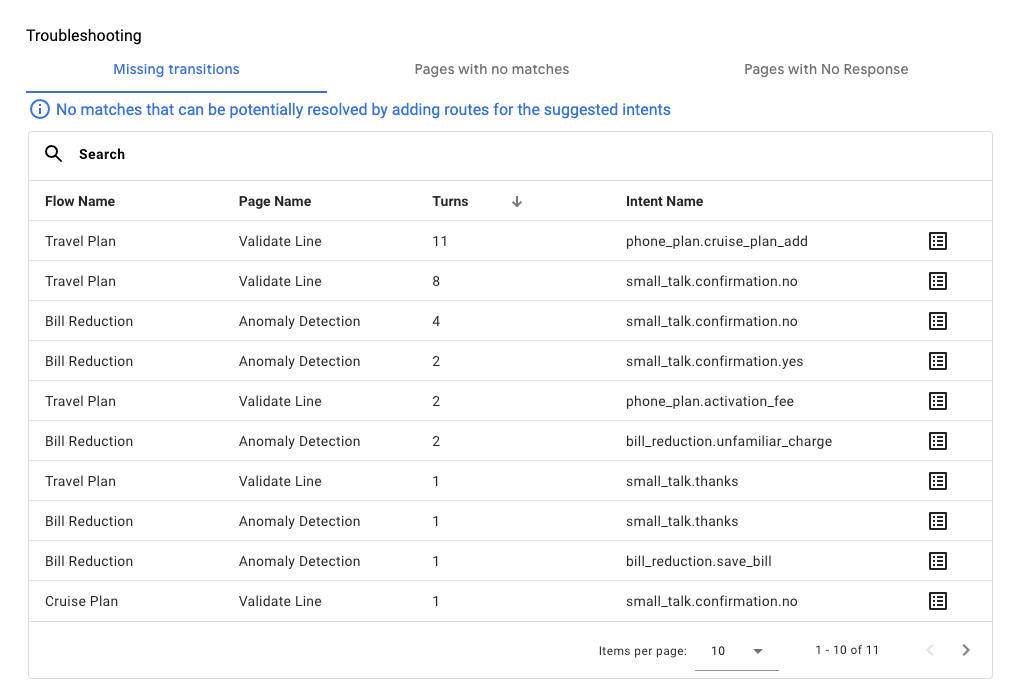
疑難排解
疑難排解部分包含多種檢視畫面,可協助您對流程和頁面進行常見問題的偵錯作業。
缺少轉場效果
這個檢視畫面會以表格形式提供網頁,其中包含應已比對但因缺少路徑而無法比對的現有意圖。
系統會顯示下列指標:
| X | 項目 |
|---|---|
| 意圖名稱 | 如果意圖名稱在範圍內,就會比對成功。 |
| 轉向 | 應符合意圖的對話輪次數。 |
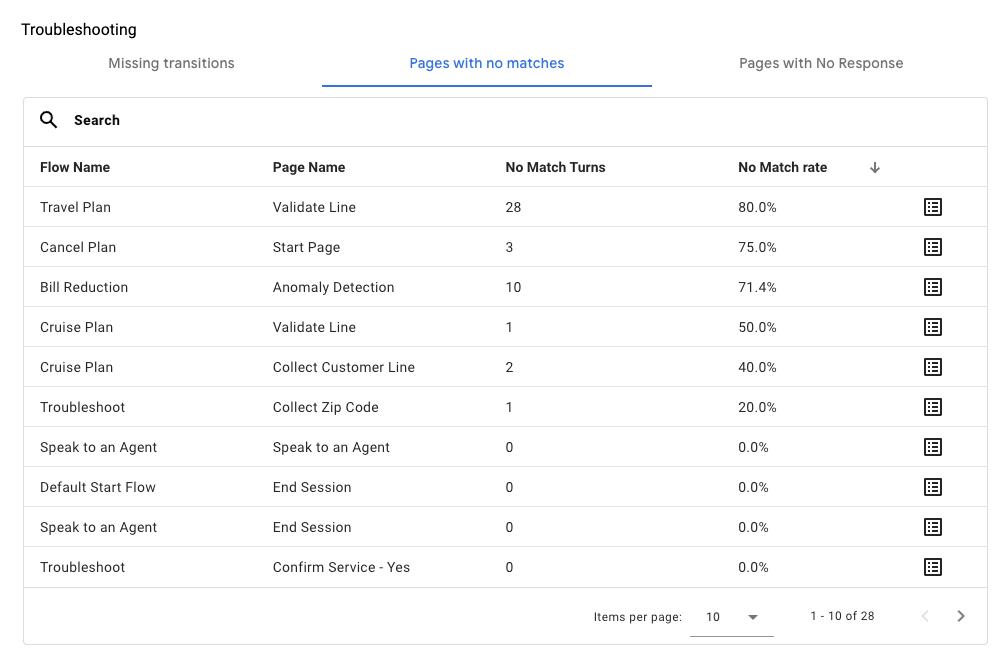
找不到相符項目的網頁
這個檢視畫面會以表格形式提供網頁,並依不符率排序。
系統會顯示下列指標:
| X | 項目 |
|---|---|
| 沒有媒合率 | 在所有對話轉換中,未找到相符網頁的百分比。 |
| 沒有相符的回合 | 導致頁面不相符的對話回合總數。 |
沒有回應的網頁
這個檢視畫面會以表格形式提供網頁,這些網頁未獲得服務專員回應。
系統會顯示下列指標:
| X | 項目 |
|---|---|
| 空白回應 | 網頁上沒有服務專員回應的互動次數。 |

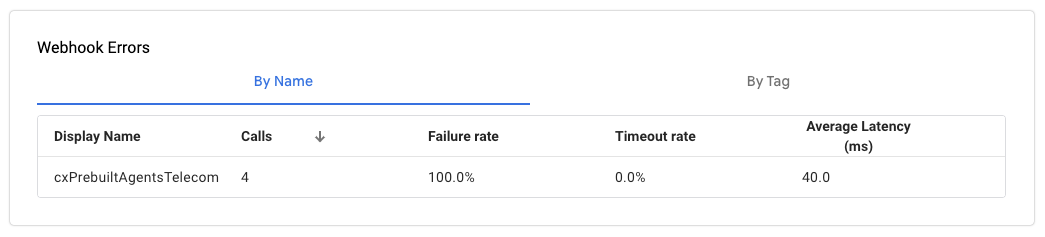
Webhook 錯誤
這個檢視畫面會以表格形式提供 webhook 錯誤。您可以依下列方式整理清單:
- 依名稱排序:依 Webhook 名稱排序。
- 依標記:依 webhook 標記排序。
| X | 項目 |
|---|---|
| 通話 | 呼叫 webhook 的次數。 |
| 失敗次數 | 不含逾時的 webhook 失敗次數。 |
| 逾時率 | 逾時的 Webhook 叫用百分比。 |
| 平均延遲時間 | Webhook 叫用作業的平均延遲時間。 |