このページでは、Cloud Monitoring ダッシュボードを使用して、使用可能な指標を表示し、カスタム ダッシュボードを作成して、アラートを設定する方法について説明します。
Datastore モードの Firestore の指標を表示する
Datastore モードの Firestore のさまざまな指標を表示してグラフを作成するには、 Google Cloud コンソールの Cloud Monitoring 内の Metrics Explorer を使用します。グラフの作成の詳細については、Metrics Explorer でグラフを作成するをご覧ください。
Cloud Monitoring ダッシュボードを設定する
Cloud Monitoring では、カスタム ダッシュボードを使用して、関連する情報を体系的に表示できます。たとえば、本番環境にあるプロジェクトのパフォーマンス指標やアラート ポリシーを表示するダッシュボードを作成できます。
カスタム ダッシュボードの設定の詳細については、カスタム ダッシュボードを管理するとダッシュボード ウィジェットを追加するをご覧ください。
エラー率をモニタリングする
モニタリング ダッシュボードを作成して、エラー率をモニタリングし、データベースの可用性を確保できます。可用性とは、データベースが予想される時間枠内で、正常なステータス コードで応答する率を指します。Datastore モードの Firestore の SLA には、有効なリクエストとして分類されるものの詳細が定義されています。
エラー率は、エラー レスポンスとなったリクエストの数を、送信されたリクエストの合計数で割ることによって求められます。
エラー率を計算するダッシュボードの例は、4xx または 5xx のエラー コードを持つ有効なリクエストの api/request_count と、すべての有効なリクエストの api/request_count の A/B 比率を計算することで作成できます。
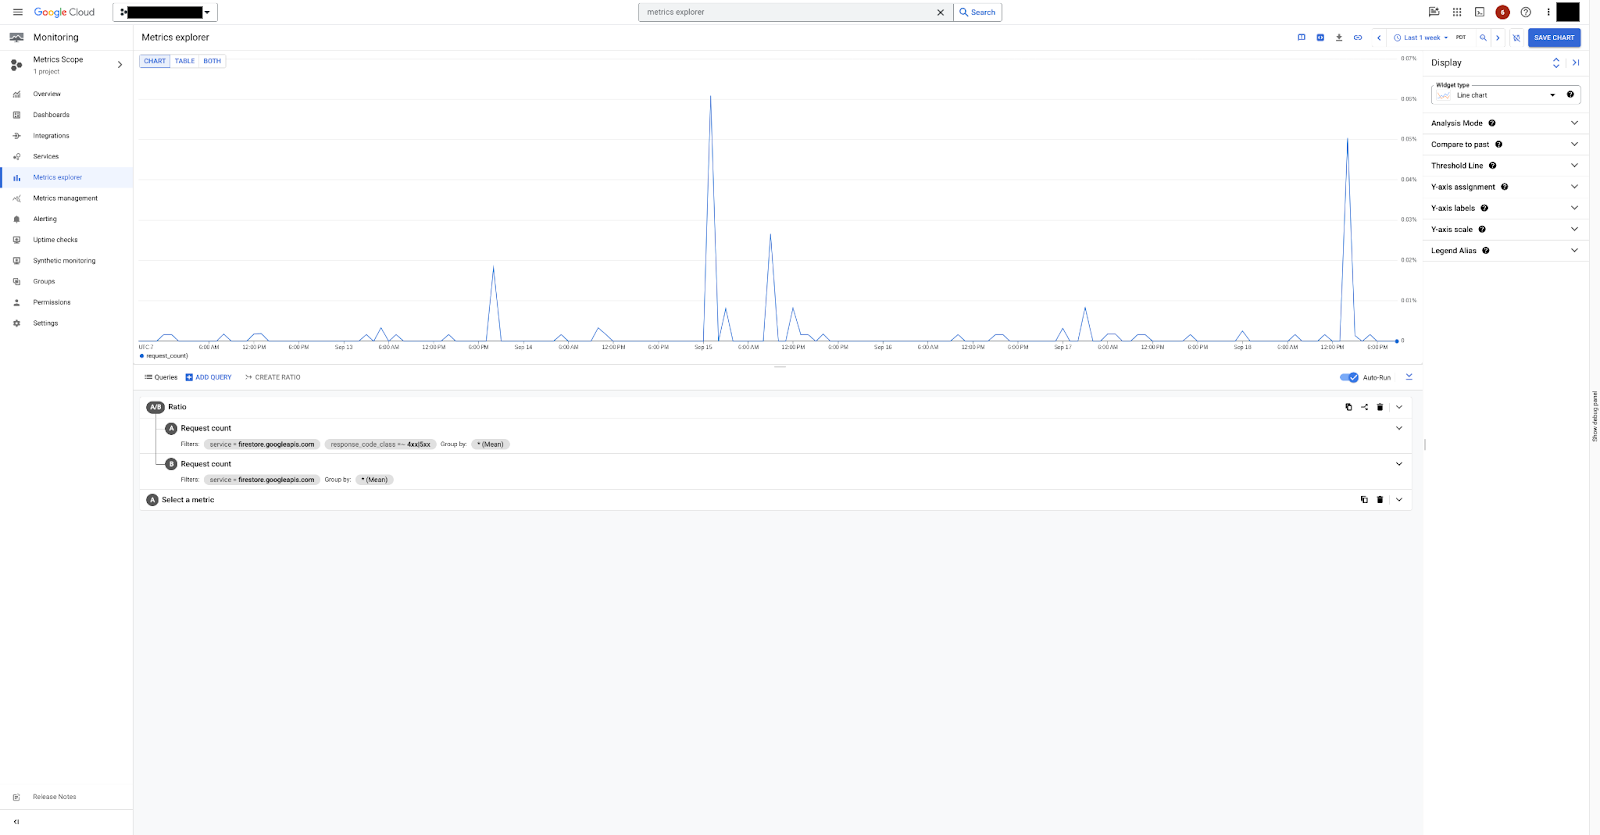
図 1 は、Metrics Explorer で api/request_count 指標を使用してエラー率を可視化する方法を示しています。
アラート ポリシーを作成する
Cloud Monitoring では、指標条件の変更が発生したときに通知されるアラートを作成できます。これらのアラートを使用すると、ユーザーに影響が及ぶ前に潜在的な問題について通知を受け取ることができます。
アラートの作成の詳細については、指標しきい値のアラート ポリシーを作成するをご覧ください。
レイテンシ アラート ポリシーを作成する次の例について考えてみます。アラート ポリシーは、5 分間のローリング ウィンドウで p99 レイテンシをチェックします。p99 レイテンシが 5 分間で 250 ミリ秒を超えると、アラートがトリガーされます。
コンソール
Google Cloud コンソールで、[モニタリング] ページに移動して、notifications [アラート] を選択します。
[ポリシーを作成] を選択します。
[消費した API] リソースから [リクエストのレイテンシ] 指標を選択します。
datastore.googleapis.comのサービス フィルタを追加します。api/request_latencies指標は 5 分間のローリング ウィンドウでモニタリングされます。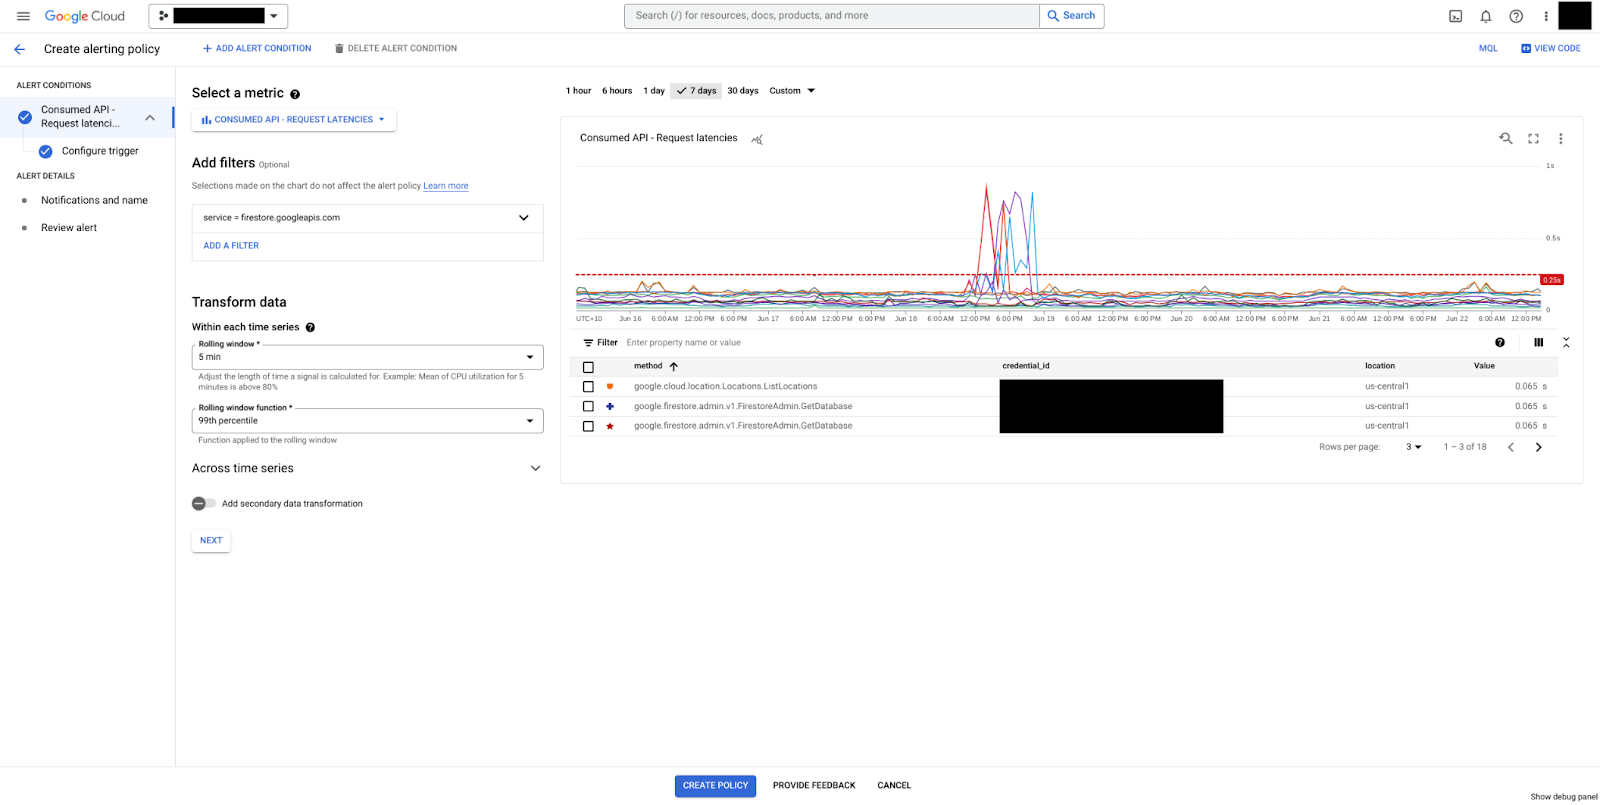
図 2. api/request_latencies 指標を選択してトリガーを作成します。 [次へ] をクリックしてトリガーを構成します。
[条件タイプ] で [しきい値] を選択します。
しきい値条件は 250 ミリ秒のしきい値に設定されています。p99 レイテンシ値がローリング ウィンドウの期間(5 分)全体で同じ値のままであると、アラートがトリガーされます。
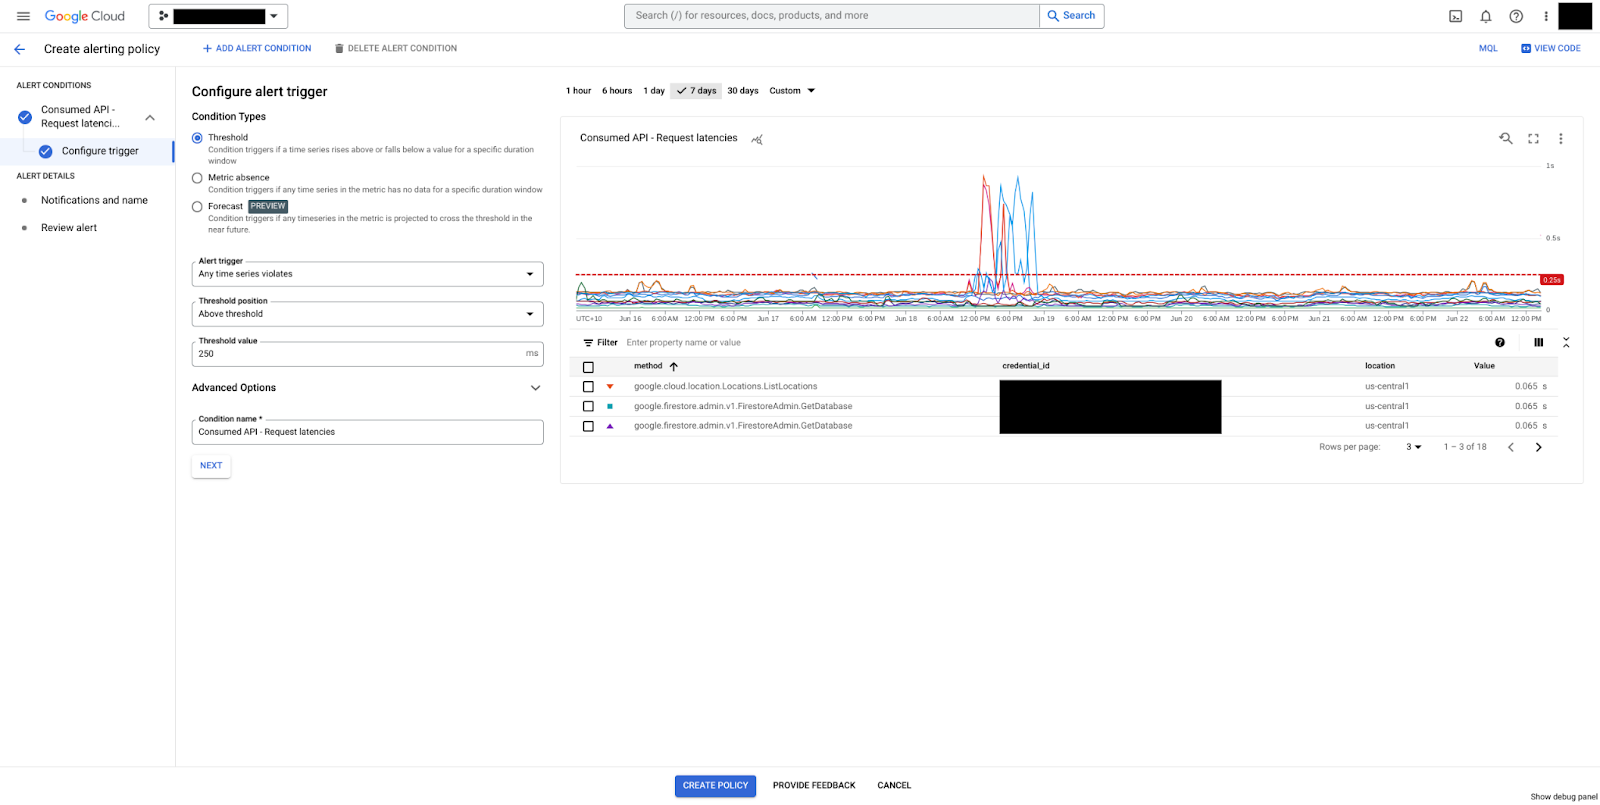
図 3. 指標のしきい値を追加します。 [しきい値] を 250 に設定します。
[次へ] をクリックして通知を構成します。
アラート ポリシー名を設定し、[次へ] をクリックします。
アラート構成を確認して [ポリシーを作成] をクリックします。
PromQL
Prometheus Query Language(PromQL)クエリを使用して、同じレイテンシ アラート ポリシーを実装できます。
  histogram_quantile(0.99,
    rate({
      "__name__"="serviceruntime.googleapis.com/api/request_latencies_bucket",
      "monitored_resource"="consumed_api",
      "service"="firestore.googleapis.com"
    }[5m])
  )
  > 0.25