This page provides an overview of the Key Visualizer diagnostic tool for Firestore in Datastore mode.
What is Key Visualizer?
Key Visualizer is a tool that helps you analyze your Datastore mode usage patterns. It generates visual reports that break down your usage based on the entities that you access or index entries that are written or deleted as entities are modified.
Key Visualizer can provide insights into usage patterns at scale. Uses for Key Visualizer include:
- Troubleshooting performance issues. Key Visualizer helps you identify performance issues in your database caused by hotspots from sequential entity or index keys or sudden traffic increases.
- Getting a better understanding of how you access the data stored in Datastore mode.
- Iteratively designing a data model or improving the design of an existing data model. In each iteration, you can check Key Visualizer to spot problems your data model causes.
To accomplish these goals, Key Visualizer can help you complete the following tasks:
- Check whether your reads or writes create hotspots on specific entity ranges.
- See how a sudden increase in traffic affects latency.
- Look at whether your access patterns are balanced across your database.
- Check the structure of index keys to identify the index definitions that cause index load problems.
- Use the index keys visualization to make better workload pattern predictions.
Scan eligibility
Each Key Visualizer scan covers a two hour period. A scan for a given period is available for databases with traffic that exceeds 3000 document operations in any given minute in that period.
Scan eligibility depends completely on database activity. It does not depend on the amount of data or the type of data in your database.
Key Visualizer scans
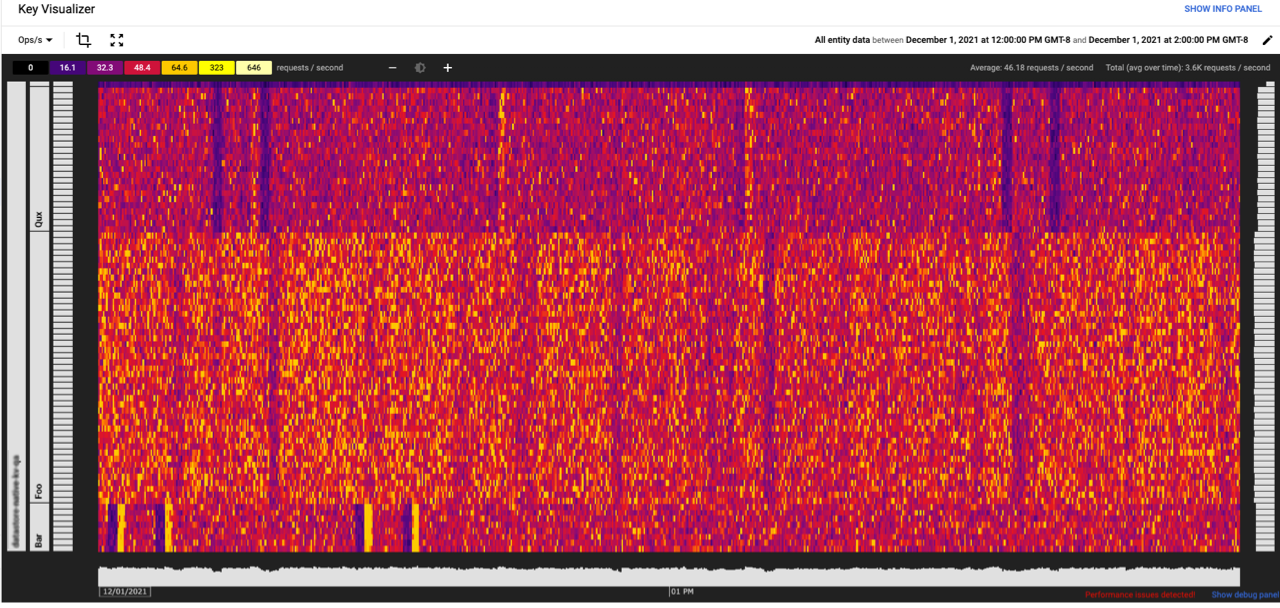
The following image shows a Key Visualizer scan. Each scan includes a heatmap that shows access patterns or performance metrics for a group of entity keys or index keys over time.
Sharing scan URLs
You can share or bookmark the URL of a Key Visualizer scan. The URL will open the same Key Visualizer scan and select the same metric. This URL is valid until the scan data duration expires.
Heatmaps
The core of a Key Visualizer scan is the heatmap, which shows the value of a metric over time, broken down into up to 1000 contiguous key buckets.
For a entity keys heatmap, the x-axis of the heatmap represents time, and the y-axis represents entity keys, while for an index keys heatmap, the x-axis of the heatmap represents time, and the y-axis represents index keys.
Each Key Visualizer scan for Firestore in Datastore mode covers two hours of activity divided into 10-second segments.
A low value for a metric is considered "cold" and appears as a dark color. A high value is "hot," and it appears as a bright color. The highest values appear in white.
Different types of usage result in different visual patterns within the heatmap, which can make it possible to diagnose issues at a glance. See Heatmap patterns for entity keys or Heatmap patterns for index keys for examples of some common patterns.
Key Visualizer provides tools to help you understand the data in each scan. See Getting started with Key Visualizer and Exploring heatmaps.
Key buckets
Key Visualizer divides all of the keys in your database into up to 1,000 contiguous ranges, with roughly the same number of keys and Ops/s in each range. These ranges are known as key buckets.
Key Visualizer uses the total Ops/s of a database to divide key buckets so that each bucket captures roughly the same number of Ops/s with a minimum intended size of 50 Ops/s per key bucket. For databases with higher total Ops/s, key buckets can capture more than 50 Ops/s each. Databases with less that 50 Ops/s result in scans with a single key bucket.
Key Visualizer reports most metrics as averages over each key bucket, or as maximum values within each key bucket.
Metrics
The following metrics are available for entity keys in Key Visualizer scans:
| Metrics | Description |
|---|---|
| Activity metrics | |
| Ops/s | Average number of entity operations per second. Roughly equal to the sum of writes, lookups, and queries per second. This metric can indicate which keys are hot. |
| Write ops/s | Average number of entity operations per second for writes and deletes. |
| Lookup ops/s | Average number of entity operations per second for lookups. |
| Query ops/s | Average number of entity operations per second for queries. |
| Performance metrics | |
| Average write latency | Average latency for writes and deletes within the processed data in the bucket. |
| Average lookup latency | Average latency for lookups within the processed data in the bucket. |
| Average query latency | Average latency for queries within the processed data in the bucket. |
| Write tail latency | Maximum observed write or delete latency within the processed data in the bucket. |
| Lookup tail latency | Maximum observed lookup latency within the processed data in the bucket. |
| Query tail latency | Maximum observed query latency within the processed data in the bucket. |
The following metric is available for index keys in Key Visualizer scans:
| Metrics | Description |
|---|---|
| Index Write Ops/s | Average number of index writes per second. |
Performance averages
Average latency metrics take an average over the keys in the key bucket. Since this measurement is taken at the storage layer, the latency reported here might be lower than the total latency an API call experiences.
Limits
Although Key Visualizer shows a variety of metrics, it doesn't display every single metric that can affect the performance of Datastore mode. For example:
- Network issues between your application and Google Cloud might not be visible. They might appear as vertical bands across all keys in Key Visualizer which only gives you hints about when the problems occurred.
Data duration
Data collected by Key Visualizer for Firestore in Datastore mode is deleted after 14 days.
Key Visualizer data is available for the last 14 days. For example, if you launch Key Visualizer on December 19 at 12:45 PM, the earliest start time you can choose for a 2-hour time span is December 5 at 1:00 PM.
This limit also means that if you bookmark or share the URL for a Key Visualizer scan, the URL has a maximum life of 14 days.
What's next
- Learn how to get started with Key Visualizer.
- Understand the entity key patterns or index key patterns you might see in Key Visualizer heatmaps.
- Find out how to explore a heatmap in detail.