This section describes the features of the code editor for Monitoring Query Language (MQL), which is available in the Google Cloud console.
This page doesn't cover the MQL language; for a set of examples and for more information about the language, see Examples and About the MQL language. MQL Reference provides a comprehensive reference for the language.
Accessing the code editor
To access the code editor when using the Metrics Explorer, do the following:
-
In the Google Cloud console, go to the leaderboard Metrics explorer page:
If you use the search bar to find this page, then select the result whose subheading is Monitoring.
- In the toolbar of the query-builder pane, select the button whose name is either code MQL or code PromQL.
- Verify that MQL is selected in the Language toggle. The language toggle is in the same toolbar that lets you format your query.
Using the code editor
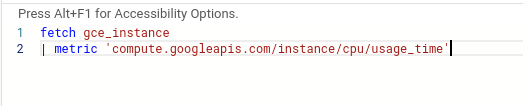
To use the code editor, type your query into the query editor and click Run Query:
Error messages
Error messages appear at the bottom of the editor pane. Some errors appear as you type. Others appear when you run the query.
Code folding
The editor provides code folding—the ability to collapse segments of your queries—so you can temporarily hide them from view.
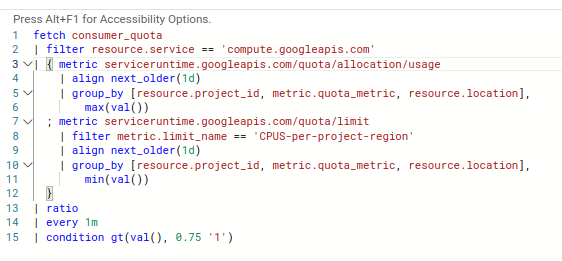
The editor indicates foldable segments of your query with carets next to the line numbers, as shown in the following screenshot:
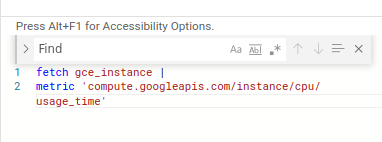
Find and replace
The editor supports a find-and-replace feature. To find, and optionally
replace, terms in your query, press Control+F (or Command+F on Mac). The
following screenshot shows the feature:
Editor controls
The editor has two controls that determine how it interacts with your query.
By default, your query is executed only when you click Run Query. You can set up the code editor to automatically execute your query as you type, but this option is disabled by default.
To enable the auto-run option, use the Auto-run toggle. When this option is enabled, the editor works as follows:
- The Run Query button isn't displayed.
- Errors messages appear continuously as you type.
If your cursor is at the end of a query that is incomplete but has no errors, the editor shows a yellow triangle in the control bar. If there is room, the text Incomplete query also appears.
The code editor does not attempt to evaluate incomplete queries.
There is also a grab-bar between the code editor and the chart region. Use this bar to change the relative sizes of the two regions.
Exit the code editor
To exit the code editor without saving a chart or condition, click arrow_back Return to query selector widget. Any query text in the editor is discarded, but you are given the option to save it to the clipboard.
View queries in strict form
To view a query in strict form when using the code editor, click more_vert More options and select See strict form.
For more information, see Strict-form queries.
Time ranges, charts, and the code editor
MQL queries in the code editor must include a time range. The time range specifies the subset of data to return as part of the query. The time range can be expressed implicitly by using the chart's time-range selector or explicitly in your MQL query text.
By default, the time-range selector is set to one hour.
To change the time range of a chart, use the time-range selector. For example, if you want to view the data for the past week, then select Last 1 week from the time-range selector. You can also specify a start and end time, or specify a time to view around.
Using chart settings for time selection
You can set the time period for a query by using the chart's time selector. This selector is the default way to set the time period. To change the time period, select a different time option on the chart. If you select, for example, one week, then your query returns the data from now to a week ago.

When you use this default mechanism, you don't have to specify an explicit time range in the text of your query. The value on the chart is used implicitly.
Using within for time selection
You can specify the time range for the query explicitly in the query by using
the within operation. This operation determines the range of
returned data. If your query includes a within operation, then the
time-selection options on the chart are disabled, and the time range specified
in the query is used.
If you remove an explicit within operation from your query, the chart
options are automatically re-enabled, ensuring that your query always
includes a time period.
You must use explicit time selection if you want to use the API method
timeSeries.query to issue the query. For more information, see
Using MQL from the Monitoring API.
Query, alignment, and display periods
MQL has a number of potentially confusing operations that specify time periods. The following operations are related to the range of a query:
within: specifies the query-output window. This operation determines how much data is returned. If, for example, you specifywithin 1h, then the query produces only points whose timestamps are within the last hour, which is why this operation overrides the chart's time-selector options.The following operations relate to the alignment period of their output tables. Both require an aligned table as input, or they supply a default:
every: specifies the period for aligned table output.window: specifies the window for alignment operations.
In both cases, if an
alignoperation is provided with an explicit alignment window, it must match the period specified for thewindowoperation, if provided. For thedeltaalignment function, the alignment window and period must be the same; if an explicit alignment window is given, then theeveryoperation, if given, must agree. In all cases, the alignment window must be at least as large as the alignment period or input data will be ignored.
MQL also has a graph_period operation, which
specifies the period of output points for charts. This operation is useful in
queries given to the API whose output is being charted by third-party software.
The Monitoring charting software ignores the graph_period
operation in queries, setting the period of points according to the width in
time of the output chart.
In Monitoring charts, the graph period is set based on the value of the chart's time-range selector and the maximum number of points that a chart can display. For example, if you select one week, the graph period might be one hour. For charts on dashboards, to view the graph period, click query_stats Query stats.
The relationship between the query alignment period and the graph period can change the way a chart looks. This relationship is described in the following section.
Min/max bands
When the query alignment period is close to the graph period, the chart represents each graphed time series with a single line. If the query alignment period is less than half of the graph period of the chart, the chart includes a shaded region around each line. This region, called a min/max band, shows the range of values that produced the mean value.
For example, assume the following MQL query:
fetch gce_instance::compute.googleapis.com/instance/cpu/utilization
| group_by [zone], mean(val())
| every 1h
This query returns the mean CPU utilization of VMs by zone, with a one-hour alignment period.
If the chart's time selector is set to one week, then the graph period is one hour, which is indicated on a chip. For the example query, the graph period and alignment period are equal. Running the query produces a chart that looks like the following:
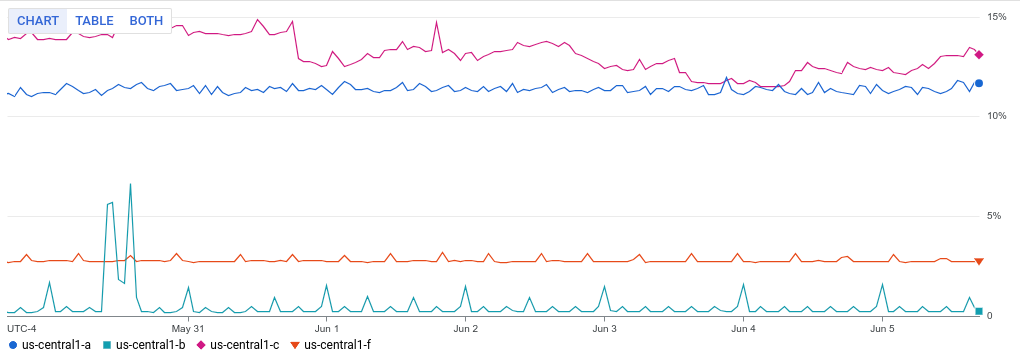
For example, if you change the alignment period passed to the every
operation from 1h to 1m in the previous query, then the query produces a
chart that includes the min/max bands:
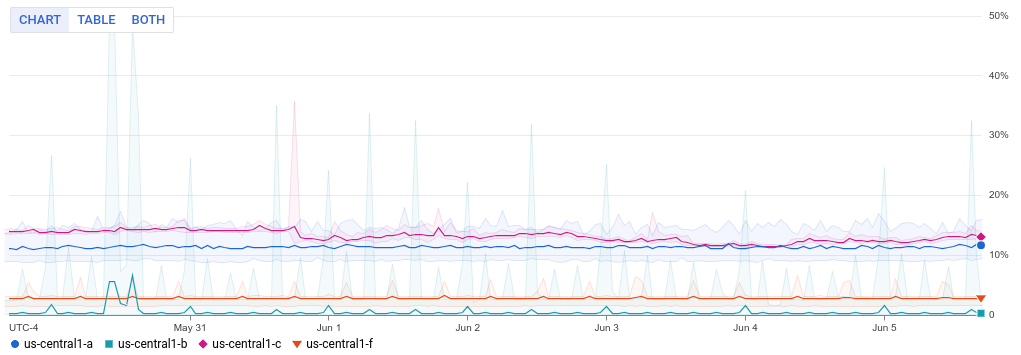
The chart lines are graphed with a graph period of one hour, based on the one-week selection for the chart, so the lines are the same as those in the previous example. But the query produces a point every minute, so the min/max bands show the range of one-minute values from the query that fall into each one-hour graph point.
If the every operation is omitted, the default query alignment period is
either the value of the alignment window or, if the alignment window is not
specified, one minute.