This document provides an overview of the services that Cloud Monitoring provides. These services can help you to understand the behavior, health, and performance of your applications and of other Google Cloud services. Cloud Monitoring automatically collects and stores performance information for most Google Cloud services. You can collect Prometheus metrics by using Google Cloud Managed Service for Prometheus. If you install the Ops Agent on your Compute Engine virtual machines (VMs), then you can collect metrics and logs from your applications and from third-party applications.
The alerting, testing, and visualization services provided by Cloud Monitoring help you answer important questions like the following:
- What is the load on my service?
- Is my website responding correctly?
- Is my service performing well?
- What is the health of my App Hub application?
Cloud Monitoring provides both Google Cloud console and API support for most of
its services. Some services also support the Google Cloud CLI or
Terraform. The Cloud Monitoring API reference pages, such as the page
alertPolicies.list,
let you experiment with API calls directly from the reference page.
Cloud Monitoring services
Cloud Monitoring provides different services that you can use to understand the health and performance of your applications, and of the other Google Cloud services that you use.
Incidents and notifications
To be notified when the value of a performance metric meets criteria that you define, create an alerting policy. The alerting policy includes the list of people or groups who are to receive notifications. Monitoring supports common notification channels, including email, Cloud Mobile App, and services such as PagerDuty or Slack. For example, you might create an alerting policy so that you are notified when the CPU utilization of a VM exceeds 80%.
Each notification includes relevant information about a failure, and it includes a link to an incident. An incident is a persistent record that stores information that you can use to troubleshoot the failure. Typically, a record lists the status of the incident, links to logs, a chart of the recorded metric data, labels, and duration.
The alerting service is integrated with many Google Cloud services. When these integrations exist, you might see a panel that lists recommended alerts, or you might see a button on a chart that lets you create an alerting policy. In both cases, the alerting policies are pre-configured, you only specify the list of people or groups to be notified.
You can create and manage alerting policies by using the Google Cloud console, the Cloud Monitoring API, the Google Cloud CLI, or Terraform.
Proactive monitoring and validation
To test the availability, consistency, and performance of your services, applications, web pages, and APIs, create synthetic monitors. For example, you can probe HTTP, HTTPS, and TCP endpoints for responsiveness with uptime checks, and then get notified when an endpoint fails to respond. You can also create a broken-link checker to crawl a web page and then notify you when broken links are detected.
You can create and manage synthetic monitors by using the Google Cloud console, the Cloud Monitoring API, the Google Cloud CLI, or Terraform.
Data visualization
As you instantiate Google Cloud resources or register applications with App Hub, the dashboard service automatically creates Google Cloud-managed dashboards. These dashboards show curated information that helps you understand the health of your resources and applications. For example, for an App Hub application, dashboards are created for the application and for each of its services and workloads. These dashboards show information like an application's log or metric data, and the number of open alerts.
The dashboards created by Google Cloud might provide you enough information to complete an investigation. However, they might not provide the exact data you need to see trends, identify outliers, or view other details about your data. To complete these tasks, you can use the dashboard and charting services:
To control what data you view and the display format for that data, create a custom dashboard. For example, you might import a Grafana dashboard or install a dashboard from a template.
Your custom dashboards can display the following.
- Charts and tables that show metric data
- Log data and error groups
- Charts for alerting policies
- Information about alerts
- Text
- Events, such as a reboot or a crash, that affects the operation of a system.
You can create and manage dashboards by using the Google Cloud console or the API.
The chart service, Metrics Explorer, lets you quickly visualize and explore time-series data. The chart settings let you compare current data to previous data, display outliers and percentiles, and display multiple metrics. You can also save charts to a custom dashboard.
Data collection and storage
Cloud Monitoring collects and stores the following types of metric data:
- System metrics generated by Google Cloud services. These metrics provide information about how a service is operating.
- System and application metrics that the Ops Agent collects about system resources and applications running on Compute Engine instances. You can configure the Ops Agent to collect metrics from third-party plugins such as Apache or Nginx web servers, or MongoDB or PostgreSQL databases.
User-defined metrics that are created by using the Cloud Monitoring API or by using a library such as OpenTelemetry.
External metrics that are defined by some open source libraries or third-party providers.
Prometheus metrics that are collected by Google Cloud Managed Service for Prometheus, or by using the Ops Agent and the Prometheus receiver or the OTLP receiver.
- Log-based metrics that record numeric information about the logs written to Cloud Logging. Google-defined log-based metrics include counts of the errors that your service detects and the total number of log entries received by your Google Cloud project. You can also define log-based metrics.
Query languages
When you create an alerting policy or a chart, you must provide a query that describes the data that you want to monitor or chart:
Google Cloud console: You can build your query by making selections from menus, or you can write a query. Query editors are available for the Prometheus Query Language (PromQL). The query editor provides syntax checks and suggestions. You can also write a Monitoring filter expression.
Cloud Monitoring API: The API supports Prometheus Query Language (PromQL) and Monitoring filter expressions.
Monitor large systems
This section describes how you can manage resources as a collection and how you can monitor metrics that are stored in multiple Google Cloud projects.
Manage resources as a collection
To manage your resources as a collection instead of individually, create a resource group. A resource group is a dynamic collection of resources that satisfy some criteria that you provide. As you add and remove resources, for example by adding Compute Engine VM instances to your Google Cloud project, the membership in the group automatically changes. The following are examples of resource groups:
- Compute Engine instances whose names start with the string
prod-. - Resources with the tag
test-cluster. - Amazon EC2 instances in region A or region B.
After you define a resource group, you can monitor the group as if it were a single resource. For example, you can configure an uptime check to monitor a resource group. For charts and alerting policies, you can also filter based on the group name.
For more information, see Configure resource groups.
Monitor metrics for multiple Google Cloud projects
To view and monitor the time-series data for multiple Google Cloud projects and AWS accounts through a single interface, configure a multi-project metrics scope.
By default, Cloud Monitoring pages in the Google Cloud console provide access only to the time series stored in the scoping project. The scoping project is the project that you selected with the Google Cloud console project picker. The scoping project stores the alerts, synthetic monitors, dashboards, and monitoring groups that you configure.
The scoping project also hosts a metrics scope. The metrics scope defines the projects and accounts whose metrics are visible to the scoping project. You can configure the metrics scope to include time-series data from other Google Cloud projects and from AWS accounts. For information about how to modify a metrics scope, see Configure a metrics scope for multiple projects.
Cloud Monitoring data model
This section introduces the Cloud Monitoring data model:
A metric type describes something that is measured. Examples of metric types include a VM's CPU utilization and the percentage of a disk that is used.
A time series is a data structure that contains time-stamped measurements of a metric and information about the source and meaning of those measurements.
Here are some details about what a time series contains:
The
pointsarray contains the time-stamped measurements.The following is an example of a
pointsarray with two values:"points": [ { "interval": { "startTime": "2020-07-27T20:20:21.597143Z", "endTime": "2020-07-27T20:20:21.597143Z" }, "value": { "doubleValue": 0.473005 } }, { "interval": { "startTime": "2020-07-27T20:19:21.597239Z", "endTime": "2020-07-27T20:19:21.597239Z" }, "value": { "doubleValue": 0.473025 } }, ],To understand the meaning of a value, you need to refer to the other data included in the time series and to the definitions of that data.
The
resourcefield describes the hardware or software component that is being monitored. In Cloud Monitoring, the hardware or software component is referred to as the monitored resource. Examples of monitored resources include Compute Engine instances and App Engine applications. For a list of monitored resources, see the Monitored resource list.The following is an example of a
resourcefield:"resource": { "type": "gce_instance", "labels": { "instance_id": "2708613220420473591", "zone": "us-east1-b", "project_id": "sampleproject" } }The
typefield lists the monitored resource as agce_instance, which indicates that these measurements are taken on a Compute Engine VM instance.The
labelsfield contains key-value pairs that provide additional information about the monitored resource. For agce_instancetype, the labels identify the VM instance that is being monitored.
The
metricfield describes what is being measured.The following is an example of a
metricfield:"metric": { "labels": { "instance_name": "test" }, "type": "compute.googleapis.com/instance/cpu/utilization" },- For Google Cloud services, the
typefield specifies the service and what is being monitored. In this example, the Compute Engine service measuring the CPU utilization. When thetypefield begins withcustomorexternal, the metric is either a custom metric or one defined by a third party.
- The
labelsfield contains key-value pairs that provide additional information about the measurement. These labels are defined as part of theMetricDescriptor, which is a data structure that defines the attributes of the measured data. TheMetricDescriptorfor the metriccompute.googleapis.com/instance/cpu/utilizationincludes the labelinstance_name.
- For Google Cloud services, the
The
metricKindfield describes the relationship between adjacent measurements within a time series:GAUGEmetrics store the value of the thing being measured at a given moment in time—for example, an hourly temperature record.CUMULATIVEmetrics store the accumulated value of the thing being measured at a given moment in time—for example, an odometer in a vehicle.DELTAmetrics store the change in the value of the thing being measured over a specified period—for example, a stock summary that shows the stock's gains or losses.
The
valueTypefield describes the data type for the measurement:INT64,DOUBLE,BOOL,STRING, orDISTRIBUTION.
- You can show the CPU utilization of every VM instance.
- You can show the CPU utilization for a specific VM instance by
filtering the time series for a single value of the
instance_idlabel. You can group by the VM instances by the
machine_typelabel, and then display the average CPU utilization. The following screenshot illustrates a chart with this configuration: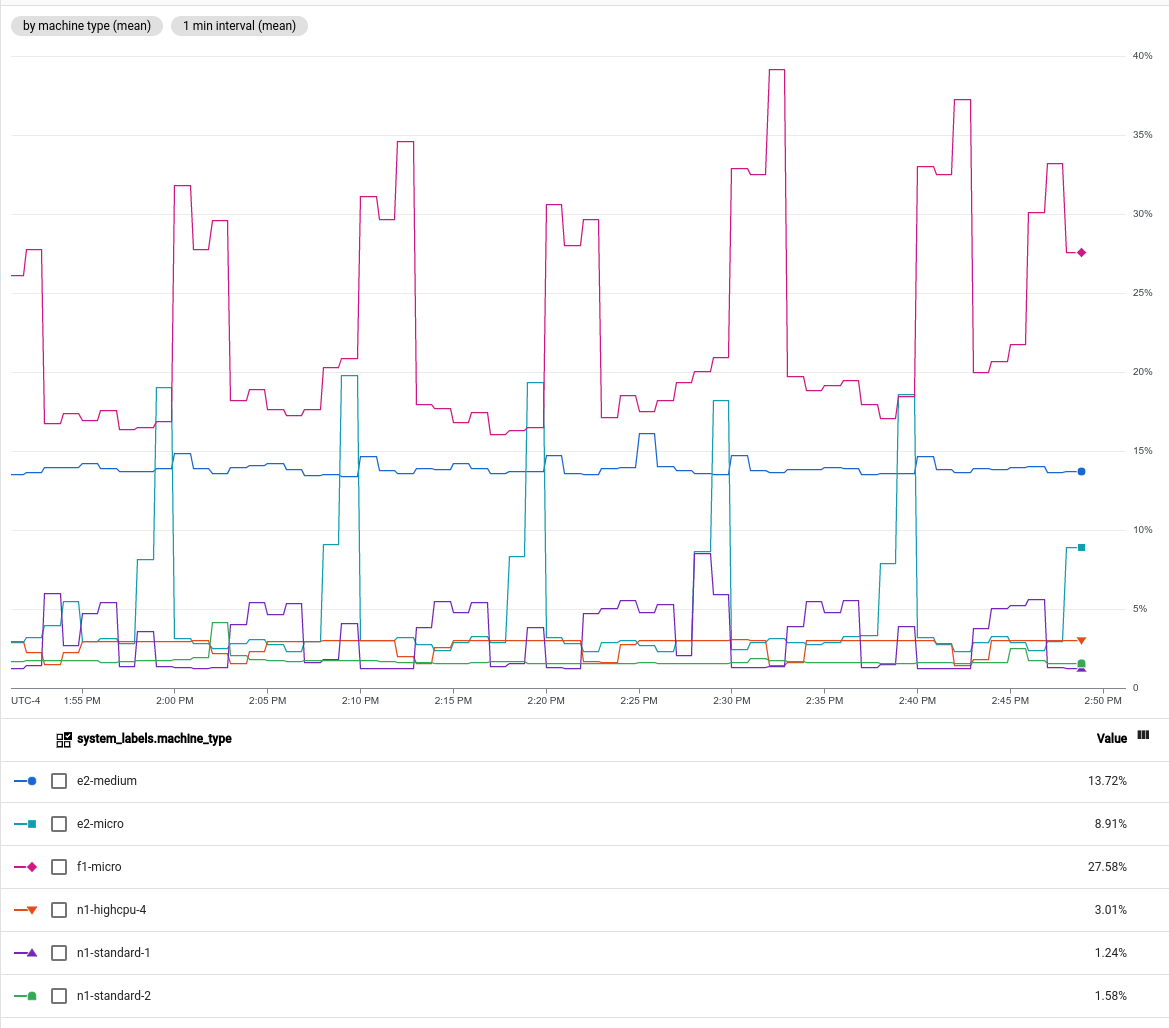
Pricing
In general, Cloud Monitoring system metrics are free, and metrics from external systems, agents, or applications are not. Billable metrics are billed by either the number of bytes or the number of samples ingested.
For more information, see the Cloud Monitoring sections of the Google Cloud Observability pricing page.
What's next
- To explore Cloud Monitoring, try the Quickstart for monitoring a Compute Engine instance.
- For information about how to configure our Google Cloud project to view metrics for multiple Google Cloud projects and AWS accounts, see Metrics scopes overview.
For information about the Cloud Monitoring data model, see Metrics, time series, and resources.
For information about the Cloud Monitoring API, see APIs and reference.
For lists of metrics and monitored resources, see Metrics list and Monitored resource list.