애플리케이션 모니터링이란 무엇인가요?
애플리케이션 모니터링을 사용하면 애플리케이션의 관점에서 리소스와 인프라를 모니터링할 수 있습니다. 즉, 리소스를 검색하고 애플리케이션에 사용되는 리소스를 파악하는 방식으로 조사를 시작하지 않습니다. 대신 애플리케이션 조사를 시작하면서 여기에 사용되는 리소스와 인프라 관련 정보를 찾습니다. 애플리케이션 모니터링에서 애플리케이션을 위해 생성하는 대시보드를 통해 애플리케이션과 해당 서비스 및 워크로드의 운영 상태를 파악할 수 있습니다.
예를 들어 다음 스크린샷은 애플리케이션 모니터링에서 특정 애플리케이션에 제공하는 요약 정보를 보여줍니다.
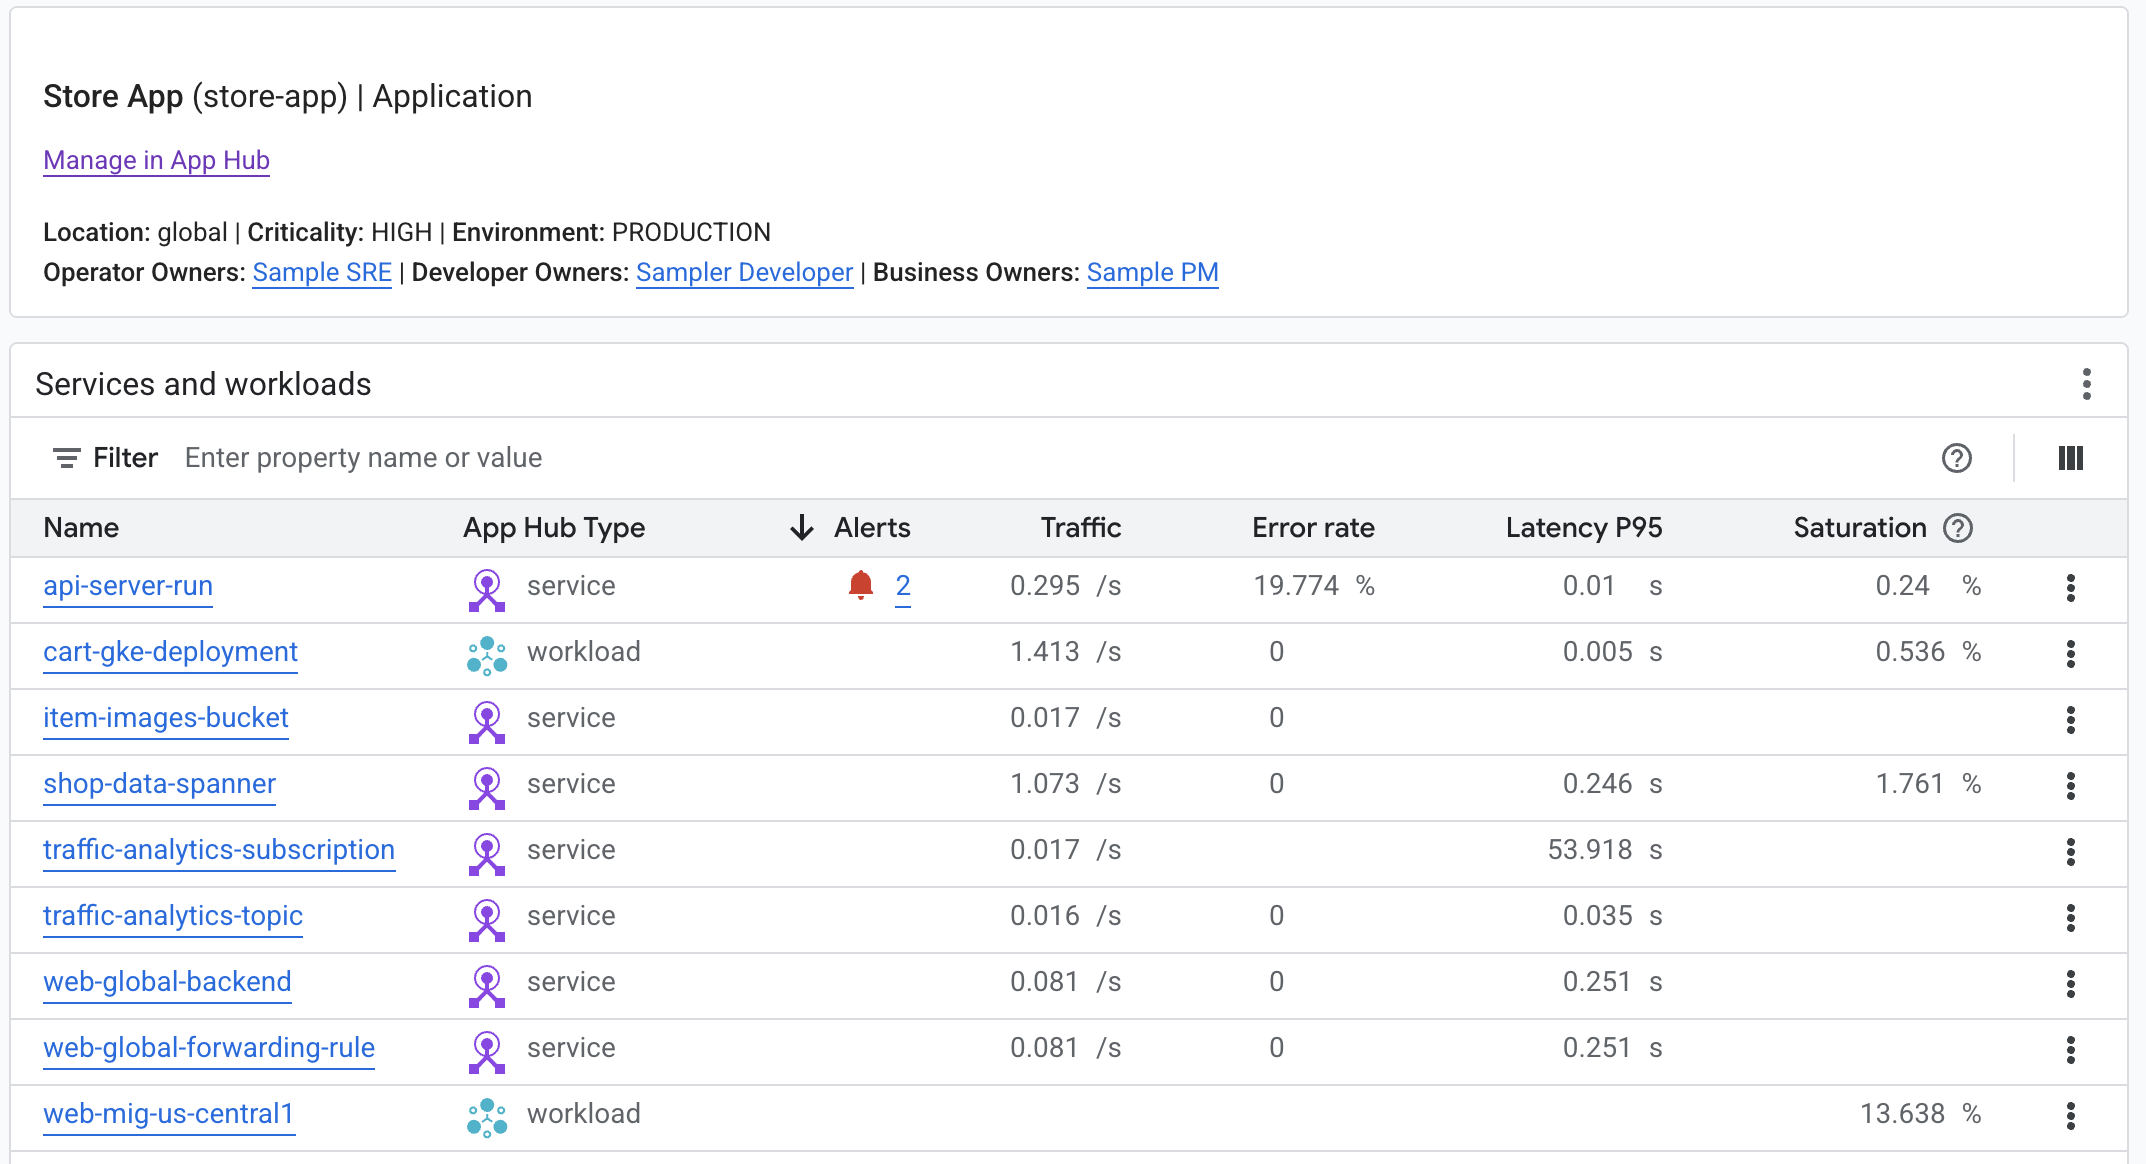
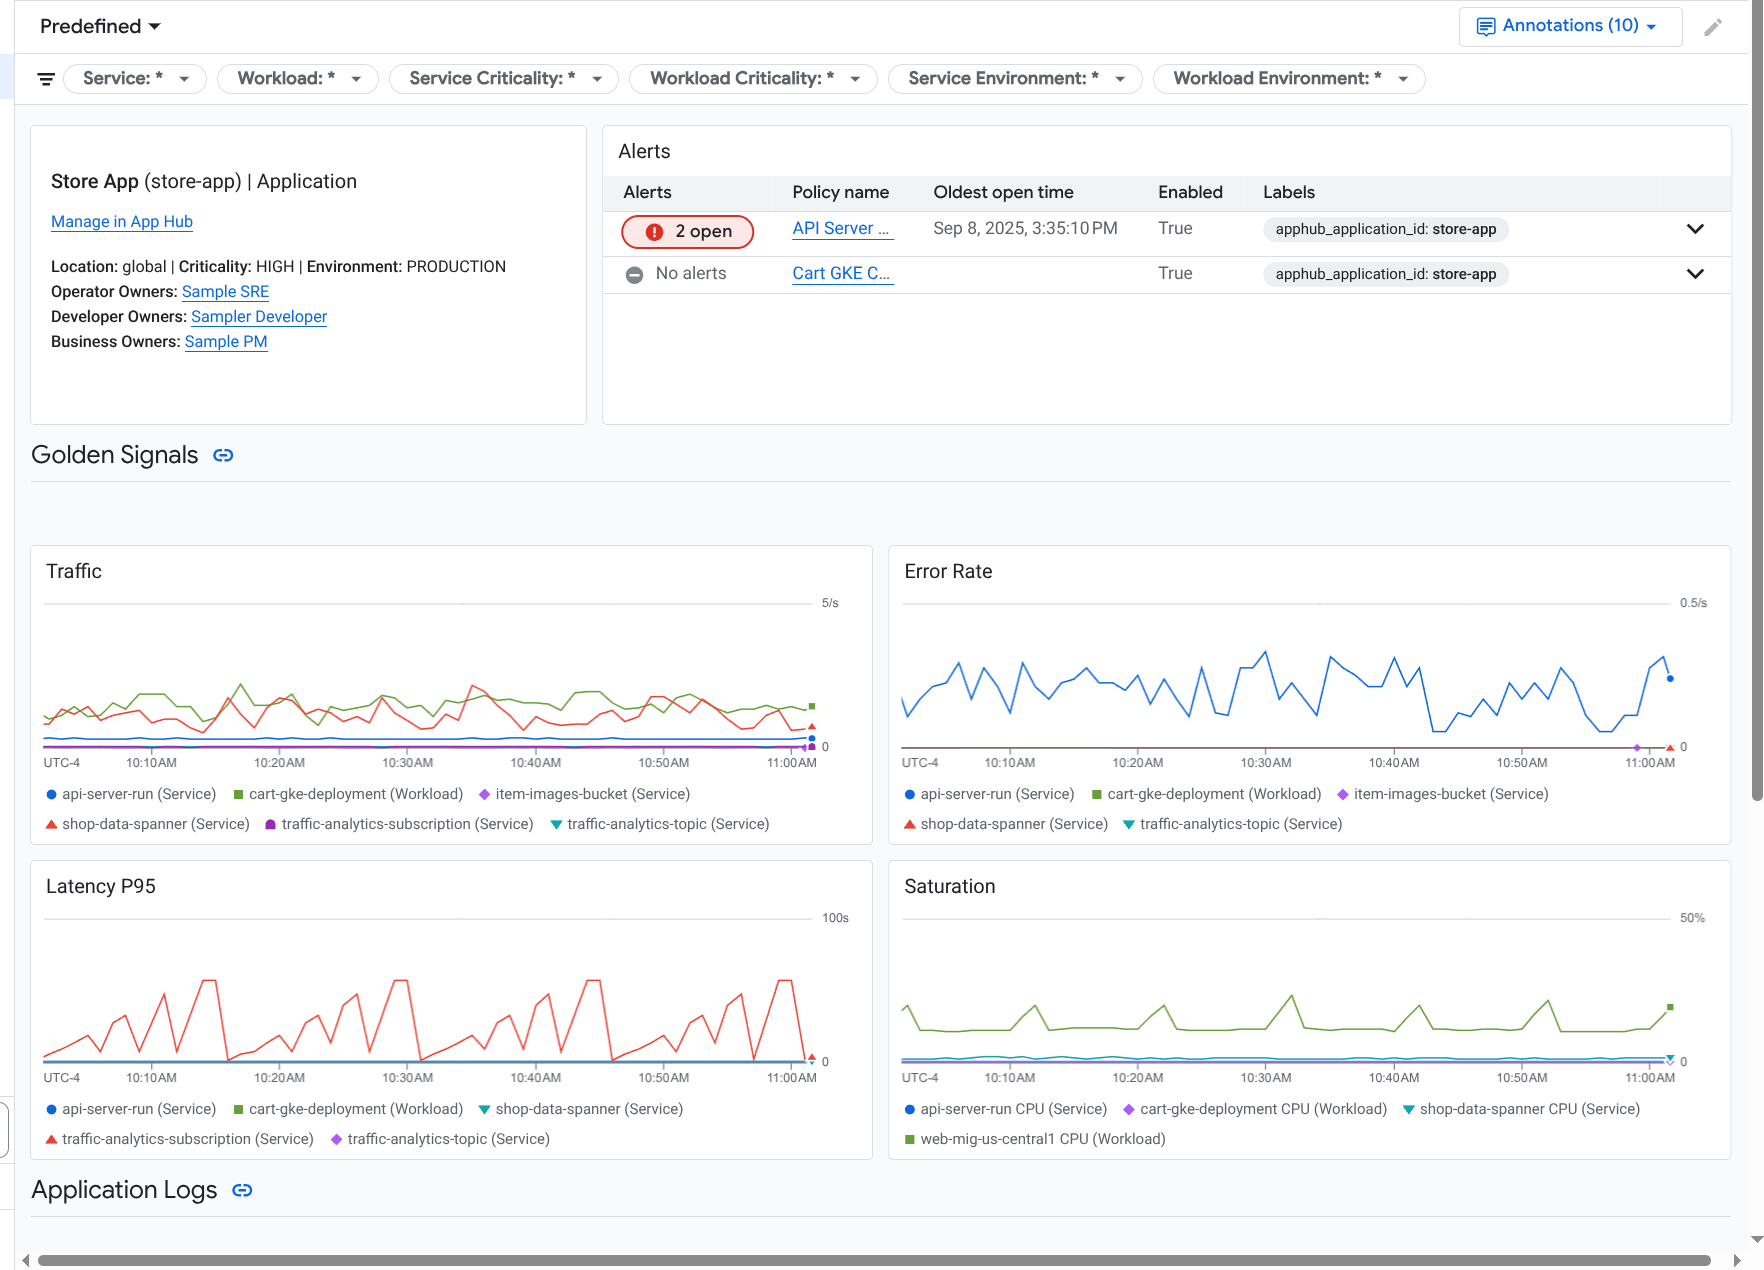
이 동일한 애플리케이션에 대해 애플리케이션 모니터링은 골든 시그널, 로그 데이터, 미해결 이슈에 관한 정보와 같은 자세한 정보를 표시하는 대시보드도 만듭니다.
애플리케이션 모니터링을 사용하려면 애플리케이션을 만들고 서비스 및 워크로드를 애플리케이션에 등록한 후 모니터링 가능성 범위를 구성해야 합니다. 애플리케이션을 만들고 여기에 서비스 및 워크로드를 등록하려면 App Hub를 사용하면 됩니다. 또는 Application Design Center를 사용해서 애플리케이션을 배포하면 됩니다.
애플리케이션 모니터링을 채택해야 하는 이유
애플리케이션 모니터링을 사용하면 시간과 노력을 절약할 수 있습니다. 예를 들어 애플리케이션 설계 및 배포를 돕기 위해 Application Design Center를 사용한다고 가정해 보세요. 그런 후 App Hub를 사용해서 이 애플리케이션을 구성 및 관리하고, 애플리케이션 모니터링을 사용해서 애플리케이션의 성능을 파악하고 오류를 진단할 수 있습니다.
- 애플리케이션, 서비스, 워크로드 대시보드
- App Hub 애플리케이션의 서비스 및 워크로드에 대한 라벨 전파
- 중요도 및 환경별 원격 분석 필터링
- 오픈소스와의 원활한 통합
애플리케이션이 배포될 때 애플리케이션 모니터링 서비스는 사용자의 애플리케이션을 검색하고 해당 환경에 맞는 대시보드를 자동으로 빌드합니다. 이러한 대시보드는 사고 조사를 돕기 위해 검색 및 필터링을 지원합니다.
애플리케이션 모니터링에서 만드는 대시보드에는 다음이 표시됩니다.
- 위치, 심각도, 소유자와 같은 정보
- 미해결 사고에 관한 정보
- 지원되는 인프라에서 생성된 로그 및 측정항목 데이터. 측정항목 데이터에는 오류율, 트래픽과 같은 골든 신호와 선택한 측정항목이 포함됩니다.
애플리케이션이 지원되는 인프라에서 실행되면 Google Cloud Observability가 원격 분석 데이터에 애플리케이션별 라벨을 연결합니다. 이러한 라벨은 App Hub 애플리케이션을 식별합니다. 원격 분석 데이터를 쿼리할 때 이러한 애플리케이션별 라벨을 사용할 수 있습니다. 로그 탐색기, 측정항목 탐색기, Trace 탐색기 페이지에서는 라벨을 사용하여 데이터를 필터링하고 집계할 수 있습니다.
애플리케이션 모니터링 시작하기
애플리케이션 모니터링을 사용하려면 다음 단계를 따르세요.
App Hub에 등록된 애플리케이션의 원격 분석을 볼 수 있도록 모니터링 가능성 범위를 구성합니다. 이 단계에 대한 자세한 내용은 애플리케이션 모니터링 설정을 참조하세요.
애플리케이션별 라벨을 알림 정책에 연결합니다. 이 단계에 관한 자세한 내용은 알림 정책을 App Hub 애플리케이션과 연결을 참조하세요.
애플리케이션에서 생성된 측정항목 및 trace 데이터에 애플리케이션 라벨을 포함하려면 OpenTelemetry로 애플리케이션을 계측하거나 Google Cloud Managed Service for Prometheus를 사용하세요. 자세한 내용은 애플리케이션 모니터링을 위한 계측 앱을 참조하세요.
애플리케이션 모니터링 대시보드를 열고 살펴봅니다. 이러한 대시보드를 보는 방법에 대한 자세한 내용은 애플리케이션 원격 분석 보기를 참조하세요.