本文說明如何使用開放原始碼 Prometheus CloudWatch Exporter,以及在 Compute Engine 執行個體上執行的 Ops Agent,收集 AWS CloudWatch 指標並儲存在 Google Cloud 專案中。
本文適用於需要收集 AWS CloudWatch 指標的開發人員和系統管理員。本文說明如何設定 Prometheus CloudWatch Exporter,以收集 AWS CloudWatch 指標。
透過 Cloud Monitoring,您可以在與 Google Cloud 指標相同的環境中查看 AWS 指標。舉例來說,您可以建立含有圖表的資訊主頁,顯示 Amazon EC2 執行個體和 Compute Engine 執行個體的 CPU 使用率。您也可以建立快訊政策,監控 AWS 指標。詳情請參閱下列章節:
事前準備
如要使用 Prometheus CloudWatch Exporter 收集 AWS CloudWatch 指標,您需要下列項目:
- 具有下列權限的 Google Cloud 專案:
- 建立 VM
- 將記錄檔寫入 Cloud Logging
- 將指標寫入 Cloud Monitoring
- 具有 AWS 憑證的 AWS 帳戶,Prometheus 匯出工具可使用這些憑證擷取指標。詳情請參閱執行 Prometheus 匯出工具。
建立 Compute Engine VM
建議您建立 Linux Compute Engine VM,專門用於執行 Ops Agent 和 Prometheus CloudWatch 匯出工具。這個 VM 會做為所有 AWS 指標的收集站點。
如要在您指定的可用區中建立名為 aws-exporter-test 的 Debian Linux VM,請執行下列指令:
gcloud compute instances create \
  --image-project debian-cloud \
  --image-family debian-11 \
  --zone ZONE \
  aws-exporter-test
請按照下列方式設定指令:
- 將
ZONE 替換為新 VM 的區域
- (選用步驟) 將
aws-exporter-test 替換為 VM 的其他名稱。
如要進一步瞭解這個指令,請參閱 gcloud compute instances create 參考資料。
如要存取 VM,以便安裝 Prometheus CloudWatch Exporter 和 Ops 代理程式,請使用下列指令:
gcloud compute ssh --zone ZONE --project PROJECT_ID aws-exporter-test
請按照下列方式設定指令:
- 將 ZONE 替換為建立 VM 時指定的目的地可用區。
- 將 PROJECT_ID 替換為 Google Cloud 專案 ID
- 如果您建立 VM 時使用其他名稱,請替換 aws-exporter-test
如要進一步瞭解這個指令,請參閱 gcloud compute ssh 參考資料。
設定 Prometheus CloudWatch 匯出工具
以下各節說明如何在 Compute Engine VM 上下載、安裝及設定 Prometheus CloudWatch 匯出工具。
下載 Prometheus 匯出工具和 JRE
如要執行 Prometheus CloudWatch Exporter,請下載該 Exporter 和 Java Runtime Environment (JRE) 11 以上版本。
如要下載包含 Prometheus CloudWatch Exporter 的 JAR 檔案,請在 Compute Engine 執行個體上執行下列指令:
curl -sSO https://github.com/prometheus/cloudwatch_exporter/releases/download/v0.15.1/cloudwatch_exporter-0.15.1-jar-with-dependencies.jar
如要安裝 JRE,可以使用類似以下的指令:
sudo apt install default-jre
設定 Prometheus 匯出工具
如要設定 Prometheus CloudWatch Exporter,請為要收集指標的 AWS 服務建立設定檔。如需一般資訊,請參閱 Prometheus CloudWatch 匯出工具的設定說明文件。
您可以將多項 AWS 服務的設定合併到一個設定檔。本文中的範例假設設定檔名為 config.yml。
執行 Prometheus 匯出工具
您必須先為 Prometheus CloudWatch 匯出工具提供憑證和授權,才能執行該工具。Prometheus CloudWatch Exporter 使用 AWS Java SDK,提供透過下列環境變數提供憑證的方法:
AWS_ACCESS_KEYAWS_SECRET_ACCESS_KEYAWS_SESSION_TOKEN,如果您使用臨時憑證
如要進一步瞭解如何向 SDK 提供憑證,請參閱 AWS SDK for Java 2.x。
您也必須有權使用 CloudWatch API 擷取指標。您需要下列 AWS IAM CloudWatch 權限:
cloudwatch:ListMetricscloudwatch:GetMetricStatisticscloudwatch:GetMetricData
使用 aws_tag_select 功能也需要 tag:GetResources AWS IAM 權限。
如要進一步瞭解如何授權存取 AWS 服務,請參閱 AWS Identity and Access Management。
如要執行 Prometheus CloudWatch Exporter,請按照下列步驟操作:
如要為匯出工具提供憑證,請設定存取金鑰環境變數:
export AWS_ACCESS_KEY=YOUR_ACCESS_KEY
export AWS_SECRET_ACCESS_KEY=YOUR_SECRET_ACCESS_KEY
export AWS_SESSION_TOKEN=YOUR_SESSION_TOKEN
將 YOUR_KEY 變數替換為存取金鑰。
只有在使用臨時憑證時,才需要設定 AWS_SESSION_TOKEN 環境變數。
如要測試設定,請啟動匯出工具並載入設定檔,然後執行下列指令:
java -jar cloudwatch_exporter-0.15.1-jar-with-dependencies.jar 9106 config.yml
視需要變更連接埠 (9106config.yml
如果在匯出工具執行期間修改 config.yml
curl -X POST localhost:9106/-/reload
如要在實際工作環境中使用,您可以設定匯出工具,在 VM 重新啟動時重新啟動。舉例來說,在 Debian 系統上,您可以使用系統和服務管理員 systemd。
設定作業套件代理程式
下列各節說明如何安裝、設定及啟動 Ops Agent。這些章節提供 Ops Agent 的最基本設定資訊,以搭配 Prometheus CloudWatch 匯出工具使用。如要進一步瞭解這些主題,請參閱「作業套件代理程式總覽」。
安裝作業套件代理程式
如要安裝作業代理程式,請使用下列指令下載並執行代理程式的安裝指令碼:
curl -sSO https://dl.google.com/cloudagents/add-google-cloud-ops-agent-repo.sh
sudo bash add-google-cloud-ops-agent-repo.sh --also-install
設定作業套件代理程式
如要設定 Ops Agent,請將設定元素新增至 Agent 的使用者設定檔。在 Linux 上,使用者設定檔為 /etc/google-cloud-ops-agent/config.yaml。
將作業套件代理程式設為從 Prometheus CloudWatch Exporter 收集 AWS 指標時,您會使用代理程式的 Prometheus 接收器。本文將說明 Ops Agent 的兩種基本設定。選取其中一個設定,並新增至使用者設定檔:
sudo vim /etc/google-cloud-ops-agent/config.yaml
作業套件代理程式的基本設定
下列設定提供 Ops Agent 的最低設定。這項設定會執行下列動作:
metrics:
  receivers:
    aws:
      type: prometheus
      config:
        scrape_configs:
          - job_name: 'aws_exporter'
            scrape_interval: 10s
            static_configs:
              - targets: ['localhost:9106']
  service:
    pipelines:
      aws_pipeline:
        receivers:
          - aws
會捨棄 JVM 指標的設定
下列設定會執行基本設定的所有作業,但也會新增重新標記設定,以捨棄匯出工具產生的 JVM 指標。捨棄這些指標會減少擷取的指標資料,但可能會導致匯出工具的問題更難偵錯,因為您無法取得匯出工具本身的指標:
metrics:
  receivers:
    aws:
      type: prometheus
      config:
        scrape_configs:
          - job_name: 'aws_exporter'
            scrape_interval: 10s
            static_configs:
              - targets: ['localhost:9106']
            # Drop the exporter's own JVM metrics to reduce noise.
            metric_relabel_configs:
              - source_labels: [ __name__ ]
                regex: 'jvm_.*'
                action: drop
  service:
    pipelines:
      aws_pipeline:
        receivers:
          - aws
您可以為作業套件代理程式建立更複雜的設定。
重新啟動作業套件代理程式
如要將設定變更套用至 Ops Agent,請重新啟動代理程式。
- 如要重新啟動代理程式,請在執行個體上執行下列指令:
sudo service google-cloud-ops-agent restart
- 如要確定代理程式已重新啟動,請執行下列指令,並驗證「指標代理程式」和「Logging 代理程式」元件是否已啟動:
sudo systemctl status google-cloud-ops-agent"*"
在 Cloud Monitoring 中查看指標
在 Cloud Monitoring 中,您可以查詢 AWS CloudWatch 指標,並建立圖表,就像處理任何其他指標一樣。在 Metrics Explorer 介面中,您可以使用 PromQL 或查詢產生器介面。詳情請參閱「使用 Metrics Explorer 建立圖表」一文。
如果您建立了想要保留的圖表,可以將其儲存至自訂資訊主頁。詳情請參閱「資訊主頁總覽」。
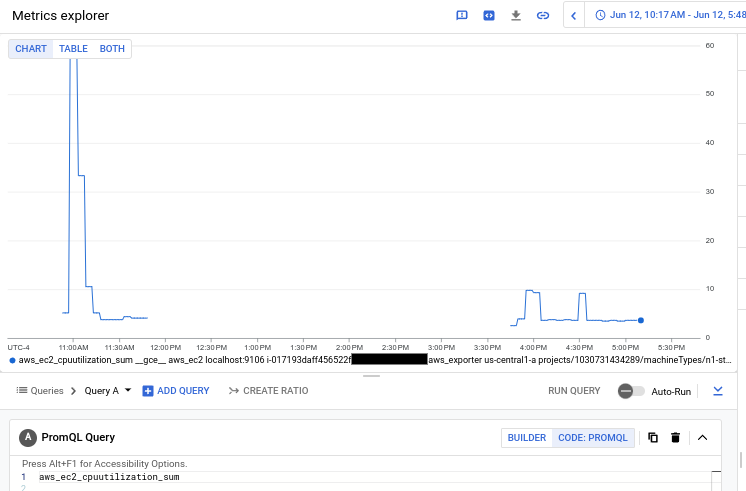
下圖顯示 AWS VM 的 aws_ec2_cpuutilization_sum 指標的 PromQL 查詢:
如要進一步瞭解如何在 Cloud Monitoring 中使用 PromQL,請參閱「適用於 Cloud Monitoring 的 PromQL」。
指標行為的快訊
在 Cloud Monitoring 中,您可以建立快訊政策,監控 AWS CloudWatch 指標,並在指標值出現尖峰、低谷或趨勢時收到通知。
監控多個區域
Prometheus CloudWatch 匯出工具的設定檔僅支援一個區域。如要監控多個區域,建議您執行多個 Prometheus 匯出工具執行個體,並為要監控的每個區域各設定一個執行個體。您可以在單一 VM 上執行多個匯出工具,也可以將這些工具分散到多個 VM 上。在這種情況下,Prometheus 匯出工具 Docker 映像檔可能會有幫助。
您可以設定在 Compute Engine VM 上執行的作業套件代理程式,抓取多個 Prometheus 端點。建議您設定多個 Prometheus 匯出工具執行個體時,為每個執行個體使用不同的 job 名稱,以便在需要排解匯出工具執行個體問題時加以區分。
如要瞭解如何設定作業套件代理程式和 Prometheus 接收器,請參閱「設定作業套件代理程式」。
費用
Amazon 會針對您提出的每項 CloudWatch API 要求或 CloudWatch 指標收費;如需目前價格,請參閱 Amazon CloudWatch 定價。Prometheus CloudWatch Exporter 具有下列查詢特徵,可能會影響 Amazon 費用:
- 使用
GetMetricStatistics 方法 (預設) 時,每個指標都需要一個 API 要求。每個要求可包含多項統計資料。
- 使用
aws_dimensions 時,匯出工具必須執行 API 要求,判斷要要求哪些指標。與指標要求數量相比,維度要求數量通常微不足道。
Cloud Monitoring 會根據擷取的樣本數,針對 Prometheus Exporter 提供的 AWS CloudWatch 指標收費。如要查看目前定價,請參閱 Google Cloud Observability 定價頁面的 Cloud Monitoring 部分。
遷移用的 Prometheus CloudWatch Exporter 設定
本節提供的設定會盡可能複製 AWS 指標清單中記錄的 AWS 服務指標。這些設定檔適用於從舊版解決方案遷移至 Prometheus CloudWatch 匯出工具的客戶。如果您是新使用者,而非遷移使用者,且您使用這些設定來設定 Prometheus CloudWatch Exporter,則您不會收集 Prometheus CloudWatch Exporter 提供的所有 AWS 指標。
如要查看 AWS CloudWatch 指標的範例設定檔,請展開下列其中一個章節。
applicationelb.yml
region: us-east-1
metrics:
- aws_namespace: AWS/ApplicationELB
  aws_metric_name: ActiveConnectionCount
  aws_dimensions: [AvailabilityZone, LoadBalancer]
- aws_namespace: AWS/ApplicationELB
  aws_metric_name: ClientTLSNegotiationErrorCount
  aws_dimensions: [AvailabilityZone, LoadBalancer]
- aws_namespace: AWS/ApplicationELB
  aws_metric_name: ConsumedLCUs
  aws_dimensions: [LoadBalancer]
- aws_namespace: AWS/ApplicationELB
  aws_metric_name: DesyncMitigationMode_NonCompliant_Request_Count
  aws_dimensions: [AvailabilityZone, LoadBalancer]
- aws_namespace: AWS/ApplicationELB
  aws_metric_name: DroppedInvalidHeaderRequestCount
  aws_dimensions: [AvailabilityZone, LoadBalancer]
- aws_namespace: AWS/ApplicationELB
  aws_metric_name: DroppedInvalidHeaderRequestCount
  aws_dimensions: [AvailabilityZone, LoadBalancer]
- aws_namespace: AWS/ApplicationELB
  aws_metric_name: ForwardedInvalidHeaderRequestCount
  aws_dimensions: [AvailabilityZone, LoadBalancer]
- aws_namespace: AWS/ApplicationELB
  aws_metric_name: GrpcRequestCount
  aws_dimensions: [AvailabilityZone, LoadBalancer]
- aws_namespace: AWS/ApplicationELB
  aws_metric_name: HTTP_Fixed_Response_Count
  aws_dimensions: [AvailabilityZone, LoadBalancer]
- aws_namespace: AWS/ApplicationELB
  aws_metric_name: HTTP_Redirect_Count
  aws_dimensions: [AvailabilityZone, LoadBalancer]
- aws_namespace: AWS/ApplicationELB
  aws_metric_name: HTTP_Redirect_Url_Limit_Exceeded_Count
  aws_dimensions: [AvailabilityZone, LoadBalancer]
- aws_namespace: AWS/ApplicationELB
  aws_metric_name: HTTPCode_ELB_3XX_Count
  aws_dimensions: [AvailabilityZone, LoadBalancer]
- aws_namespace: AWS/ApplicationELB
  aws_metric_name: HTTPCode_ELB_4XX_Count
  aws_dimensions: [AvailabilityZone, LoadBalancer]
- aws_namespace: AWS/ApplicationELB
  aws_metric_name: HTTPCode_ELB_5XX_Count
  aws_dimensions: [AvailabilityZone, LoadBalancer]
- aws_namespace: AWS/ApplicationELB
  aws_metric_name: HTTPCode_ELB_500_Count
  aws_dimensions: [AvailabilityZone, LoadBalancer]
- aws_namespace: AWS/ApplicationELB
  aws_metric_name: HTTPCode_ELB_502_Count
  aws_dimensions: [AvailabilityZone, LoadBalancer]
- aws_namespace: AWS/ApplicationELB
  aws_metric_name: HTTPCode_ELB_503_Count
  aws_dimensions: [AvailabilityZone, LoadBalancer]
- aws_namespace: AWS/ApplicationELB
  aws_metric_name: HTTPCode_ELB_504_Count
  aws_dimensions: [AvailabilityZone, LoadBalancer]
- aws_namespace: AWS/ApplicationELB
  aws_metric_name: IPv6ProcessedBytes
  aws_dimensions: [AvailabilityZone, LoadBalancer]
- aws_namespace: AWS/ApplicationELB
  aws_metric_name: IPv6RequestCount
  aws_dimensions: [AvailabilityZone, LoadBalancer]
- aws_namespace: AWS/ApplicationELB
  aws_metric_name: NewConnectionCount
  aws_dimensions: [AvailabilityZone, LoadBalancer]
- aws_namespace: AWS/ApplicationELB
  aws_metric_name: NonStickyRequestCount
  aws_dimensions: [AvailabilityZone, LoadBalancer]
- aws_namespace: AWS/ApplicationELB
  aws_metric_name: ProcessedBytes
  aws_dimensions: [AvailabilityZone, LoadBalancer]
- aws_namespace: AWS/ApplicationELB
  aws_metric_name: RejectedConnectionCount
  aws_dimensions: [AvailabilityZone, LoadBalancer]
- aws_namespace: AWS/ApplicationELB
  aws_metric_name: RequestCount
  aws_dimensions: [AvailabilityZone, TargetGroup, LoadBalancer]
- aws_namespace: AWS/ApplicationELB
  aws_metric_name: RuleEvaluations
  aws_dimensions: [LoadBalancer]
- aws_namespace: AWS/ApplicationELB
  aws_metric_name: HealthyHostCount
  aws_dimensions: [AvailabilityZone, TargetGroup, LoadBalancer]
- aws_namespace: AWS/ApplicationELB
  aws_metric_name: HTTPCode_Target_2XX_Count
  aws_dimensions: [AvailabilityZone, TargetGroup, LoadBalancer]
- aws_namespace: AWS/ApplicationELB
  aws_metric_name: HTTPCode_Target_3XX_Count
  aws_dimensions: [AvailabilityZone, TargetGroup, LoadBalancer]
- aws_namespace: AWS/ApplicationELB
  aws_metric_name: HTTPCode_Target_4XX_Count
  aws_dimensions: [AvailabilityZone, TargetGroup, LoadBalancer]
- aws_namespace: AWS/ApplicationELB
  aws_metric_name: HTTPCode_Target_5XX_Count
  aws_dimensions: [AvailabilityZone, TargetGroup, LoadBalancer]
- aws_namespace: AWS/ApplicationELB
  aws_metric_name: RequestCountPerTarget
  aws_dimensions: [AvailabilityZone, TargetGroup, LoadBalancer]
- aws_namespace: AWS/ApplicationELB
  aws_metric_name: TargetConnectionErrorCount
  aws_dimensions: [AvailabilityZone, TargetGroup, LoadBalancer]
- aws_namespace: AWS/ApplicationELB
  aws_metric_name: TargetResponseTime
  aws_dimensions: [AvailabilityZone, TargetGroup, LoadBalancer]
- aws_namespace: AWS/ApplicationELB
  aws_metric_name: TargetTLSNegotiationErrorCount
  aws_dimensions: [AvailabilityZone, TargetGroup, LoadBalancer]
- aws_namespace: AWS/ApplicationELB
  aws_metric_name: UnHealthyHostCount
  aws_dimensions: [AvailabilityZone, TargetGroup, LoadBalancer]
- aws_namespace: AWS/ApplicationELB
  aws_metric_name: HealthyStateDNS
  aws_dimensions: [AvailabilityZone, TargetGroup, LoadBalancer]
- aws_namespace: AWS/ApplicationELB
  aws_metric_name: HealthyStateRouting
  aws_dimensions: [AvailabilityZone, TargetGroup, LoadBalancer]
- aws_namespace: AWS/ApplicationELB
  aws_metric_name: UnhealthyRoutingRequestCount
  aws_dimensions: [AvailabilityZone, TargetGroup, LoadBalancer]
- aws_namespace: AWS/ApplicationELB
  aws_metric_name: UnhealthyStateDNS
  aws_dimensions: [AvailabilityZone, TargetGroup, LoadBalancer]
- aws_namespace: AWS/ApplicationELB
  aws_metric_name: UnhealthyStateRouting
  aws_dimensions: [AvailabilityZone, TargetGroup, LoadBalancer]
- aws_namespace: AWS/ApplicationELB
  aws_metric_name: LambdaInternalError
  aws_dimensions: [TargetGroup, LoadBalancer]
- aws_namespace: AWS/ApplicationELB
  aws_metric_name: LambdaTargetProcessedBytes
  aws_dimensions: [LoadBalancer]
- aws_namespace: AWS/ApplicationELB
  aws_metric_name: LambdaUserError
  aws_dimensions: [TargetGroup, LoadBalancer]
- aws_namespace: AWS/ApplicationELB
  aws_metric_name: ELBAuthError
  aws_dimensions: [AvailabilityZone, LoadBalancer]
- aws_namespace: AWS/ApplicationELB
  aws_metric_name: ELBAuthFailure
  aws_dimensions: [AvailabilityZone, LoadBalancer]
- aws_namespace: AWS/ApplicationELB
  aws_metric_name: ELBAuthLatency
  aws_dimensions: [AvailabilityZone, LoadBalancer]
- aws_namespace: AWS/ApplicationELB
  aws_metric_name: ELBAuthRefreshTokenSuccess
  aws_dimensions: [AvailabilityZone, LoadBalancer]
- aws_namespace: AWS/ApplicationELB
  aws_metric_name: ELBAuthSuccess
  aws_dimensions: [AvailabilityZone, LoadBalancer]
- aws_namespace: AWS/ApplicationELB
  aws_metric_name: ELBAuthUserClaimsSizeExceeded
  aws_dimensions: [AvailabilityZone, LoadBalancer]
cloudfront.yml
region: us-east-1
metrics:
- aws_dimensions:
  - DistributionId
  - Region
  aws_metric_name: Requests
  aws_namespace: AWS/CloudFront
- aws_dimensions:
  - DistributionId
  - Region
  aws_metric_name: BytesDownloaded
  aws_namespace: AWS/CloudFront
- aws_dimensions:
  - DistributionId
  - Region
  aws_metric_name: BytesUploaded
  aws_namespace: AWS/CloudFront
- aws_dimensions:
  - DistributionId
  - Region
  aws_metric_name: 4xxErrorRate
  aws_namespace: AWS/CloudFront
- aws_dimensions:
  - DistributionId
  - Region
  aws_metric_name: 5xxErrorRate
  aws_namespace: AWS/CloudFront
- aws_dimensions:
  - DistributionId
  - Region
  aws_metric_name: TotalErrorRate
  aws_namespace: AWS/CloudFront
dynamodb.yml
region: us-east-1
metrics:
- aws_dimensions:
  - TableName
  - GlobalSecondaryIndexName
  aws_metric_name: ConsumedReadCapacityUnits
  aws_namespace: AWS/DynamoDB
  aws_statistics:
  - Maximum
- aws_dimensions:
  - TableName
  - GlobalSecondaryIndexName
  aws_metric_name: ConsumedWriteCapacityUnits
  aws_namespace: AWS/DynamoDB
  aws_statistics:
  - Maximum
- aws_dimensions:
  - TableName
  - Operation
  aws_metric_name: ThrottledRequests
  aws_namespace: AWS/DynamoDB
  aws_statistics:
  - Sum
- aws_dimensions:
  - TableName
  - Operation
  aws_metric_name: SystemErrors
  aws_namespace: AWS/DynamoDB
  aws_statistics:
  - Sum
- aws_dimensions:
  - TableName
  - Operation
  aws_metric_name: SuccessfulRequestLatency
  aws_namespace: AWS/DynamoDB
  aws_statistics:
  - Maximum
- aws_dimensions:
  - TableName
  - GlobalSecondaryIndexName
  aws_metric_name: WriteThrottleEvents
  aws_namespace: AWS/DynamoDB
  aws_statistics:
  - Sum
- aws_dimensions:
  - TableName
  - GlobalSecondaryIndexName
  aws_metric_name: ReadThrottleEvents
  aws_namespace: AWS/DynamoDB
  aws_statistics:
  - Sum
ebs.yml
region: us-east-1
metrics:
- aws_dimensions:
  - VolumeId
  aws_metric_name: VolumeWriteBytes
  aws_namespace: AWS/EBS
  aws_statistics:
  - Maximum
  - Average
- aws_dimensions:
  - VolumeId
  aws_metric_name: VolumeReadBytes
  aws_namespace: AWS/EBS
  aws_statistics:
  - Maximum
  - Average
- aws_dimensions:
  - VolumeId
  aws_metric_name: VolumeReadOps
  aws_namespace: AWS/EBS
  aws_statistics:
  - Average
- aws_dimensions:
  - VolumeId
  aws_metric_name: VolumeWriteOps
  aws_namespace: AWS/EBS
  aws_statistics:
  - Average
- aws_dimensions:
  - VolumeId
  aws_metric_name: VolumeTotalReadTime
  aws_namespace: AWS/EBS
  aws_statistics:
  - Sum
  - Average
- aws_dimensions:
  - VolumeId
  aws_metric_name: VolumeTotalWriteTime
  aws_namespace: AWS/EBS
  aws_statistics:
  - Sum
  - Average
- aws_dimensions:
  - VolumeId
  aws_metric_name: VolumeQueueLength
  aws_namespace: AWS/EBS
  aws_statistics:
  - Average
- aws_dimensions:
  - VolumeId
  aws_metric_name: BurstBalance
  aws_namespace: AWS/EBS
  aws_statistics:
  - Average
- aws_dimensions:
  - VolumeId
  aws_metric_name: VolumeIdleTime
  aws_namespace: AWS/EBS
  aws_statistics:
  - Sum
ec2.yml
region: us-east-1
metrics:
- aws_dimensions:
  - InstanceId
  aws_metric_name: CPUUtilization
  aws_namespace: AWS/EC2
  aws_tag_select:
    resource_type_selection: ec2:instance
    resource_id_dimension: InstanceId
- aws_dimensions:
  - InstanceId
  aws_metric_name: NetworkIn
  aws_namespace: AWS/EC2
- aws_dimensions:
  - InstanceId
  aws_metric_name: NetworkOut
  aws_namespace: AWS/EC2
- aws_dimensions:
  - InstanceId
  aws_metric_name: NetworkPacketsIn
  aws_namespace: AWS/EC2
- aws_dimensions:
  - InstanceId
  aws_metric_name: NetworkPacketsOut
  aws_namespace: AWS/EC2
- aws_dimensions:
  - InstanceId
  aws_metric_name: DiskWriteBytes
  aws_namespace: AWS/EC2
- aws_dimensions:
  - InstanceId
  aws_metric_name: DiskReadBytes
  aws_namespace: AWS/EC2
- aws_dimensions:
  - InstanceId
  aws_metric_name: CPUCreditBalance
  aws_namespace: AWS/EC2
- aws_dimensions:
  - InstanceId
  aws_metric_name: CPUCreditUsage
  aws_namespace: AWS/EC2
- aws_dimensions:
  - InstanceId
  aws_metric_name: StatusCheckFailed
  aws_namespace: AWS/EC2
- aws_dimensions:
  - InstanceId
  aws_metric_name: StatusCheckFailed_Instance
  aws_namespace: AWS/EC2
- aws_dimensions:
  - InstanceId
  aws_metric_name: StatusCheckFailed_System
  aws_namespace: AWS/EC2
elasticache.yml
region: us-east-1
metrics:
- aws_namespace: AWS/ElastiCache
  aws_metric_name: ActiveDefragHits
  aws_dimensions:
  - CacheNodeId
  - CacheClusterId
- aws_namespace: AWS/ElastiCache
  aws_metric_name: AuthenticationFailures
  aws_dimensions:
  - CacheNodeId
  - CacheClusterId
- aws_namespace: AWS/ElastiCache
  aws_metric_name: BytesReadIntoMemcached
  aws_dimensions:
  - CacheNodeId
  - CacheClusterId
- aws_namespace: AWS/ElastiCache
  aws_metric_name: BytesUsedForCache
  aws_dimensions:
  - CacheNodeId
  - CacheClusterId
- aws_namespace: AWS/ElastiCache
  aws_metric_name: BytesUsedForCacheItems
  aws_dimensions:
  - CacheNodeId
  - CacheClusterId
- aws_namespace: AWS/ElastiCache
  aws_metric_name: BytesUsedForHash
  aws_dimensions:
  - CacheNodeId
  - CacheClusterId
- aws_namespace: AWS/ElastiCache
  aws_metric_name: BytesWrittenOutFromMemcached
  aws_dimensions:
  - CacheNodeId
  - CacheClusterId
- aws_namespace: AWS/ElastiCache
  aws_metric_name: CPUCreditBalance
  aws_dimensions:
  - CacheNodeId
  - CacheClusterId
- aws_namespace: AWS/ElastiCache
  aws_metric_name: CPUCreditUsage
  aws_dimensions:
  - CacheNodeId
  - CacheClusterId
- aws_namespace: AWS/ElastiCache
  aws_metric_name: CPUUtilization
  aws_dimensions:
  - CacheNodeId
  - CacheClusterId
- aws_namespace: AWS/ElastiCache
  aws_metric_name: CacheHits
  aws_dimensions:
  - CacheNodeId
  - CacheClusterId
- aws_namespace: AWS/ElastiCache
  aws_metric_name: CacheMisses
  aws_dimensions:
  - CacheNodeId
  - CacheClusterId
- aws_namespace: AWS/ElastiCache
  aws_metric_name: CasBadval
  aws_dimensions:
  - CacheNodeId
  - CacheClusterId
- aws_namespace: AWS/ElastiCache
  aws_metric_name: CasHits
  aws_dimensions:
  - CacheNodeId
  - CacheClusterId
- aws_namespace: AWS/ElastiCache
  aws_metric_name: CasMisses
  aws_dimensions:
  - CacheNodeId
  - CacheClusterId
- aws_namespace: AWS/ElastiCache
  aws_metric_name: CmdConfigGet
  aws_dimensions:
  - CacheNodeId
  - CacheClusterId
- aws_namespace: AWS/ElastiCache
  aws_metric_name: CmdConfigSet
  aws_dimensions:
  - CacheNodeId
  - CacheClusterId
- aws_namespace: AWS/ElastiCache
  aws_metric_name: CmdFlush
  aws_dimensions:
  - CacheNodeId
  - CacheClusterId
- aws_namespace: AWS/ElastiCache
  aws_metric_name: CmdGet
  aws_dimensions:
  - CacheNodeId
  - CacheClusterId
- aws_namespace: AWS/ElastiCache
  aws_metric_name: CmdSet
  aws_dimensions:
  - CacheNodeId
  - CacheClusterId
- aws_namespace: AWS/ElastiCache
  aws_metric_name: CmdTouch
  aws_dimensions:
  - CacheNodeId
  - CacheClusterId
- aws_namespace: AWS/ElastiCache
  aws_metric_name: CommandAuthorizationFailures
  aws_dimensions:
  - CacheNodeId
  - CacheClusterId
- aws_namespace: AWS/ElastiCache
  aws_metric_name: CrawlerItemsChecked
  aws_dimensions:
  - CacheNodeId
  - CacheClusterId
- aws_namespace: AWS/ElastiCache
  aws_metric_name: CurrConfig
  aws_dimensions:
  - CacheNodeId
  - CacheClusterId
- aws_namespace: AWS/ElastiCache
  aws_metric_name: CurrConnections
  aws_dimensions:
  - CacheNodeId
  - CacheClusterId
- aws_namespace: AWS/ElastiCache
  aws_metric_name: CurrItems
  aws_dimensions:
  - CacheNodeId
  - CacheClusterId
- aws_namespace: AWS/ElastiCache
  aws_metric_name: CurrVolatileItems
  aws_dimensions:
  - CacheNodeId
  - CacheClusterId
- aws_namespace: AWS/ElastiCache
  aws_metric_name: DatabaseMemoryUsageCountedForEvictPercentage
  aws_dimensions:
  - NodeGroupId
  - ReplciationGroupId
- aws_namespace: AWS/ElastiCache
  aws_metric_name: DatabaseMemoryUsagePercentage
  aws_dimensions:
  - CacheNodeId
  - CacheClusterId
- aws_namespace: AWS/ElastiCache
  aws_metric_name: DecrHits
  aws_dimensions:
  - CacheNodeId
  - CacheClusterId
- aws_namespace: AWS/ElastiCache
  aws_metric_name: DecrMisses
  aws_dimensions:
  - CacheNodeId
  - CacheClusterId
- aws_namespace: AWS/ElastiCache
  aws_metric_name: DeleteHits
  aws_dimensions:
  - CacheNodeId
  - CacheClusterId
- aws_namespace: AWS/ElastiCache
  aws_metric_name: DeleteMisses
  aws_dimensions:
  - CacheNodeId
  - CacheClusterId
- aws_namespace: AWS/ElastiCache
  aws_metric_name: EngineCPUUtilization
  aws_dimensions:
  - CacheNodeId
  - CacheClusterId
  - NodeGroupId
  - ReplicationGroupId
  - Role
- aws_namespace: AWS/ElastiCache
  aws_metric_name: EvictedUnfetched
  aws_dimensions:
  - CacheNodeId
  - CacheClusterId
- aws_namespace: AWS/ElastiCache
  aws_metric_name: Evictions
  aws_dimensions:
  - CacheNodeId
  - CacheClusterId
- aws_namespace: AWS/ElastiCache
  aws_metric_name: ExpiredUnfetched
  aws_dimensions:
  - CacheNodeId
  - CacheClusterId
- aws_namespace: AWS/ElastiCache
  aws_metric_name: FreeableMemory
  aws_dimensions:
  - CacheNodeId
  - CacheClusterId
- aws_namespace: AWS/ElastiCache
  aws_metric_name: GetHits
  aws_dimensions:
  - CacheNodeId
  - CacheClusterId
- aws_namespace: AWS/ElastiCache
  aws_metric_name: GetMisses
  aws_dimensions:
  - CacheNodeId
  - CacheClusterId
- aws_namespace: AWS/ElastiCache
  aws_metric_name: IamAuthenticationExpirations
  aws_dimensions:
  - CacheNodeId
  - CacheClusterId
- aws_namespace: AWS/ElastiCache
  aws_metric_name: IamAuthenticationThrottling
  aws_dimensions:
  - CacheNodeId
  - CacheClusterId
- aws_namespace: AWS/ElastiCache
  aws_metric_name: IncrHits
  aws_dimensions:
  - CacheNodeId
  - CacheClusterId
- aws_namespace: AWS/ElastiCache
  aws_metric_name: IncrMisses
  aws_dimensions:
  - CacheNodeId
  - CacheClusterId
- aws_namespace: AWS/ElastiCache
  aws_metric_name: IsMaster
  aws_dimensions:
  - CacheNodeId
  - CacheClusterId
- aws_namespace: AWS/ElastiCache
  aws_metric_name: KeyAuthorizationFailures
  aws_dimensions:
  - CacheNodeId
  - CacheClusterId
- aws_namespace: AWS/ElastiCache
  aws_metric_name: KeyBasedCmds
  aws_dimensions:
  - CacheNodeId
  - CacheClusterId
- aws_namespace: AWS/ElastiCache
  aws_metric_name: ListBasedCmds
  aws_dimensions:
  - CacheNodeId
  - CacheClusterId
- aws_namespace: AWS/ElastiCache
  aws_metric_name: KeysTracked
  aws_dimensions:
  - CacheNodeId
  - CacheClusterId
- aws_namespace: AWS/ElastiCache
  aws_metric_name: MasterLinkHealthStatus
  aws_dimensions:
  - CacheNodeId
  - CacheClusterId
- aws_namespace: AWS/ElastiCache
  aws_metric_name: MemoryFragmentationRatio
  aws_dimensions:
  - CacheNodeId
  - CacheClusterId
- aws_namespace: AWS/ElastiCache
  aws_metric_name: NetworkBandwidthInAllowanceExceeded
  aws_dimensions:
  - CacheNodeId
  - CacheClusterId
- aws_namespace: AWS/ElastiCache
  aws_metric_name: NetworkBandwidthOutAllowanceExceeded
  aws_dimensions:
  - CacheNodeId
  - CacheClusterId
- aws_namespace: AWS/ElastiCache
  aws_metric_name: NetworkBytesIn
  aws_dimensions:
  - CacheNodeId
  - CacheClusterId
- aws_namespace: AWS/ElastiCache
  aws_metric_name: NetworkBytesOut
  aws_dimensions:
  - CacheNodeId
  - CacheClusterId
- aws_namespace: AWS/ElastiCache
  aws_metric_name: NetworkConntrackAllowanceExceeded
  aws_dimensions:
  - CacheNodeId
  - CacheClusterId
- aws_namespace: AWS/ElastiCache
  aws_metric_name: NetworkPacketsIn
  aws_dimensions:
  - CacheNodeId
  - CacheClusterId
- aws_namespace: AWS/ElastiCache
  aws_metric_name: NetworkPacketsOut
  aws_dimensions:
  - CacheNodeId
  - CacheClusterId
- aws_namespace: AWS/ElastiCache
  aws_metric_name: NetworkPacketsPerSecondAllowanceExceeded
  aws_dimensions:
  - CacheNodeId
  - CacheClusterId
- aws_namespace: AWS/ElastiCache
  aws_metric_name: NewConnections
  aws_dimensions:
  - CacheNodeId
  - CacheClusterId
- aws_namespace: AWS/ElastiCache
  aws_metric_name: NewItems
  aws_dimensions:
  - CacheNodeId
  - CacheClusterId
- aws_namespace: AWS/ElastiCache
  aws_metric_name: NonKeyTypeCmds
  aws_dimensions:
  - CacheNodeId
  - CacheClusterId
- aws_namespace: AWS/ElastiCache
  aws_metric_name: NonKeyTypeCmdsLatency
  aws_dimensions:
  - CacheNodeId
  - CacheClusterId
- aws_namespace: AWS/ElastiCache
  aws_metric_name: Reclaimed
  aws_dimensions:
  - CacheNodeId
  - CacheClusterId
- aws_namespace: AWS/ElastiCache
  aws_metric_name: ReplicationBytes
  aws_dimensions:
  - CacheNodeId
  - CacheClusterId
- aws_namespace: AWS/ElastiCache
  aws_metric_name: ReplicationLag
  aws_dimensions:
  - CacheNodeId
  - CacheClusterId
- aws_namespace: AWS/ElastiCache
  aws_metric_name: SetBasedCmds
  aws_dimensions:
  - CacheNodeId
  - CacheClusterId
- aws_namespace: AWS/ElastiCache
  aws_metric_name: SetTypeCmds
  aws_dimensions:
  - CacheNodeId
  - CacheClusterId
- aws_namespace: AWS/ElastiCache
  aws_metric_name: SlabsMoved
  aws_dimensions:
  - CacheNodeId
  - CacheClusterId
- aws_namespace: AWS/ElastiCache
  aws_metric_name: SortedSetBasedCmds
  aws_dimensions:
  - CacheNodeId
  - CacheClusterId
- aws_namespace: AWS/ElastiCache
  aws_metric_name: StringBasedCmds
  aws_dimensions:
  - CacheNodeId
  - CacheClusterId
- aws_namespace: AWS/ElastiCache
  aws_metric_name: SaveInProgress
  aws_dimensions:
  - CacheNodeId
  - CacheClusterId
- aws_namespace: AWS/ElastiCache
  aws_metric_name: SwapUsage
  aws_dimensions:
  - CacheNodeId
  - CacheClusterId
- aws_namespace: AWS/ElastiCache
  aws_metric_name: TouchHits
  aws_dimensions:
  - CacheNodeId
  - CacheClusterId
- aws_namespace: AWS/ElastiCache
  aws_metric_name: TouchMisses
  aws_dimensions:
  - CacheNodeId
  - CacheClusterId
- aws_namespace: AWS/ElastiCache
  aws_metric_name: TrafficManagementActive
  aws_dimensions:
  - CacheNodeId
  - CacheClusterId
- aws_namespace: AWS/ElastiCache
  aws_metric_name: UnusedMemory
  aws_dimensions:
  - CacheNodeId
  - CacheClusterId
elb.yml
region: us-east-1
metrics:
- aws_dimensions:
  - AvailabilityZone
  aws_metric_name: BackendConnectionErrors
  aws_namespace: AWS/ELB
- aws_dimensions:
  - AvailabilityZone
  aws_metric_name: HTTPCode_Backend_5XX
  aws_namespace: AWS/ELB
- aws_dimensions:
  - AvailabilityZone
  aws_metric_name: HTTPCode_Backend_4XX
  aws_namespace: AWS/ELB
- aws_dimensions:
  - AvailabilityZone
  aws_metric_name: HTTPCode_Backend_3XX
  aws_namespace: AWS/ELB
- aws_dimensions:
  - AvailabilityZone
  aws_metric_name: HTTPCode_Backend_2XX
  aws_namespace: AWS/ELB
- aws_dimensions:
  - AvailabilityZone
  aws_metric_name: HTTPCode_ELB_5XX
  aws_namespace: AWS/ELB
- aws_dimensions:
  - AvailabilityZone
  aws_metric_name: RequestCount
  aws_namespace: AWS/ELB
- aws_dimensions:
  - AvailabilityZone
  aws_metric_name: HTTPCode_ELB_4XX
  aws_namespace: AWS/ELB
- aws_dimensions:
  - AvailabilityZone
  aws_metric_name: Latency
  aws_namespace: AWS/ELB
- aws_dimensions:
  - AvailabilityZone
  aws_metric_name: SurgeQueueLength
  aws_namespace: AWS/ELB
- aws_dimensions:
  - AvailabilityZone
  aws_metric_name: ActiveFlowCount
  aws_namespace: AWS/ELB
- aws_dimensions:
  - AvailabilityZone
  aws_metric_name: ActiveFlowCount_TLS
  aws_namespace: AWS/ELB
- aws_dimensions:
  - AvailabilityZone
  aws_metric_name: ProcessedBytes
  aws_namespace: AWS/ELB
- aws_dimensions:
  - AvailabilityZone
  aws_metric_name: ProcessedBytes_TLS
  aws_namespace: AWS/ELB
- aws_dimensions:
  - AvailabilityZone
  aws_metric_name: HealthyHostCount
  aws_namespace: AWS/ELB
- aws_dimensions:
  - AvailabilityZone
  aws_metric_name: UnHealthyHostCount
  aws_namespace: AWS/ELB
- aws_dimensions:
  - AvailabilityZone
  aws_metric_name: NewFlowCount
  aws_namespace: AWS/ELB
- aws_dimensions:
  - AvailabilityZone
  aws_metric_name: NewFlowCount_TLS
  aws_namespace: AWS/ELB
- aws_dimensions:
  - AvailabilityZone
  aws_metric_name: TCP_Client_Reset_Count
  aws_namespace: AWS/ELB
- aws_dimensions:
  - AvailabilityZone
  aws_metric_name: TCP_Target_Reset_Count
  aws_namespace: AWS/ELB
- aws_dimensions:
  - AvailabilityZone
  aws_metric_name: TCP_ELB_Reset_Count
  aws_namespace: AWS/ELB
- aws_dimensions:
  - AvailabilityZone
  aws_metric_name: ClientTLSNegotiationErrorCount
  aws_namespace: AWS/ELB
- aws_dimensions:
  - AvailabilityZone
  aws_metric_name: TargetTLSNegotiationErrorCount
  aws_namespace: AWS/ELB
- aws_dimensions:
  - AvailabilityZone
  aws_metric_name: ConsumedLCUs
  aws_namespace: AWS/ELB
- aws_dimensions:
  - AvailabilityZone
  aws_metric_name: SpilloverCount
  aws_namespace: AWS/ELB
kinesis.yml
region: us-east-2
metrics:
- aws_dimensions:
  - StreamName
  aws_metric_name: IncomingBytes
  aws_namespace: AWS/Kinesis
- aws_dimensions:
  - StreamName
  aws_metric_name: PutRecord.Bytes
  aws_namespace: AWS/Kinesis
- aws_dimensions:
  - StreamName
  aws_metric_name: PutRecords.Bytes
  aws_namespace: AWS/Kinesis
- aws_dimensions:
  - StreamName
  aws_metric_name: GetRecords.Latency
  aws_namespace: AWS/Kinesis
- aws_dimensions:
  - StreamName
  aws_metric_name: PutRecord.Success
  aws_namespace: AWS/Kinesis
- aws_dimensions:
  - StreamName
  aws_metric_name: PutRecords.Success
  aws_namespace: AWS/Kinesis
- aws_dimensions:
  - StreamName
  aws_metric_name: GetRecords.Latency
  aws_namespace: AWS/Kinesis
- aws_dimensions:
  - StreamName
  aws_metric_name: PutRecord.Latency
  aws_namespace: AWS/Kinesis
- aws_dimensions:
  - StreamName
  aws_metric_name: PutRecords.Latency
  aws_namespace: AWS/Kinesis
- aws_dimensions:
  - StreamName
  aws_metric_name: GetRecords.Latency
  aws_namespace: AWS/Kinesis
- aws_dimensions:
  - StreamName
  aws_metric_name: GetRecords.Records
  aws_namespace: AWS/Kinesis
- aws_dimensions:
  - StreamName
  aws_metric_name: GetRecords.Bytes
  aws_namespace: AWS/Kinesis
- aws_dimensions:
  - StreamName
  aws_metric_name: GetRecords.Success
  aws_namespace: AWS/Kinesis
- aws_dimensions:
  - StreamName
  aws_metric_name: GetRecords.IteratorAgeMilliseconds
  aws_namespace: AWS/Kinesis
- aws_dimensions:
  - StreamName
  aws_metric_name: IncomingRecords
  aws_namespace: AWS/Kinesis
- aws_dimensions:
  - StreamName
  aws_metric_name: IncomingBytes
  aws_namespace: AWS/Kinesis
- aws_dimensions:
  - StreamName
  aws_metric_name: WriteProvisionedThroughputExceeded
  aws_namespace: AWS/Kinesis
- aws_dimensions:
  - StreamName
  aws_metric_name: ReadProvisionedThroughputExceeded
  aws_namespace: AWS/Kinesis
lambda.yml
region: us-east-1
metrics:
- aws_dimensions:
  - FunctionName
  - Resource
  aws_metric_name: Invocations
  aws_namespace: AWS/Lambda
- aws_dimensions:
  - FunctionName
  - Resource
  aws_metric_name: Errors
  aws_namespace: AWS/Lambda
- aws_dimensions:
  - FunctionName
  - Resource
  aws_metric_name: Duration
  aws_namespace: AWS/Lambda
- aws_dimensions:
  - FunctionName
  - Resource
  aws_metric_name: Throttles
  aws_namespace: AWS/Lambda
- aws_dimensions:
  - FunctionName
  - Resource
  aws_metric_name: ConcurrentExecutions
  aws_namespace: AWS/Lambda
- aws_dimensions:
  - FunctionName
  - Resource
  aws_metric_name: UnreservedConcurrentExecutions
  aws_namespace: AWS/Lambda
networkelb.yml
region: us-east-1
metrics:
- aws_dimensions:
  - AvailabilityZone
  - LoadBalancer
  - TargetGroup
  aws_metric_name: ActiveFlowCount
  aws_namespace: AWS/NetworkELB
  aws_statistics:
  - Average
- aws_dimensions:
  - AvailabilityZone
  - LoadBalancer
  - TargetGroup
  aws_metric_name: ActiveFlowCount_TCP
  aws_namespace: AWS/NetworkELB
  aws_statistics:
  - Average
- aws_dimensions:
  - AvailabilityZone
  - LoadBalancer
  - TargetGroup
  aws_metric_name: ActiveFlowCount_UDP
  aws_namespace: AWS/NetworkELB
  aws_statistics:
  - Average
- aws_dimensions:
  - AvailabilityZone
  - LoadBalancer
  - TargetGroup
  aws_metric_name: ClientTLSNegotiationErrorCount
  aws_namespace: AWS/NetworkELB
  aws_statistics:
  - Sum
- aws_dimensions:
  - LoadBalancer
  aws_metric_name: ConsumedLCUs
  aws_namespace: AWS/NetworkELB
  aws_statistics:
  - Average
- aws_dimensions:
  - LoadBalancer
  aws_metric_name: ConsumedLCUs_TCP
  aws_namespace: AWS/NetworkELB
  aws_statistics:
  - Average
- aws_dimensions:
  - LoadBalancer
  aws_metric_name: ConsumedLCUs_TLS
  aws_namespace: AWS/NetworkELB
  aws_statistics:
  - Average
- aws_dimensions:
  - LoadBalancer
  aws_metric_name: ConsumedLCUs_UDP
  aws_namespace: AWS/NetworkELB
  aws_statistics:
  - Average
- aws_dimensions:
  - AvailabilityZone
  - LoadBalancer
  - TargetGroup
  aws_metric_name: HealthyHostCount
  aws_namespace: AWS/NetworkELB
  aws_statistics:
  - Minimum
- aws_dimensions:
  - AvailabilityZone
  - LoadBalancer
  - TargetGroup
  aws_metric_name: NewFlowCount
  aws_namespace: AWS/NetworkELB
  aws_statistics:
  - Sum
- aws_dimensions:
  - AvailabilityZone
  - LoadBalancer
  - TargetGroup
  aws_metric_name: NewFlowCount_TCP
  aws_namespace: AWS/NetworkELB
  aws_statistics:
  - Sum
- aws_dimensions:
  - AvailabilityZone
  - LoadBalancer
  - TargetGroup
  aws_metric_name: NewFlowCount_TLS
  aws_namespace: AWS/NetworkELB
  aws_statistics:
  - Sum
- aws_dimensions:
  - AvailabilityZone
  - LoadBalancer
  - TargetGroup
  aws_metric_name: NewFlowCount_UDP
  aws_namespace: AWS/NetworkELB
  aws_statistics:
  - Sum
- aws_dimensions:
  - AvailabilityZone
  - LoadBalancer
  - TargetGroup
  aws_metric_name: ProcessedBytes
  aws_namespace: AWS/NetworkELB
  aws_statistics:
  - Sum
- aws_dimensions:
  - AvailabilityZone
  - LoadBalancer
  - TargetGroup
  aws_metric_name: ProcessedBytes_TLS
  aws_namespace: AWS/NetworkELB
  aws_statistics:
  - Sum
- aws_dimensions:
  - AvailabilityZone
  - LoadBalancer
  - TargetGroup
  aws_metric_name: ProcessedBytes_UDP
  aws_namespace: AWS/NetworkELB
  aws_statistics:
  - Sum
- aws_dimensions:
  - AvailabilityZone
  - LoadBalancer
  - TargetGroup
  aws_metric_name: ProcessedPackets
  aws_namespace: AWS/NetworkELB
  aws_statistics:
  - Sum
- aws_dimensions:
  - AvailabilityZone
  - LoadBalancer
  - TargetGroup
  aws_metric_name: TargetTLSNegotiationErrorCount
  aws_namespace: AWS/NetworkELB
  aws_statistics:
  - Sum
- aws_dimensions:
  - AvailabilityZone
  - LoadBalancer
  - TargetGroup
  aws_metric_name: TCP_Client_Reset_Count
  aws_namespace: AWS/NetworkELB
  aws_statistics:
  - Sum
- aws_dimensions:
  - AvailabilityZone
  - LoadBalancer
  - TargetGroup
  aws_metric_name: TCP_Target_Reset_Count
  aws_namespace: AWS/NetworkELB
  aws_statistics:
  - Sum
- aws_dimensions:
  - AvailabilityZone
  - LoadBalancer
  - TargetGroup
  aws_metric_name: UnHealthyHostCount
  aws_namespace: AWS/NetworkELB
  aws_statistics:
  - Maximum
rds.yml
region: us-east-1
metrics:
- aws_dimensions:
  - DBInstanceIdentifier
  aws_metric_name: BinLogDiskUsage
  aws_namespace: AWS/RDS
- aws_dimensions:
  - DBInstanceIdentifier
  aws_metric_name: DatabaseConnections
  aws_namespace: AWS/RDS
- aws_dimensions:
  - DBInstanceIdentifier
  aws_metric_name: FreeStorageSpace
  aws_namespace: AWS/RDS
- aws_dimensions:
  - DBInstanceIdentifier
  aws_metric_name: FreeableMemory
  aws_namespace: AWS/RDS
- aws_dimensions:
  - DBInstanceIdentifier
  aws_metric_name: ReadIOPS
  aws_namespace: AWS/RDS
- aws_dimensions:
  - DBInstanceIdentifier
  aws_metric_name: WriteIOPS
  aws_namespace: AWS/RDS
- aws_dimensions:
  - DBInstanceIdentifier
  aws_metric_name: ReadLatency
  aws_namespace: AWS/RDS
- aws_dimensions:
  - DBInstanceIdentifier
  aws_metric_name: WriteLatency
  aws_namespace: AWS/RDS
- aws_dimensions:
  - DBInstanceIdentifier
  aws_metric_name: ReadThroughput
  aws_namespace: AWS/RDS
- aws_dimensions:
  - DBInstanceIdentifier
  aws_metric_name: WriteThroughput
  aws_namespace: AWS/RDS
- aws_dimensions:
  - DBInstanceIdentifier
  aws_metric_name: CPUCreditUsage
  aws_namespace: AWS/RDS
- aws_dimensions:
  - DBInstanceIdentifier
  aws_metric_name: ReplicaLag
  aws_namespace: AWS/RDS
- aws_dimensions:
  - DBInstanceIdentifier
  aws_metric_name: CPUUtilization
  aws_namespace: AWS/RDS
- aws_dimensions:
  - DBInstanceIdentifier
  aws_metric_name: CPUCreditBalance
  aws_namespace: AWS/RDS
- aws_dimensions:
  - DBInstanceIdentifier
  aws_metric_name: DiskQueueDepth
  aws_namespace: AWS/RDS
- aws_dimensions:
  - DBInstanceIdentifier
  aws_metric_name: NetworkTransmitThroughput
  aws_namespace: AWS/RDS
- aws_dimensions:
  - DBInstanceIdentifier
  aws_metric_name: NetworkReceiveThroughput
  aws_namespace: AWS/RDS
- aws_dimensions:
  - DBInstanceIdentifier
  aws_metric_name: TransactionLogsDiskUsage
  aws_namespace: AWS/RDS
- aws_dimensions:
  - DBInstanceIdentifier
  aws_metric_name: SwapUsage
  aws_namespace: AWS/RDS
- aws_dimensions:
  - EngineName
  aws_metric_name: BinLogDiskUsage
  aws_namespace: AWS/RDS
- aws_dimensions:
  - EngineName
  aws_metric_name: DatabaseConnections
  aws_namespace: AWS/RDS
- aws_dimensions:
  - EngineName
  aws_metric_name: FreeStorageSpace
  aws_namespace: AWS/RDS
- aws_dimensions:
  - EngineName
  aws_metric_name: FreeableMemory
  aws_namespace: AWS/RDS
- aws_dimensions:
  - EngineName
  aws_metric_name: ReadIOPS
  aws_namespace: AWS/RDS
- aws_dimensions:
  - EngineName
  aws_metric_name: WriteIOPS
  aws_namespace: AWS/RDS
- aws_dimensions:
  - EngineName
  aws_metric_name: ReadLatency
  aws_namespace: AWS/RDS
- aws_dimensions:
  - EngineName
  aws_metric_name: WriteLatency
  aws_namespace: AWS/RDS
- aws_dimensions:
  - EngineName
  aws_metric_name: ReadThroughput
  aws_namespace: AWS/RDS
- aws_dimensions:
  - EngineName
  aws_metric_name: WriteThroughput
  aws_namespace: AWS/RDS
- aws_dimensions:
  - EngineName
  aws_metric_name: CPUCreditUsage
  aws_namespace: AWS/RDS
- aws_dimensions:
  - EngineName
  aws_metric_name: ReplicaLag
  aws_namespace: AWS/RDS
- aws_dimensions:
  - EngineName
  aws_metric_name: CPUUtilization
  aws_namespace: AWS/RDS
- aws_dimensions:
  - EngineName
  aws_metric_name: CPUCreditBalance
  aws_namespace: AWS/RDS
- aws_dimensions:
  - EngineName
  aws_metric_name: DiskQueueDepth
  aws_namespace: AWS/RDS
- aws_dimensions:
  - EngineName
  aws_metric_name: NetworkTransmitThroughput
  aws_namespace: AWS/RDS
- aws_dimensions:
  - EngineName
  aws_metric_name: NetworkReceiveThroughput
  aws_namespace: AWS/RDS
- aws_dimensions:
  - EngineName
  aws_metric_name: TransactionLogsDiskUsage
  aws_namespace: AWS/RDS
- aws_dimensions:
  - EngineName
  aws_metric_name: SwapUsage
  aws_namespace: AWS/RDS
- aws_dimensions:
  - DatabaseClass
  aws_metric_name: BinLogDiskUsage
  aws_namespace: AWS/RDS
- aws_dimensions:
  - DatabaseClass
  aws_metric_name: DatabaseConnections
  aws_namespace: AWS/RDS
- aws_dimensions:
  - DatabaseClass
  aws_metric_name: FreeStorageSpace
  aws_namespace: AWS/RDS
- aws_dimensions:
  - DatabaseClass
  aws_metric_name: FreeableMemory
  aws_namespace: AWS/RDS
- aws_dimensions:
  - DatabaseClass
  aws_metric_name: ReadIOPS
  aws_namespace: AWS/RDS
- aws_dimensions:
  - DatabaseClass
  aws_metric_name: WriteIOPS
  aws_namespace: AWS/RDS
- aws_dimensions:
  - DatabaseClass
  aws_metric_name: ReadLatency
  aws_namespace: AWS/RDS
- aws_dimensions:
  - DatabaseClass
  aws_metric_name: WriteLatency
  aws_namespace: AWS/RDS
- aws_dimensions:
  - DatabaseClass
  aws_metric_name: ReadThroughput
  aws_namespace: AWS/RDS
- aws_dimensions:
  - DatabaseClass
  aws_metric_name: WriteThroughput
  aws_namespace: AWS/RDS
- aws_dimensions:
  - DatabaseClass
  aws_metric_name: CPUCreditUsage
  aws_namespace: AWS/RDS
- aws_dimensions:
  - DatabaseClass
  aws_metric_name: ReplicaLag
  aws_namespace: AWS/RDS
- aws_dimensions:
  - DatabaseClass
  aws_metric_name: CPUUtilization
  aws_namespace: AWS/RDS
- aws_dimensions:
  - DatabaseClass
  aws_metric_name: CPUCreditBalance
  aws_namespace: AWS/RDS
- aws_dimensions:
  - DatabaseClass
  aws_metric_name: DiskQueueDepth
  aws_namespace: AWS/RDS
- aws_dimensions:
  - DatabaseClass
  aws_metric_name: NetworkTransmitThroughput
  aws_namespace: AWS/RDS
- aws_dimensions:
  - DatabaseClass
  aws_metric_name: NetworkReceiveThroughput
  aws_namespace: AWS/RDS
- aws_dimensions:
  - DatabaseClass
  aws_metric_name: TransactionLogsDiskUsage
  aws_namespace: AWS/RDS
- aws_dimensions:
  - DatabaseClass
  aws_metric_name: SwapUsage
  aws_namespace: AWS/RDS
redshift.yml
region: us-east-2
metrics:
- aws_dimensions:
  - ClusterIdentifier
  - NodeID
  aws_metric_name: HealthStatus
  aws_namespace: AWS/Redshift
- aws_dimensions:
  - ClusterIdentifier
  - NodeID
  aws_metric_name: CPUUtilization
  aws_namespace: AWS/Redshift
- aws_dimensions:
  - ClusterIdentifier
  - NodeID
  aws_metric_name: DatabaseConnections
  aws_namespace: AWS/Redshift
- aws_dimensions:
  - ClusterIdentifier
  - NodeID
  aws_metric_name: MaintenanceMode
  aws_namespace: AWS/Redshift
- aws_dimensions:
  - ClusterIdentifier
  - NodeID
  aws_metric_name: NetworkReceiveThroughput
  aws_namespace: AWS/Redshift
- aws_dimensions:
  - ClusterIdentifier
  - NodeID
  aws_metric_name: NetworkTransmitThroughput
  aws_namespace: AWS/Redshift
- aws_dimensions:
  - ClusterIdentifier
  - NodeID
  aws_metric_name: ReadIOPS
  aws_namespace: AWS/Redshift
- aws_dimensions:
  - ClusterIdentifier
  - NodeID
  aws_metric_name: WriteIOPS
  aws_namespace: AWS/Redshift
- aws_dimensions:
  - ClusterIdentifier
  - NodeID
  aws_metric_name: ReadLatency
  aws_namespace: AWS/Redshift
- aws_dimensions:
  - ClusterIdentifier
  - NodeID
  aws_metric_name: WriteLatency
  aws_namespace: AWS/Redshift
- aws_dimensions:
  - ClusterIdentifier
  - NodeID
  aws_metric_name: ReadThroughput
  aws_namespace: AWS/Redshift
- aws_dimensions:
  - ClusterIdentifier
  - NodeID
  aws_metric_name: WriteThroughput
  aws_namespace: AWS/Redshift
- aws_dimensions:
  - ClusterIdentifier
  - NodeID
  aws_metric_name: QueryDuration
  aws_namespace: AWS/Redshift
- aws_dimensions:
  - ClusterIdentifier
  - NodeID
  aws_metric_name: QueriesCompletedPerSecond
  aws_namespace: AWS/Redshift
- aws_dimensions:
  - ClusterIdentifier
  - NodeID
  aws_metric_name: PercentageDiskSpaceUsed
  aws_namespace: AWS/Redshift
s3.yml
region: us-east-1
metrics:
- aws_dimensions:
  - BucketName
  - FilterId
  aws_metric_name: 4xxErrors
  aws_namespace: AWS/S3
- aws_dimensions:
  - BucketName
  - FilterId
  aws_metric_name: 5xxErrors
  aws_namespace: AWS/S3
- aws_dimensions:
  - BucketName
  - FilterId
  aws_metric_name: AllRequests
  aws_namespace: AWS/S3
- aws_dimensions:
  - BucketName
  - FilterId
  aws_metric_name: FirstByteLatency
  aws_namespace: AWS/S3
- aws_dimensions:
  - BucketName
  - FilterId
  aws_metric_name: TotalRequestLatency
  aws_namespace: AWS/S3
- aws_dimensions:
  - BucketName
  - FilterId
  aws_metric_name: BytesDownloaded
  aws_namespace: AWS/S3
- aws_dimensions:
  - BucketName
  - FilterId
  aws_metric_name: BytesUploaded
  aws_namespace: AWS/S3
- aws_dimensions:
  - BucketName
  - FilterId
  aws_metric_name: PutRequests
  aws_namespace: AWS/S3
- aws_dimensions:
  - BucketName
  - FilterId
  aws_metric_name: ListRequests
  aws_namespace: AWS/S3
- aws_dimensions:
  - BucketName
  - FilterId
  aws_metric_name: HeadRequests
  aws_namespace: AWS/S3
- aws_dimensions:
  - BucketName
  - FilterId
  aws_metric_name: GetRequests
  aws_namespace: AWS/S3
- aws_namespace: AWS/S3
  aws_metric_name: BucketSizeBytes
  aws_dimensions: [BucketName, StorageType]
  range_seconds: 172800
  period_seconds: 86400
  set_timestamp: false
- aws_namespace: AWS/S3
  aws_metric_name: NumberOfObjects
  aws_dimensions: [BucketName, StorageType]
  range_seconds: 172800
  period_seconds: 86400
  set_timestamp: false
  # In case you want to use some bucket level Tag to select buckets to monitor,
  # or to have additional `info` metric with all bucket Tags as labels, use `aws_tag_select`:
  aws_tag_select:
    tag_selections:
      Monitoring: ["enabled"]
    resource_type_selection: "s3:"
    resource_id_dimension: BucketName
ses.yml
region: us-east-1
metrics:
- aws_namespace: AWS/SES
  aws_metric_name: Bounce
  aws_dimensions: []
  aws_statistics: []
- aws_namespace: AWS/SES
  aws_metric_name: Complaint
  aws_dimensions: []
  aws_statistics: []
- aws_namespace: AWS/SES
  aws_metric_name: Delivery
  aws_dimensions: []
  aws_statistics: []
- aws_namespace: AWS/SES
  aws_metric_name: Reputation.BounceRate
  aws_dimensions: []
  aws_statistics: []
- aws_namespace: AWS/SES
  aws_metric_name: Reputation.ComplaintRate
  aws_dimensions: []
  aws_statistics: []
- aws_namespace: AWS/SES
  aws_metric_name: Send
  aws_dimensions: []
  aws_statistics: []
- aws_namespace: AWS/SES
  aws_metric_name: Reject
  aws_dimensions: []
  aws_statistics: []
sns.yml
region: us-east-1
metrics:
- aws_dimensions:
  - TopicName
  - Platform
  aws_metric_name: NumberOfMessagesPublished
  aws_namespace: AWS/SNS
  aws_statistics:
  - Sum
- aws_dimensions:
  - TopicName
  - Platform
  aws_metric_name: NumberOfNotificationsDelivered
  aws_namespace: AWS/SNS
  aws_statistics:
  - Sum
- aws_dimensions:
  - TopicName
  - Platform
  aws_metric_name: NumberOfNotificationsFailed
  aws_namespace: AWS/SNS
  aws_statistics:
  - Sum
- aws_dimensions:
  - TopicName
  - Platform
  aws_metric_name: PublishSize
  aws_namespace: AWS/SNS
  aws_statistics:
  - Average
  - Sum
  - Maximum
  - Minimum
  - Count
- aws_dimensions:
  - TopicName
  - Platform
  aws_metric_name: NumberOfNotificationsFilteredOut
  aws_namespace: AWS/SNS
  aws_statistics:
  - Sum
sqs.yml
region: us-east-1
metrics:
- aws_dimensions:
  - QueueName
  aws_metric_name: NumberOfMessagesSent
  aws_namespace: AWS/SQS
  aws_statistics:
  - Average
  - Minimum
  - Maximum
  - SampleCount
  - Sum
- aws_dimensions:
  - QueueName
  aws_metric_name: NumberOfMessagesReceived
  aws_namespace: AWS/SQS
  aws_statistics:
  - Average
  - Minimum
  - Maximum
  - SampleCount
  - Sum
- aws_dimensions:
  - QueueName
  aws_metric_name: NumberOfEmptyReceives
  aws_namespace: AWS/SQS
  aws_statistics:
  - Average
  - Minimum
  - Maximum
  - SampleCount
  - Sum
- aws_dimensions:
  - QueueName
  aws_metric_name: NumberOfMessagesDeleted
  aws_namespace: AWS/SQS
  aws_statistics:
  - Average
- aws_dimensions:
  - QueueName
  aws_metric_name: ApproximateNumberOfMessagesDelayed
  aws_namespace: AWS/SQS
  aws_statistics:
  - Average
  - Minimum
  - Maximum
  - SampleCount
  - Sum
- aws_dimensions:
  - QueueName
  aws_metric_name: ApproximateAgeOfOldestMessage
  aws_namespace: AWS/SQS
  aws_statistics:
  - Average
  - Minimum
  - Maximum
  - SampleCount
  - Sum
- aws_dimensions:
  - QueueName
  aws_metric_name: ApproximateNumberOfMessagesNotVisible
  aws_namespace: AWS/SQS
  aws_statistics:
  - Average
  - Minimum
  - Maximum
  - SampleCount
  - Sum
- aws_dimensions:
  - QueueName
  aws_metric_name: ApproximateNumberOfMessagesVisible
  aws_namespace: AWS/SQS
  aws_statistics:
  - Average
  - Minimum
  - Maximum
  - SampleCount
  - Sum
- aws_dimensions:
  - QueueName
  aws_metric_name: SentMessageSize
  aws_namespace: AWS/SQS
  aws_statistics:
  - Average
  - Minimum
  - Maximum
  - SampleCount
  - Sum