This document describes how to create alerting policies and charts to monitor quota allocated to you by Google Cloud, and it includes several examples. Google Cloud establishes various quotas that you can use to track and limit the resources consumed by a project or organization. For general information about quotas, including information on allocation quotas and rate quotas, see Working with quotas.
Before you begin
This document assumes familiarity with time-series data and its manipulation. The following resources provide additional information:
- For information on working with time-series data, see Filtering and aggregation.
- For definitions of the terms gauge, delta, and cumulative, see Kinds of metrics.
- For details about the functions used for combining time series, see
AlignerandReducer.
Quota management
Cloud Monitoring manages quota in two ways:
Consumer quota: For this type of quota, the monitored resource is
consumer_quota. The metrics for this resource are a subset of theserviceruntimemetrics.Most of the examples on this page are consumer-quota examples.
Resource-specific quotas: Some services provide monitored resources that have resource-specific metrics for quotas. These metric types appear in groups of three and follow a naming format:
service/quota/quota-type/exceededservice/quota/quota-type/limitservice/quota/quota-type/usage
For example, Compute Engine has the
compute.googleapis.com/VpcNetworkresource. The quota-related metrics associated with this resource are thecompute.googleapis.com/quotasubset of thecomputemetrics. There are three metric types related to the "instances per VPC network" quota:quota/instances_per_vpc_network/exceededquota/instances_per_vpc_network/limitquota/instances_per_vpc_network/usage
Identify quota metrics and limit names
Raw data about quota consumption, particularly for consumer quota, can include information about many different quotas. To extract information about a specific quota for a chart or alerting policy, you need to identify that subset of quota data.
Depending on the source, quota data might include labels that you can use to isolate the information you want. These labels include the following:
- Quota metric: The quota metric is an identifier for a type of quota;
it is not one of the metric types described in Metrics
list. For example, all consumer-quota data is written as
serviceruntime.googleapis.commetric type likequota/allocation/usage. This metric type has aquota_metriclabel that can be used to filter for a specific quota, for example, allocation-usage data. - Limit name: The limit name identifies a limit on a specific type of quota.
A quota can have more than one limit associated with it. For example,
a quota for read calls might have a per-minute limit of 100 and a per-day
limit of 1000, with two limit names,
readsPerMinuteandreadsPerDay. Quota-related metric types might have alimit_namefield for this value.
All serviceruntime.googleapis.com/quota metric types
provide the quota_metric label, but only some include the limit_name label.
Resource-specific metric types for quota include the limit_name label.
Not all Google Cloud services support quota metrics. To determine if a service supports quota metrics and to identify the values of the quota-specific labels, you can use the following procedure:
-
In the Google Cloud console, go to the Quotas & System Limits page:
If you use the search bar to find this page, then select the result whose subheading is IAM & Admin.
Click view_column View column and add the following columns to the quota display:
- Metric: This column displays the value of the
quota_metriclabel. - Limit name: This column displays the value of the
limit_namelabel. - Monitored resource: When populated, the quota uses the listed
monitored resource. When empty, the monitored resource for the quota is
consumer_quota.
- Metric: This column displays the value of the
Locate the quota of interest.
For example, the Compute Engine API subnetworks quota lists the Metric as
compute.googleapis.com/subnetworks, the Limit name asSUBNETWORKS-per-project, and it doesn't list a Monitored resource. Therefore, the monitored resource for this quota isconsumer_quota.
Example: View usage for a specific consumer quota metric
The goal is to create a chart that displays, by region, Compute Engine's
total disk-storage quota. This consumer-quota example retrieves
quota/allocation/usage data, and then filters
the data so that allocation usage for a specific quota metric is displayed:
In the Google Cloud console, select Cloud Monitoring, and then select Metrics Explorer.
In the toolbar, expand the time period menu and select Last 14 days.
Expand the Widget type menu and select Stacked bar chart.
Configure Metrics Explorer to display the allocation quota usage:
- Click Select a metric and enter
allocationin the filter_list Filter bar. - Select Consumer Quota for the resource.
- Select Quota for the metric category.
- Select Allocation quota usage for the metric and the click Apply.
- Expand the Aggregation menu and select Unaggregated.
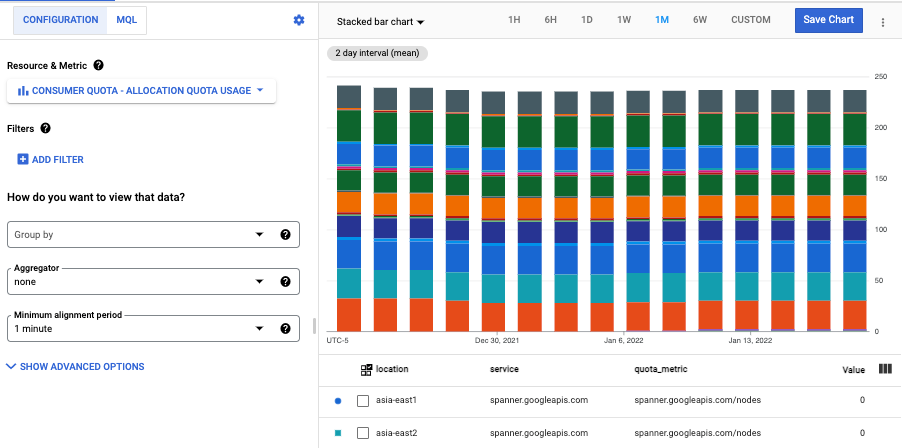
The chart displays the allocation-quota usage as a bar chart for the period of six weeks. By viewing the legend, you see that the chart displays the quota usage for multiple services.
If you use the Cloud Monitoring API, then the equivalent filter value is:
metric.type="serviceruntime.googleapis.com/quota/allocation/usage" resource.type="consumer_quota"You can view this filter value by expanding the Resource type menu and then selecting Direct filter mode.
- Click Select a metric and enter
To limit the chart to the Compute Engine service, add the filter
service = compute.googleapis.com: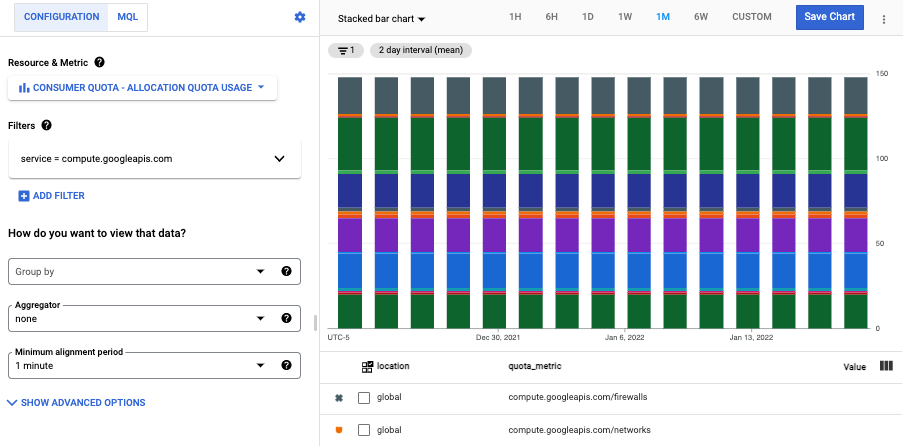
If you use the Cloud Monitoring API, then the equivalent filter value is:
metric.type="serviceruntime.googleapis.com/quota/allocation/usage" resource.type="consumer_quota" resource.label.service="compute.googleapis.com"The chart now displays the time series for the allocated quota usage for Compute Engine quotas. The legend displays the value of the
quota_metriclabel for each displayed time series. This value identifies the specific quota. For example,compute.googleapis.com/disks_total_storageidentifies the time series for Compute Engine's total disk-storage quota.The chart displays quota usage only for those quotas that have recorded usage. For example, if the project doesn't have any Compute Engine resources, then filtering for the
compute.googleapis.comservice results in a chart with no data.To create a chart that displays Compute Engine's total disk storage quota usage, use the filter
quota_metric = compute.googleapis.com/disks_total_storage: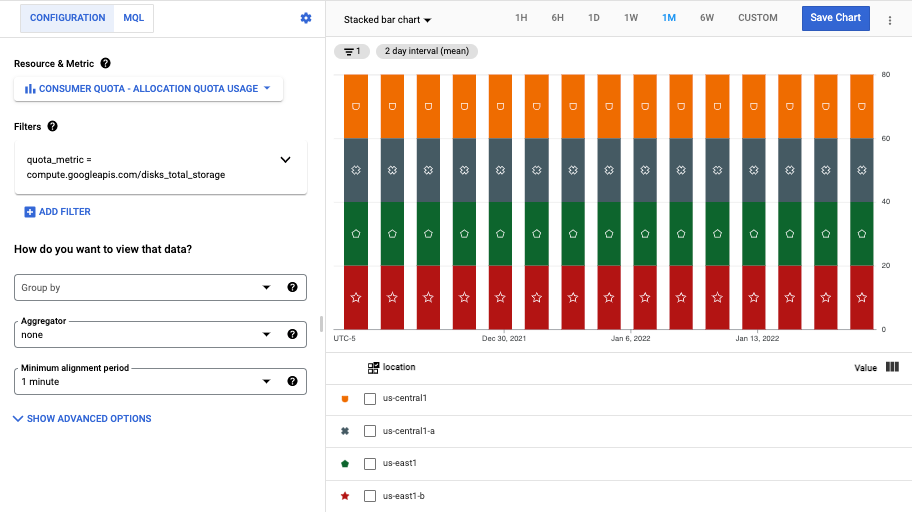
If you use the Cloud Monitoring API, then the equivalent filter value is:
metric.type="serviceruntime.googleapis.com/quota/allocation/usage" resource.type="consumer_quota" metric.label.quota_metric="compute.googleapis.com/disks_total_storage"The previous chart displays time series for the regions
us-central1andus-east1, and for multiple zones including the zoneus-central1-a.To refine the chart so that it displays data only for the regions, without the zones, add a filter based on the
locationlabel. For this example, where both regions are prefixed byus-and end with1, a filter that uses the regular expressionlocation =~ ^us.*1$works well: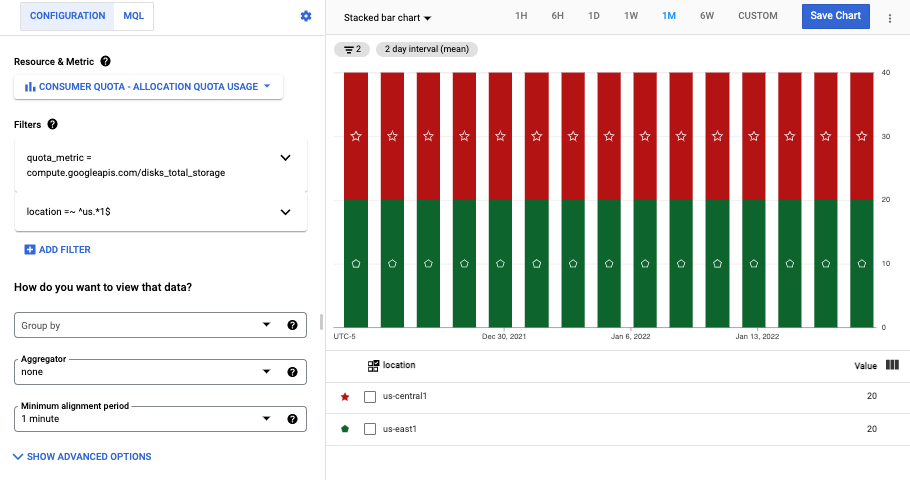
For consumer quota, the value of the quota_metric label identifies
both the service and the specific quota usage being monitored. When you create
charts or alerting policies that monitor a specific quota metric, you use
that information.
Alerting policies in Cloud Monitoring
Alerting policies are a way to configure Monitoring to notify you when something, like reaching 85% of your limit on a quota, happens.
An alerting policy is a collection of conditions and notification information:
- A condition describes what is being monitored, how the time-series data for that resource is to be combined, and when an incident is generated. An alerting policy must specify at least one condition.
- The notification channel specifies who is to be notified, and how they are to be notified, when an incident occurs. For example, you can configure the alerting policy to send email to a specific person or to a group of people.
There are two techniques you can use to create alerting-policy conditions:
Using Monitoring filters to select and manipulate data. For example, when you use the graphical interface to create alerting-policy conditions, you are creating filters. The example shown in Working with quota metrics uses filters to select data for a chart. You can also use filters in requests to the Monitoring API.
Using PromQL to select and manipulate data. PromQL is a text-based query language. With the PromQL code editor, you can create queries that you can't create with the filter-based technique. We recommend that you use PromQL for creating ratio-based alerting policies. For more information, see PromQL alerting-policy examples.
This page discusses both techniques. You can also create charts by using either technique.
Filter alerting-policy examples
In this section, each subsection includes a JSON representation of an alerting policy, along with a pair of tables that describe how to configure the policy in the Google Cloud console:
- The first table describes what is being monitored and how the data is to be combined.
- The second table describes when an incident is to be generated.
These examples are for the filter-based approach.
None of these policies compute ratios. For ratio-based examples, see PromQL alerting-policy examples.
Alerting on quota/exceeded errors
You can create an alerting policy to notify you if any service in your Google Cloud project is reporting a quota exceeded error. You can create this type of policy by using Google Cloud console or by using the Cloud Monitoring API.
Using the Google Cloud console
The remainder of the content in this subsection is for the conditions dialog of an alerting policy.
Complete the New condition dialog by using the settings in the
following table.
These setting specify that you want to monitor the time series data for the
serviceruntime metric /quota/exceeded for all services
in your Google Cloud project, and that you want to group the data by
the quota limit.
| New condition dialog Field |
Value |
|---|---|
| Resource and Metric | In the Resources menu, select Consumer Quota. In the Metric categories menu, select Quota. In the Metrics menu, select Quota exceeded error. (The metric.type is serviceruntime.googleapis.com/quota/exceeded,and the resource.type is consumer_quota).
|
| Filter |
Add a filter so the chart only displays data for the service that you want to monitor. For example, to monitor the Identity and Access Management service, add the folliowing filter: service = iam.googleapis.com. When the filter field is empty, all available metric data is included in the chart. |
| Rolling window | Select 1 m |
| Rolling window function | Select count true
This metric is of type For this metric, the rolling window functions of |
| Across time series Time series aggregation |
Select The aggregation field is automatically set to |
| Across time series Time series group by |
Select This option groups the data by the type of name of the |
Complete the Configure trigger dialog by using the following settings. These settings cause the alerting policy to create an alert if the number of quota-exceeded errors exceeds the value of 0 for 1 m. A value of 0 is selected here because quota exceeded errors are unexpected and an indication that a quota needs to be increased or that a service needs to be modified to reduce the API requests. You might want to use a higher threshold.
| Configure trigger dialog Field |
Value |
|---|---|
| Condition type | Threshold |
| Alert trigger | Any time series violates |
| Threshold position | Above threshold |
| Threshold value | 0 |
| Retest window | 1 m |
Using the Cloud Monitoring API
You can create this alerting policy using the API method
alertPolicies.create. You can invoke the
Cloud Monitoring API directly, by using the Google Cloud CLI, or by using
client libraries. For more information, see
Creating policies.
For information on representing alerting policies in JSON or YAML, see Sample policies.
A representation of this alerting policy in JSON format follows.
{
    "combiner": "OR",
    "conditions": [
      {
        "conditionThreshold": {
          "aggregations": [
            {
              "alignmentPeriod": "60s",
              "crossSeriesReducer": "REDUCE_SUM",
              "groupByFields": [
                "metric.label.quota_metric"
              ],
              "perSeriesAligner": "ALIGN_COUNT_TRUE"
            }
          ],
          "comparison": "COMPARISON_GT",
          "duration": "60s",
          "filter": "metric.type=\"serviceruntime.googleapis.com/quota/exceeded\" resource.type=\"consumer_quota\"",
          "trigger": {
            "count": 1
          }
        },
        "displayName": "Quota exceeded error by label.quota_metric SUM",
      }
    ],
    "displayName": "Quota exceeded policy",
  }
Alerting on the absolute quota/allocation/usage
You can create an alerting policy to notify you if the allocation quota usage for a specific service in your Google Cloud project is exceeding a user-specified threshold. You can create this type of policy by using Google Cloud console or by using the Cloud Monitoring API.
Using the Google Cloud console
The remainder of the content in this subsection is for the conditions dialog of an alerting policy.
Complete the New condition dialog by using the settings in the
following table.
These setting specify that you want to monitor the time series data for the
serviceruntime metric /quota/allocation/usage for one service
in your Google Cloud project, and that you want to group the data by
the quota limit.
| New condition dialog Field |
Value |
|---|---|
| Resource and Metric | In the Resources menu, select Consumer Quota. In the Metric categories menu, select Quota. In the Metrics menu, select Allocation quota usage. (The metric.type is serviceruntime.googleapis.com/quota/allocation/usage,and the resource.type is consumer_quota).
|
| Filter |
Add a filter so the chart only displays data for the service that you want to monitor. For example, to monitor the Identity and Access Management service, add the folliowing filter: service = iam.googleapis.com. When the filter field is empty, all available metric data is included in the chart. |
| Rolling window | Select 1440 mThe period matches is the sampling interval for this metric. |
| Rolling window function | Select next olderThe rolling window function is set to |
| Across time series Time series aggregation |
Select The aggregation field is automatically set to |
| Across time series Time series group by |
Select This option groups the data by the type of name of the |
Complete the Configure trigger dialog by using the following settings. These settings cause the alerting policy to create an alert if the value of the time series exceeds 2.5 for 1440 m. The value of 1440 m matches the rolling window. The value of 2.5 was selected for this example, because it is slightly higher than the normal value for the test system. You should select the threshold based on the service you are monitoring in combination with an understanding of the expected range of values for the metric.
| Configure trigger dialog Field |
Value |
|---|---|
| Condition type | Threshold |
| Alert trigger | Any time series violates |
| Threshold position | Above threshold |
| Threshold value | 2.5 |
| Retest window | 1440 m |
Using the Cloud Monitoring API
You can create this alerting policy using the API method
alertPolicies.create. You can invoke the
Cloud Monitoring API directly, by using the Google Cloud CLI, or by using
client libraries. For more information, see
Creating policies.
For information on representing alerting policies in JSON or YAML, see Sample policies.
A representation of this alerting policy in JSON format follows.
{
    "combiner": "OR",
    "conditions": [
      {
        "conditionThreshold": {
          "aggregations": [
            {
              "alignmentPeriod": "86400s",
              "crossSeriesReducer": "REDUCE_SUM",
              "groupByFields": [
                "metric.label.quota_metric"
              ],
              "perSeriesAligner": "ALIGN_NEXT_OLDER"
            }
          ],
          "comparison": "COMPARISON_GT",
          "duration": "86400s",
          "filter": "metric.type=\"serviceruntime.googleapis.com/quota/allocation/usage\" resource.type=\"consumer_quota\" resource.label.\"service\"=\"iam.googleapis.com\"",
          "thresholdValue": 2.5,
          "trigger": {
            "count": 1
          }
        },
        "displayName": "Allocation quota usage for iam.googleapis.com by label.quota_metric SUM",
      }
    ],
    "displayName": "Absolute quota usage policy",
  }
PromQL alerting-policy examples
PromQL is a text-based query language that lets you build more powerful and flexible queries than you can build with Monitoring filters. We recommend that you use PromQL for setting up ratio-based alerting policies. For example, with PromQL, you can set up a ratio for rate-quota usage, which requires computing the ratio of a gauge metric (the limit) and a delta metric (the rate).
You can create PromQL-based alerting policies by using the Google Cloud console or the Monitoring API:
Google Cloud console: Use the PromQL code editor when you create the alerting condition. To bring up the PromQL code editor, on the toolbar of the Create alerting policy dialog, click PromQL. For more information on using this editor, see Use the code editor for PromQL.
Monitoring API: Use the method
alertPolicies.createand provide a condition of the typePrometheusQueryLanguageCondition. This condition type takes an PromQL query as a field value. For more information on using the Monitoring API with PromQL, see Create PromQL-based alerting policies.
For information specific to PromQL, see PromQL for Cloud Monitoring. For more information on PromQL-based alerting policies, see PromQL-based alerting policies.
Alerting policy that monitors the ratio of rate quota to quota limit
The following PromQL query pattern describes an alerting policy that sends a notification when the per-minute rate usage of a specific resource service exceeds 80% of a specific limit:
(
  sum by (project_id, quota_metric, location) (increase({"serviceruntime.googleapis.com/quota/rate/net_usage", monitored_resource="consumer_quota", service="sample.googleapis.com"}[1m]))
  /
  max by (project_id, quota_metric, location) ({"serviceruntime.googleapis.com/quota/limit", monitored_resource="consumer_quota", service="sample.googleapis.com", limit_name="Limit"})
) > 0.8
To use this query pattern, make the following changes:
- Replace
sample.googleapis.comwith the service you want to monitor. - Replace
Limitforlimit_namewith the limit you want to track. For information on finding limit names, see Identifying quota metrics and limit names - Replace
1mwith an appropriate window for your query.
You can't create this query with filters.
Alerting policy that monitors the ratio of rate quota with wildcards
PromQL supports filtering with wildcards, regular expressions, and boolean logic. For example, you can use PromQL to create an alerting policy that tracks multiple limits and warns you if any exceeds a threshold.
The following PromQL query pattern describes an alerting policy that sends notifications when the per-minute or per-day rate usage of any resource services exceeds 80%:
(
  sum by (project_id, quota_metric, location) (increase({"serviceruntime.googleapis.com/quota/rate/net_usage", monitored_resource="consumer_quota", service=~".*"}[1m]))
  /
  max by (project_id, quota_metric, location) ({"serviceruntime.googleapis.com/quota/limit", monitored_resource="consumer_quota", service=~".*", limit_name=~".*PerMinute.*"})
)
or
(
  sum by (project_id, quota_metric, location) (increase({"serviceruntime.googleapis.com/quota/rate/net_usage", monitored_resource="consumer_quota", service=~".*"}[23h]))
  /
  max by (project_id, quota_metric, location) ({"serviceruntime.googleapis.com/quota/limit", monitored_resource="consumer_quota", service=~".*", limit_name=~".*PerDay.*"})
) > 0.8
In the previous query, the argument for the per-day aligner is set to
23 hours instead of 1 day. PromQL can only require
23 hours 30 minutes of data, and for computation purposes,
the aligner adds one hour to the alignment period. If you
use [1d], then the condition can't be saved because the condition
requires 25 hours of data.
To use this query pattern, make the following changes:
- Replace the regular expression for
service=~with a regular expression for the services you want to track. - In the first ratio:
- Replace
.*PerMinute.*forlimit_name=~with a regular expression for the first group of limits you want to track. For information on finding limit names, see Identifying quota metrics and limit names - Replace
1mwith a window appropriate to your limits.
- Replace
- In the second ratio:
- Replace
.*PerDay.*forlimit_name=~with a regular expression for the second group of limits you want to track. - Replace
23hwith a window appropriate to your limits.
- Replace
You can't create this query with filters.
Ratio alert on usage of allocation quota for one limit
The following PromQL query pattern describes an alert that monitors when the per-day allocation usage of a specific resource service exceeds 80% of a specific limit:
(
 max by (project_id, quota_metric, location) ({"serviceruntime.googleapis.com/quota/allocation/usage", monitored_resource="consumer_quota", service="sample.googleapis.com"})
 /
 min by (project_id, quota_metric, location) ({"serviceruntime.googleapis.com/quota/limit", monitored_resource="consumer_quota", service="sample.googleapis.com", limit_name="Limit"})
) > 0.8
To use this query pattern, make the following changes:
- Replace
sample.googleapis.comwith the service you want to monitor. - Replace
Limitforlimit_namewith the limit you want to track. For information on finding limit names, see Identifying quota metrics and limit names
Example: CPU usage of 75% in any region
The following query creates an alerting policy that triggers when the CPU usage of Compute Engine VM instance goes higher than 75% of the limit in any region:
(
 max by (project_id, quota_metric, location) ({"serviceruntime.googleapis.com/quota/allocation/usage", monitored_resource="consumer_quota", service="compute.googleapis.com"})
 /
 min by (project_id, quota_metric, location) ({"serviceruntime.googleapis.com/quota/limit", monitored_resource="consumer_quota", service="compute.googleapis.com", limit_name="CPUS-per-project-region"})
) > 0.75
This consumer-quota policy uses the CPUS-per-project-region limit name
in the Compute Engine API "CPUs" quota. For information on finding limit names,
see Identifying quota metrics and limit names.
Alerting policy that monitors the ratio of allocation quota for any service
PromQL supports filtering with wildcards, regular expressions, and boolean logic. For example, you can use PromQL to create an alert that tracks multiple limits or services and warns you if any exceeds a threshold.
The following PromQL query describes an alert that monitors when the per-day allocation usage of any resource service exceeds 80% for any of quota limits:
(
 max by (project_id, quota_metric, location) ({"serviceruntime.googleapis.com/quota/allocation/usage", monitored_resource="consumer_quota"})
 /
 min by (project_id, quota_metric, location) ({"serviceruntime.googleapis.com/quota/limit", monitored_resource="consumer_quota"})
) > 0.8
You can use this query as presented, or you can filter services by a regular expression for the services you want to track. You can also filter on a specific service and use wildcards in a limit filter.
Example: CPU usage higher than 50% in specific zones
The following query creates an alerting policy that triggers when the CPU usage
of Compute Engine VM instances goes higher than 50% of the limit in any of
the us-central1 zones. This query filters the limit
data by a limit name and the resource location:
(
max by (project_id, quota_metric, location) ({"serviceruntime.googleapis.com/quota/allocation/usage", monitored_resource="consumer_quota", service="compute.googleapis.com"})
/
min by (project_id, quota_metric, location) ({"serviceruntime.googleapis.com/quota/limit", monitored_resource="consumer_quota", service="compute.googleapis.com", limit_name="CPUS-per-project-zone", location=~"us-central1-.*"})
)
> 0.5
This consumer-quota policy uses the CPUS-per-project-zone limit name
in the Compute Engine API "CPUs" quota. For information on finding limit names,
see Identifying quota metrics and limit names.
Ratio alert using resource-specific quota
You can use PromQL to set up ratios for resource-specific quota-related metrics. In this case, you specify a service-specific monitored resource and compute a ratio over a pair of resource-specific quota-related metrics.
The following query pattern describes an alert that monitors when the usage of a quota exceeds 80% of the limit:
(
 max by (resource_label_1, ..., resource_label_n, metric_label_1, ..., metric_label_n) ({"sample.googleapis.com/quota/samplemetric/usage", monitored_resource="sample.googleapis.com/SampleResource"})
 /
 min by (resource_label_1, ..., resource_label_n, metric_label_1, ..., metric_label_n) ({"sample.googleapis.com/quota/samplemetric/limit", monitored_resource="sample.googleapis.com/SampleResource"})
) > 0.8
To use this query pattern, make the following changes:
- Replace
sample.googleapis.comwith the service you want to monitor. - Replace
SampleResourcewith the associated monitored resource. - Replace
samplemetricwith the string for a group of metric types. - In the
by (...)operations, list each of the resource and metric labels.
Example: CPU usage of 75% in any region
For example, the following PromQL query sets up an alert that monitors
when the usage of the Compute Engine instances_per_vpc_network quota
exceeds 80% for any network ID:
(
 max by (resource_container, limit_name, location, network_id) ({"compute.googleapis.com/quota/instances_per_vpc_network/usage", monitored_resource="compute.googleapis.com/VpcNetwork"})
 /
 min by (resource_container, limit_name, location, network_id) ({"compute.googleapis.com/quota/instances_per_vpc_network/limit", monitored_resource="compute.googleapis.com/VpcNetwork"})
) > 0.8
Note that this query uses the resource type
compute.googleapis.com/VpcNetwork, not consumer_quota, and it takes the
ratio of two compute.googleapis.com/quota/instances_per_vpc_network metrics,
usage and limit.
Chart examples
Charts display time-series data. You can use Metrics Explorer to create a chart. With Metrics Explorer you can either discard the chart when you no longer need it, or you can save it to a dashboard. In the dashboard view, you can add a chart to the dashboard.
When you only want to configure a chart that displays quota data, you can use the settings in the New condition table. Alerting conditions use different notation than charting tools. Charting tools include Metrics Explorer and configuring charts on custom dashboards:| New condition dialog field name |
Charts |
|---|---|
| Rolling window function | Optimally configured based on selected metric and aggregation settings. To specify the alignment function, do the following:
|
| Rolling window | Min Interval (to access, click add Add query element) |
| Time series group by (in the Across time series section) |
Aggregation element's second menu |
| Time series aggregation (in the Across time series section) |
Aggregation element's first menu |
Time series for quota/rate/net_usage
To view the time series data for the serviceruntime metric
quota/rate/net_usage, for all services in your Google Cloud project,
where the data is grouped by the name of the quota metric and the rate of usage is displayed,
use the following settings:
| New condition dialog Field |
Value |
|---|---|
| Resource and Metric | In the Resources menu, select Consumer Quota. In the Metric categories menu, select Quota. In the Metrics menu, select Rate quota usage. (The metric.type is serviceruntime.googleapis.com/quota/rate/net_usage,and the resource.type is consumer_quota).
|
| Filter |
Add a filter so the chart only displays data for the service that you want to monitor. For example, to monitor the Identity and Access Management service, add the folliowing filter: service = iam.googleapis.com. When the filter field is empty, all available metric data is included in the chart. |
| Rolling window | Select 1 mThe period of 1 minute matches the sampling interval for this metric. |
| Rolling window function | Select rate
By setting the aligner to the value of |
| Across time series Time series aggregation |
Select The aggregation field is automatically set to |
| Across time series Time series group by |
Select This option groups the data by the type of name of the |
Time series for quota/instances_per_vpc_network/limit
To view the time series data for the compute.googleapis.com
metric quota/instances_per_vpc_network/limit, for all the
networks in your Google Cloud project, use the following settings:
| New condition dialog Field |
Value |
|---|---|
| Resource and Metric | In the Resource type menu, select VPC Network. In the Metric category menu, select quota. In the Metric menu, select Instances per VPC Network quota limit. (The metric.type is compute.googleapis.com/quota/instances_per_vpc_network/limit,and the resource.type is compute.googleapis.com/VpcNetwork).
|
| Filter | Leave empty |
| Rolling window | Select 1 mThe period matches is the sampling interval for this metric. |
| Rolling window function | Select mean |
| Across time series Time series aggregation |
Leave as none
|
| Across time series Time series group by |
Leave empty |
Time series for quota/instances_per_vpc_network/usage
To view the time series data for the compute.googleapis.com
metric quota/instances_per_vpc_network/usage, for one of the
networks in your Google Cloud project, use the following settings:
| New condition dialog Field |
Value |
|---|---|
| Resource and Metric | In the Resource type menu, select VPC Network. In the Metric category menu, select quota. In the Metric menu, select Instances per VPC Network quota usage. (The metric.type is compute.googleapis.com/quota/instances_per_vpc_network/usage,and the resource.type is compute.googleapis.com/VpcNetwork).
|
| Metric | In the Metric menu, select compute.googleapis.com/quota/instances_per_vpc_network/usage. |
| Filter |
Add a filter so the chart only displays a subset of all the data. For example, to see the usage for a specific network, add the following filter: network_id = identifier. When the filter field is empty, all available metric data is included in the chart. |
| Rolling window | Select 1 mThe period matches is the sampling interval for this metric. |
| Rolling window function | Select mean |
| Across time series Time series aggregation |
Leave as none
|
| Across time series Time series group by |
Leave empty |
PromQL charts
You can use PromQL queries to create charts by using the
PromQL code editor. For example, any of the queries shown in
PromQL alerting policy examples can be entered
into the code editor. You can omit the comparison operator at the end, such
as > 0.8, in each query; it applies only when creating a condition for an
alerting policy. In a chart, setting a condition with a comparison operator does
nothing.
For more information, see Use the code editor for PromQL.