This page describes how you can configure your alerting policy documentation so that notifications provide incident responders with resources and additional information for incident resolution.
Documentation structure
The documentation of an alerting policy consists of a subject, content, and links. You can configure documentation in the Google Cloud console, the Cloud Monitoring API, and the Google Cloud CLI.
Subjects
The subject of your documentation appears in the subject of notifications for incidents related to your alerting policy. Notification recipients can manage and sort their notifications by subject.
Subject lines are limited to 255 characters. If you don't define a subject in your documentation, then Cloud Monitoring determines the subject line. Subject lines support plain text and variables.
Cloud Monitoring API
Configure the notification subject line by using the subject field
of the alerting policy documentation.
Google Cloud console
Configure the notification subject line by using the Notification subject line field in the Notifications and name section of the Create alerting policy page.
Content
The content of your documentation appears in the following notification types:
- Email, in the Policy Documentation section
- PagerDuty
- Pub/Sub
- Slack
- Webhooks
We recommend configuring your content so that incident responders can view remediation steps and incident information in notifications related to your alerting policy. For example, you might configure the documentation to include a summary of the incident and information about relevant resources.
Documentation content supports the following:
- Plain text
- Variables
- Channel-specific controls
Cloud Monitoring API
Configure documentation content by using the content field
of the alerting policy documentation.
Google Cloud console
Configure documentation content by using the Documentation field in the Notifications and name section of the Create alerting policy page.
Links
You can add links to your documentation so that incident responders can access resources such as playbooks, repositories, and Google Cloud dashboards from a notification.
The Cloud Monitoring API lets you define an object that contains the most relevant links for responders. While the Google Cloud console doesn't have a field specifically for links, you can add a section for links in your documentation body.
Cloud Monitoring API
You can add links to your documentation by defining one or more
Link objects in the links field of the alerting policy
documentation. Each Link object consists of a
display_name and a url. You can have up to three links in
your documentation.
The following configuration shows the links field with one Link object
representing a URL to an incident playbook. The URL includes a variable
so that notification recipients can access the correct playbook based on the
monitored resource where the incident occurred:
"links" [
  {
    "displayName": "Playbook",
    "url": "https://myownpersonaldomain.com/playbook?name=${resource.type}"
  }
]
Documentation links added using the Link field appear in the following
notification types:
- Email, in the Quick Links section
- PagerDuty
- Pub/Sub
- Webhooks
Google Cloud console
You can add links to your documentation content by including them in the Documentation field of your alerting policy. For example, the following documentation lists a URL for a customer playbook:
### Troubleshooting and Debug References

Playbook: https://myownpersonaldomain.com/playbook?name=${resource.type}
Documentation links added using the Google Cloud console appear with the rest of your documentation content in the following notification types:
- Email, in the Policy Documentation section
- PagerDuty
- Pub/Sub
- Slack
- Webhooks
Markdown in documentation content
You can use Markdown to format your documentation content. Documentation content supports the following subset of Markdown tagging:
- Headers, indicated by initial hash characters.
- Unordered lists, indicated by initial plus, minus, or asterisk characters.
- Ordered lists, indicated by an initial number followed by a period.
- Italic text, indicated by single underscores or asterisks around a phrase.
- Bold text, indicated by double underscores or asterisks around a phrase.
- Links, indicated by
[link text](url)syntax. To add links to your notification, we recommend that you use the Cloud Monitoring API and configure theLinkobject.
For more information about this tagging, see any Markdown reference, for example, Markdown guide.
Variables in documentation
To customize the text in your documentation, you can use variables
of the form ${varname}. When the documentation is sent with
a notification, the string ${varname} is replaced with a value drawn from the
corresponding Google Cloud resource, as described in the following table.
| Variable | Value |
|---|---|
condition.name |
The REST resource name of the condition, such asprojects/foo/alertPolicies/1234/conditions/5678. |
condition.display_name |
The display name of a condition, such as
CPU usage increasing rapidly. |
log.extracted_label.KEY |
The value of the label KEY, extracted
from a log entry. For log-based alerting policies only; for more
information,
see
Create a log-based alerting policy by using the Monitoring API. |
metadata.system_label.KEY |
The value of the system-supplied resource metadata label KEY.1 |
metadata.user_label.KEY |
The value of the user-defined resource metadata label KEY.1,3 |
metric.type |
The metric type, such ascompute.googleapis.com/instance/cpu/utilization. |
metric.display_name |
The display name for the metric type, such as
CPU utilization. |
metric.label.KEY |
The value of the metric label When the value of the variable When you migrate a Prometheus alerting rule, the Prometheus alert field templates You can also use |
metric.label.metadata_system_VALUE |
References a PromQL metadata system label,
where VALUE is the specific label name, such as
Example usage:
|
metric.label.metadata_user_VALUE |
References a PromQL metadata user label,
where VALUE is the specific label name, such as
Example usage: |
metric_or_resource.labels |
This variable renders all metric and resource label values as a sorted list of When you migrate a Prometheus alerting rule, the Prometheus alert field templates |
metric_or_resource.label.KEY |
When you migrate a Prometheus alerting rule, the Prometheus alert field templates |
policy.name |
The REST resource name of the policy, such as
projects/foo/alertPolicies/1234. |
policy.display_name |
The display name of a policy, such as
High CPU rate of change. |
policy.user_label.KEY |
The value of the user label KEY.1
Keys must start with a lowercase letter. Keys and values can contain only lowercase letters, digits, underscores, and dashes. |
project |
The ID of the scoping project of a metrics scope, such as
a-gcp-project. |
resource.type |
The monitored-resource type, such as gce_instance. |
resource.project |
The project ID of the monitored resource of the alerting policy. |
resource.label.KEY |
The value of the resource label
KEY.1,2,3To find the labels associated with the monitored-resource type, see Resource list. |
1 For example, ${resource.label.zone} is replaced with
the value of the zone label. The values of these variables are subject to
grouping; see null values for more information.
2 To retrieve the value of the project_id label on a
monitored resource in the alerting policy, use ${resource.project}.
3 You can't access user-defined resource metadata labels by
using resource.label.KEY. Use metadata.user_label.KEY
instead.
Usage notes
- Only the variables in the table are supported. You can't combine them into
more complex expressions, like
${varname1 + varname2}. - To include the literal string
${in your documentation, escape the$symbol with a second$symbol, and$${renders as${in your documentation. - These variables are replaced by their values only in notifications sent through notification channels. In the Google Cloud console, when the documentation is shown, you see the variables, not the values. Examples in the console include the descriptions of incidents and the preview of the documentation when creating an alerting policy.
- Verify that the aggregation settings of the condition don't eliminate the
label. If the label is eliminated, then the value of the label in the
notification is
null. For more information, see Variable for a metric label is null.
null values
Values for the metric.*, resource.* and metadata.* variables
are derived from time series. Their values can be null if no values are
returned from the time series query.
The
resource.label.KEYandmetric.label.KEYvariables can havenullvalues if your alerting policy uses cross-series aggregation (reduction), for example, calculating the SUM across each of the time-series that match a filter. When using cross-series aggregation, any labels not used in grouping are dropped and as a result they render asnullwhen the variable is replaced with its value. All labels are retained when there is no cross-series aggregation. For more information, see Variable for a metric label is null.Values for
metadata.*variables are available only if the labels are explicitly included in a condition's filter or grouping for cross-series aggregation. That is, you must refer to the metadata label in either filter or grouping for it to have a value for the template.
Variable resolution
Variables in documentation templates are resolved only in the notifications sent by using the following notification channels:
- Google Chat
- Slack
- Pub/Sub, JSON schema version 1.2
- Webhooks, JSON schema version 1.2
- PagerDuty, JSON schema version 1.2
Channel controls
The text in the documentation field can also include special characters used by the notification channel itself to control formatting and notifications.
For example, Slack uses @ for mentions. You can use @ to link the
notification to a specific user ID. Mentions can't include names.
Suppose you include a string like this in the documentation field:
<@backendoncall> Incident created based on policy ${policy.display_name}
When the documentation field is received by the relevant Slack channel as part
of the notification, the previous string causes Slack to send an
additional message to the user ID
backendoncall. The message sent by Slack to the user
could contain relevant information from the notification; for example,
"Incident created based on policy High CPU rate of change".
These additional options are specific to the channels; for more information on what may be available, consult the documentation provided by the channel vendor.
Example
The following example shows Google Cloud console and Cloud Monitoring API versions of template documentation for a CPU utilization alerting policy. These examples use an email for the notification channel type. The documentation templates include several variables to summarize the incident and to reference the alerting policy and condition REST resources.
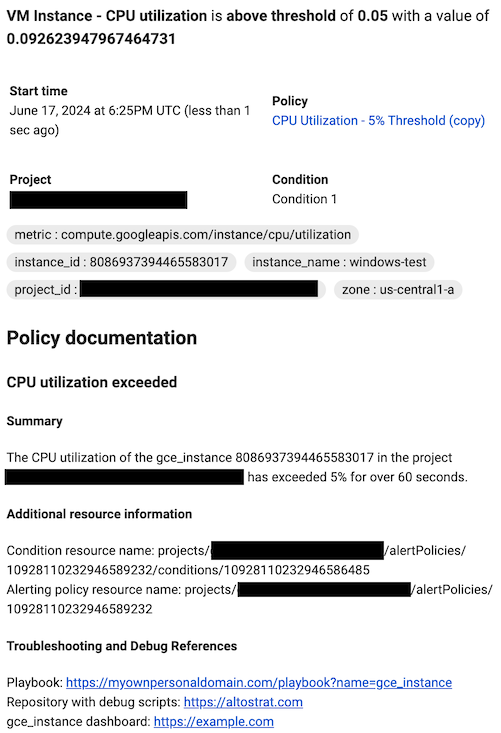
Cloud Monitoring API
  "documentation": {
    "content": "### CPU utilization exceeded\n\n### Summary\n\nThe ${metric.display_name} of the ${resource.type} ${resource.label.instance_id} in the project ${resource.project} has exceeded 5% for over 60 seconds.\n\n#### Additional resource information\n\nCondition resource name: ${condition.name}  \nAlerting policy resource name: ${policy.name}",
    "mimeType": "text/markdown",
    "subject": "Alert: ${metric.display_name} exceeded",
    "links": [
      {
        "displayName": "Playbook",
        "url": "https://myownpersonaldomain.com/playbook?name=${resource.type}"
      },
      {
        "displayName": "Repository with debug scripts",
        "url": "https://altostrat.com"
      },
      {
        "displayName": "Google Cloud dashboard",
        "url": "https://example.com"
      }
    ]
  }
The following image shows how this template appears in an email notification:
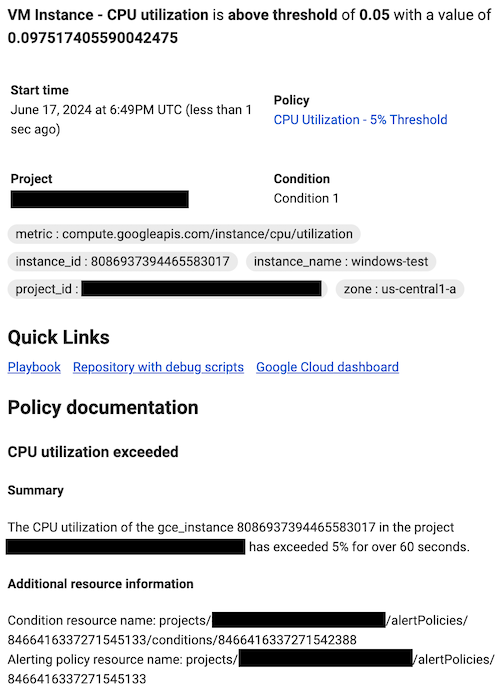
Google Cloud console
### CPU utilization exceeded

#### Summary

The ${metric.display_name} of the ${resource.type}
${resource.label.instance_id} in the project ${resource.project} has
exceeded 5% for over 60 seconds.

#### Additional resource information

Condition resource name: ${condition.name}
Alerting policy resource name: ${policy.name}

#### Troubleshooting and Debug References

Playbook: https://myownpersonaldomain.com/playbook?name=${resource.type}
Repository with debug scripts: https://altostrat.com
${resource.type} dashboard: https://example.com
The following image shows how this template appears in an email notification: