This document describes how you can get notified when your application fails or when the performance of an application doesn't meet defined criteria.
How alerting works
The Cloud Monitoring alerting process contains three parts:
An alerting policy, which describes the circumstances under which you want to be alerted and how you want to be notified about an incident. The alerting policy can monitor time-series data stored by Monitoring or logs stored by Cloud Logging. When that data meets the alerting policy condition, Monitoring creates an incident and sends the notifications.
Each incident is a record of the type of data that was monitored and when the conditions were met. This information can help you troubleshoot the issues that caused the incident.
A notification channel defines how you receive notifications when Monitoring creates an incident. For example, you can configure an alerting policy to email
my-support-team@example.comand to post a Slack message to the channel#my-support-team. An alerting policy can contain one or more notification channels.
Alerting policies can evaluate three types of data:
Time-series data, also called metric data, which is stored by Monitoring. These types of policies are called metric-based alerting policies.
To learn how to set up a metric-based alerting policy, try the Quickstart for Compute Engine.
Log entry data stored by Cloud Logging. Alerting policies that evaluate individual log entries are called log-based alerting policies. Log-based alerting policies notify you when a particular message appears in your logs. For more information, see Monitor your logs.
The results of a SQL query run in Log Analytics against log entry data stored in Logging. Alerting policies that monitor the results of a SQL query are called SQL-based alerting policies. For more information, see Monitor your SQL query results with an alerting policy.
SQL-based alerting policies is in Public Preview.
The alerting process helps you respond to issues when the performance of an application fails to meet acceptable values. For example, you deploy a web application onto a Compute Engine virtual machine (VM) instance. While you expect the HTTP response latency to fluctuate, you want your support team to respond when the application has high latency for a significant time period. You could create a metric-based alerting policy that monitors the application's HTTP response latency metric. If the response latency is higher than two seconds for at least five minutes, then Monitoring creates an incident and sends email notifications to your support team.
How to create an alerting policy
There are multiple ways to create an alerting policy. For example, you can use pre-configured alerting policies by enabling recommended alerts from integrations or certain pages in the Google Cloud console. You can also configure a new alerting policy by using the Google Cloud console, the Cloud Monitoring API, the Google Cloud CLI and Terraform.
Use integrations and recommended alerting policies
Monitoring provides pre-built packages to let you create alerting policies for your Google Cloud services and third-party integrations. The packages include recommended alerting policies, sample dashboards, and key metrics for the service. These packages are available for Google Cloud services such as Google Kubernetes Engine, Compute Engine, and Cloud SQL, and common third-party integrations such as MongoDB, Kafka, and Elasticsearch.
When you install a package, you can enable the package's recommended alerting policies. When you enable a recommended alerting policy, you configure its notification channel and optionally modify other values. After configuration, the alerting policy begins monitoring its target immediately, with no further user input required.
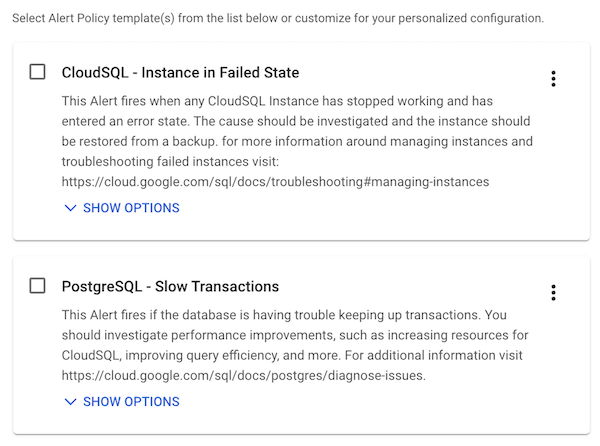
Recommended alerting policies are helpful when you've deployed a new service and want to alert on important metrics. For example, the Cloud SQL integration package comes with recommended alerting policies for failed instances and slow transactions:
For more information on alerting integrations, see Monitoring third-party applications.
Create new alerting policies
You can create alerting policies to monitor different types of data depending on your alerting needs. The following sections list the different types of data that you can monitor with alerting policies.
Monitor time series data
| Condition Type | Description | Example |
|---|---|---|
| Metric-threshold condition | Metric-threshold conditions are met when the values of a metric are more than, or less than, a threshold for a specific retest window. For more information, see Create metric-threshold alerting policies and Create alerting policies by using the API. |
You want an alerting policy that sends a notification when response latency is 500ms or higher for five consecutive uptime checks over 10 minutes. |
| Metric-absence condition | Metric-absence conditions are met when a monitored time series has no data for a specific retest window. The maximum retest window is 23.5 hours. For more information, see Create metric-absence alerting policies and Create alerting policies by using the API. | You want an alerting policy that opens an incident with your support team when a resource doesn't respond to any HTTP requests over the course of five minutes. |
| Forecasted metric-value condition | Forecasted metric-value conditions are met when the alerting policy predicts that the threshold will be violated within the upcoming forecast window. The forecast window can range from 1 hour to 7 days. For more information, see Create forecasted metric-value alerting policies and Create alerting policies by using the API. |
You want an alerting policy that opens an incident with your support team when a resource is likely to reach 80% disk space usage within the next 24 hours. |
Monitor log entry data
To monitor individual log entries, use a log-based alerting policy.
A condition on a log-based alerting policy is met when the alerting
policy detects that a phrase from a log entry
match the alerting policy criteria. For example, you want an alerting policy
that opens an incident with your support
team when a log entry's message
contains product_ids=['tier_1_support', 'tier_2_support'].
For more information, see Configure log-based alerting policies in the Logging documentation.
Monitor SQL query results
To monitor SQL query results, use a SQL-based alerting policy.
The condition of a SQL-based alerting policy periodically analyzes
your log entry data and then create incidents when the table of query
results meets certain criteria. This type of alerting policy is helpful when you
need an alerting policy that monitors aggregations of data or complex patterns
across multiple log entries. For example, you want to get notified when more
than 50 log entries in the last 60 minutes have a severity of WARNING.
For more information, see Monitor your SQL query results with an alerting policy in the Logging documentation.
Alerting policy components
Each alerting policy has the following components:
A condition that describes when a resource, or a group of resources, is in a state that requires you to respond. The condition includes the data source, a static or dynamic threshold, and data aggregation methods such as filters and groupby. Your conditions can monitor a single metric, multiple metrics, or a ratio of metrics. You can also use the Prometheus Query Language (PromQL) to include complex expressions such as dynamic thresholds and conditional logic.
If you use an integration to enable a recommended alerting policy, then the alerting policy condition is pre-populated.
A list of notification channels that describe who to notify when action is required. For more information, see Create and manage notification channels.
Documentation that appears in notifications and incident pages. You can configure the subject line of a notification, and you can add helpful information to the body of the notification. For example, you might configure the notification to display links to internal playbooks or to Google Cloud pages such as custom dashboards. For more information about documentation, including examples, see Annotate incidents with user-defined documentation.
Query languages
Use Prometheus Query Language (PromQL) and filters in your alerting policies to take greater control over your metric evaluation. Monitoring supports the following query types:
PromQL is a functional query language used to evaluate time series data in real time. You can configure alerting policies to include a PromQL query in their condition. Your PromQL queries can use any valid expression, such as metric combinations, ratios, and scaling thresholds. By configuring PromQL-based alerting policies in Google Cloud, you can reduce dependencies on external alerting infrastructure. For more information, see PromQL in Cloud Monitoring and PromQL alerting overview.
Monitoring filters let you configure alerting policies to use filter-based metric ratios. Filter-based alerting policies can't be viewed or modified in the Google Cloud console. For an example of a policy that uses Monitoring filters, see Metric ratio.
Manage alerting policies and incidents
After an alerting policy is enabled, Monitoring continuously monitors the conditions of that policy. You can't configure the alerting policy to monitor conditions only for certain time periods. If you want to disable the alerting policy for a certain time period, then create a snooze.
If an incident is open and Monitoring determines that the conditions of the metric-based policy are no longer met, then Monitoring automatically closes the incident and sends a notification about the closure.
Pricing
In general, Cloud Monitoring system metrics are free, and metrics from external systems, agents, or applications are not. Billable metrics are billed by either the number of bytes or the number of samples ingested.
For more information, see the Cloud Monitoring sections of the Google Cloud Observability pricing page.
For information about how to monitor the number of trace spans or logs that are ingested, or how to be notified when specific content is included in a log entry, see the following documents:
- Alerting on monthly log ingestion
- Alerting on monthly trace span ingestion
- Configure log-based alerts
What's next
For information about notification latency and how the choices for the parameters of an alerting policy affect when notifications are sent, see Behavior of metric-based alerting policies.
For a list of metric-based policy examples, see Summary of example alerting policies.