Use gráficos para visualizar e explorar os seus dados. Nesta aula, vai adicionar um gráfico circular, um gráfico de barras e um gráfico geográfico a este relatório.
Como adicionar um gráfico
Para adicionar um gráfico à página atual:
- Edite o relatório.
- Navegue para a página que vai conter o gráfico.
- Na barra de ferramentas, clique em Adicionar um gráfico.
- Selecione o gráfico que quer adicionar.
- Clique na tela para adicionar o gráfico ao relatório.
- Selecione um ou mais gráficos para os mover ou redimensionar conforme necessário.
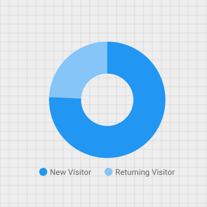
Passo 1: adicione um gráfico circular
 Use um gráfico circular para fazer uma comparação geral de um pequeno número de métricas ou variáveis.
Saiba mais sobre os gráficos circulares.
- Seguindo os passos em [Como adicionar um gráfico](#how-to-add-a-chart), adicione um gráfico circular ao relatório.
- No painel Propriedades, selecione o separador CONFIGURAÇÃO.
- Clique no chip da dimensão Origem para aceder ao Selecionador de dimensões.
- Clique na dimensão Tipo de utilizador.
- Clique no separador ESTILO.
- Use o controlo de deslize em forma de donut para alterar a forma sólida para uma forma de anel.

- Use a propriedade Legenda para posicionar as etiquetas de métricas abaixo do gráfico circular:

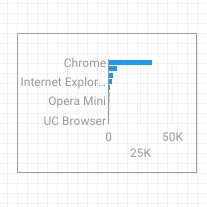
Passo 2: adicione um gráfico de barras
Os gráficos de barras são ideais para mostrar e comparar a magnitude de várias variáveis.
Saiba mais sobre os gráficos de barras.
- Seguindo os passos em Como adicionar um gráfico, adicione um gráfico de barras ao relatório.
- No painel Propriedades, selecione o separador CONFIGURAÇÃO.
- Clique na dimensão Origem e altere-a para Navegador.
- Clique na seta de retorno:

- Clique na métrica Sessões e altere-a para Utilizadores.
- Clique no separador ESTILO.
- Altere a orientação para horizontal :

- Desloque a página até à secção Fundo e limite do separador ESTILO.
- Defina a cor do limite para cinzento:

Passo 3: adicione um mapa do Google
Use um mapa do Google para ver a distribuição de sessões (ou outras métricas) em todo o mundo.
Saiba mais sobre o Google Maps.
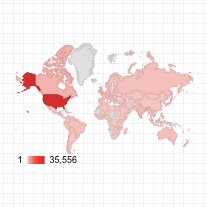
- Seguindo os passos em Como adicionar um gráfico, adicione um mapa do Google ao relatório. Escolha o estilo do mapa de bolhas.
- No painel Propriedades, selecione o separador CONFIGURAÇÃO.
- Clique no campo Localização predefinido e substitua-o pela dimensão Cidade.
- Adicione métricas para a cor e o tamanho das bolhas. Por exemplo, selecione Sessões para Tamanho e Tempo médio na página para Cor.
- Selecione o separador Estilo.
- Use os controlos de deslize para ajustar os detalhes do fundo, como estradas, pontos de referência e etiquetas.
- Na secção Cores, selecione cores para o intervalo de valores das métricas.
- Na secção Controlos do mapa, ative ou desative os controlos do mapa que quer permitir que os visitantes usem.
- Veja o relatório. Deslocar, aumentar/diminuir zoom e deslocar a página. Também pode usar o Street View!
Passo seguinte
Parabéns! Criou o seu primeiro relatório do Looker Studio!
Se quiser, adicione títulos, altere cores e estilos, e adicione mais visualizações. Quando tiver tudo pronto para avançar, comece a próxima aula: Veja e partilhe o seu relatório.
Recursos relacionados
Tipos de gráficos no Looker Studio