Cloud Composer 1 | Cloud Composer 2
このページでは、同じ組織内の選択したプロジェクトにまたがる複数の Cloud Composer 環境の統合モニタリング ダッシュボードを実装する方法について説明します。
概要
ここで説明するソリューションは、中央のエンタープライズ プラットフォーム チームが他のチームで使用される Cloud Composer 環境をサポートするのに役立ちます。この実装により、Terraform を使用して作成されていないものを含め、すべての Cloud Composer 環境をモニタリングできます。
このガイドでは、Cloud Composer 環境の主要な指標を継続的に報告し、問題が発生した場合にインシデントを提起するアラート ポリシーとともに、Cloud Composer に Cloud Monitoring ダッシュボードを実装します。ダッシュボードによって、このモニタリング用に選択されたプロジェクト内のすべての Cloud Composer 環境が自動的にスキャンされます。実装は Terraform に依存しています。
このモデルでは、モニタリング プロジェクトとして機能する Google Cloud プロジェクトを使用します。これは、複数のモニタリング対象プロジェクトにデプロイされた Cloud Composer 環境(読み取り専用)をモニタリングするために使用されます。中央のダッシュボードは、モニタリング対象プロジェクトの Cloud Monitoring 指標を使用してコンテンツを表示します。
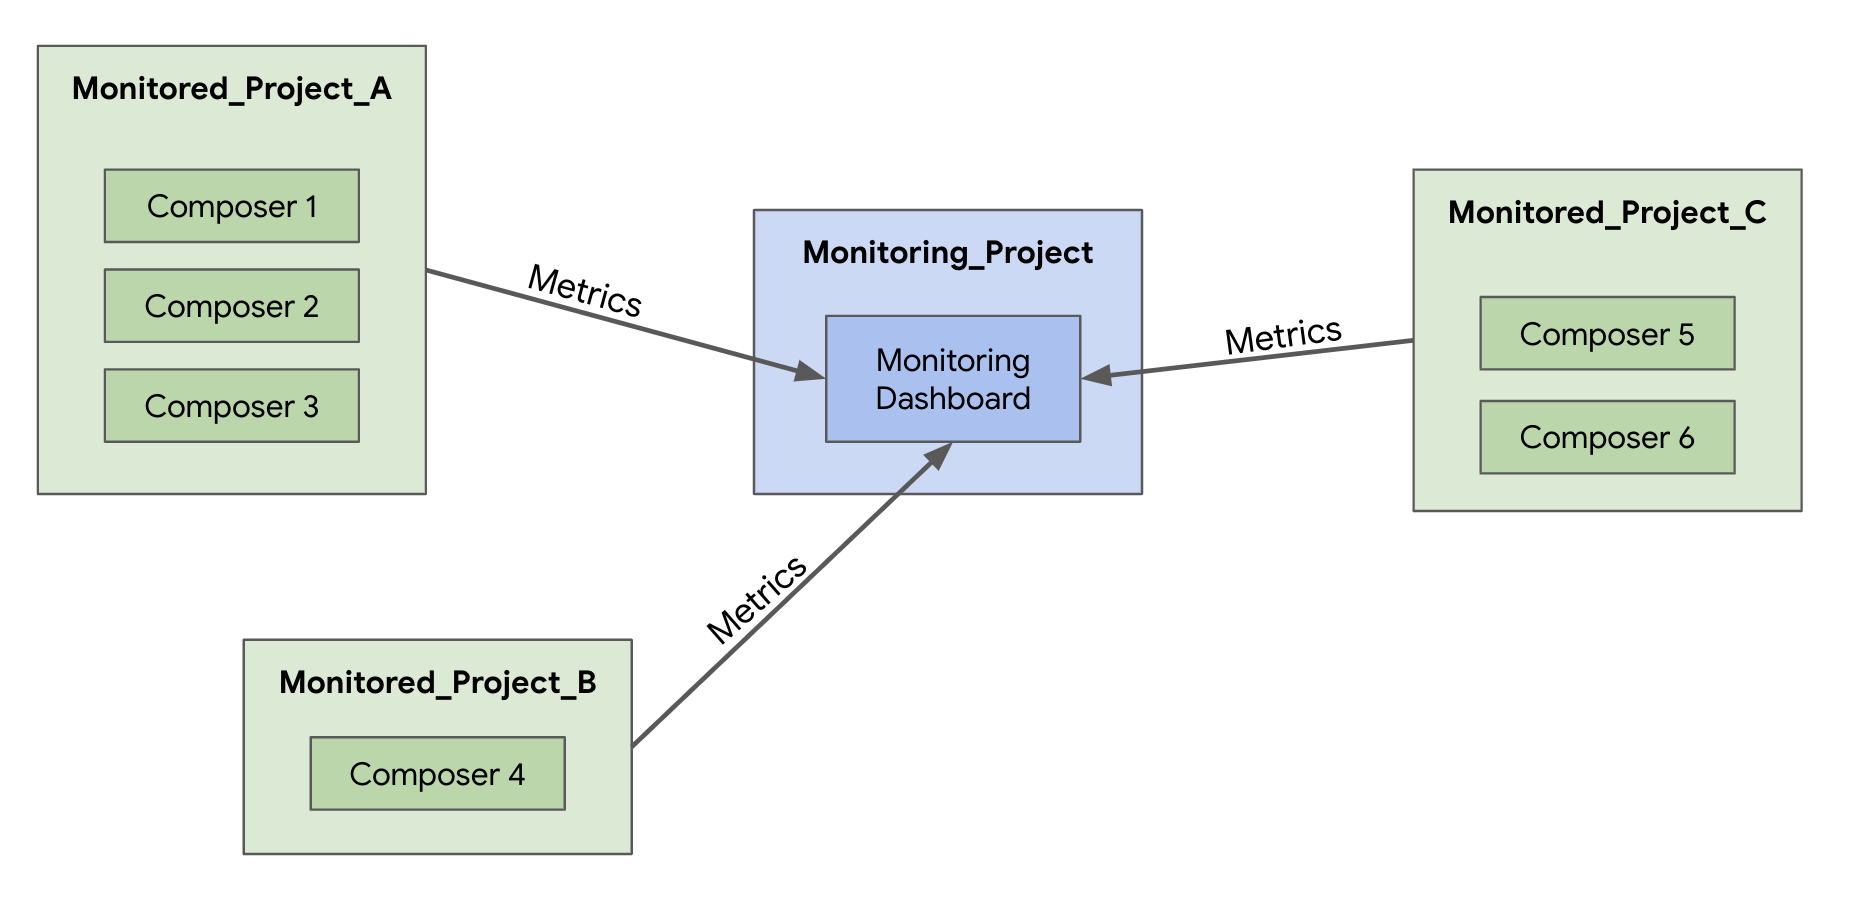
このダッシュボードは、環境のヘルスを含む複数の指標のアラートをモニタリングし、アラートを作成します。
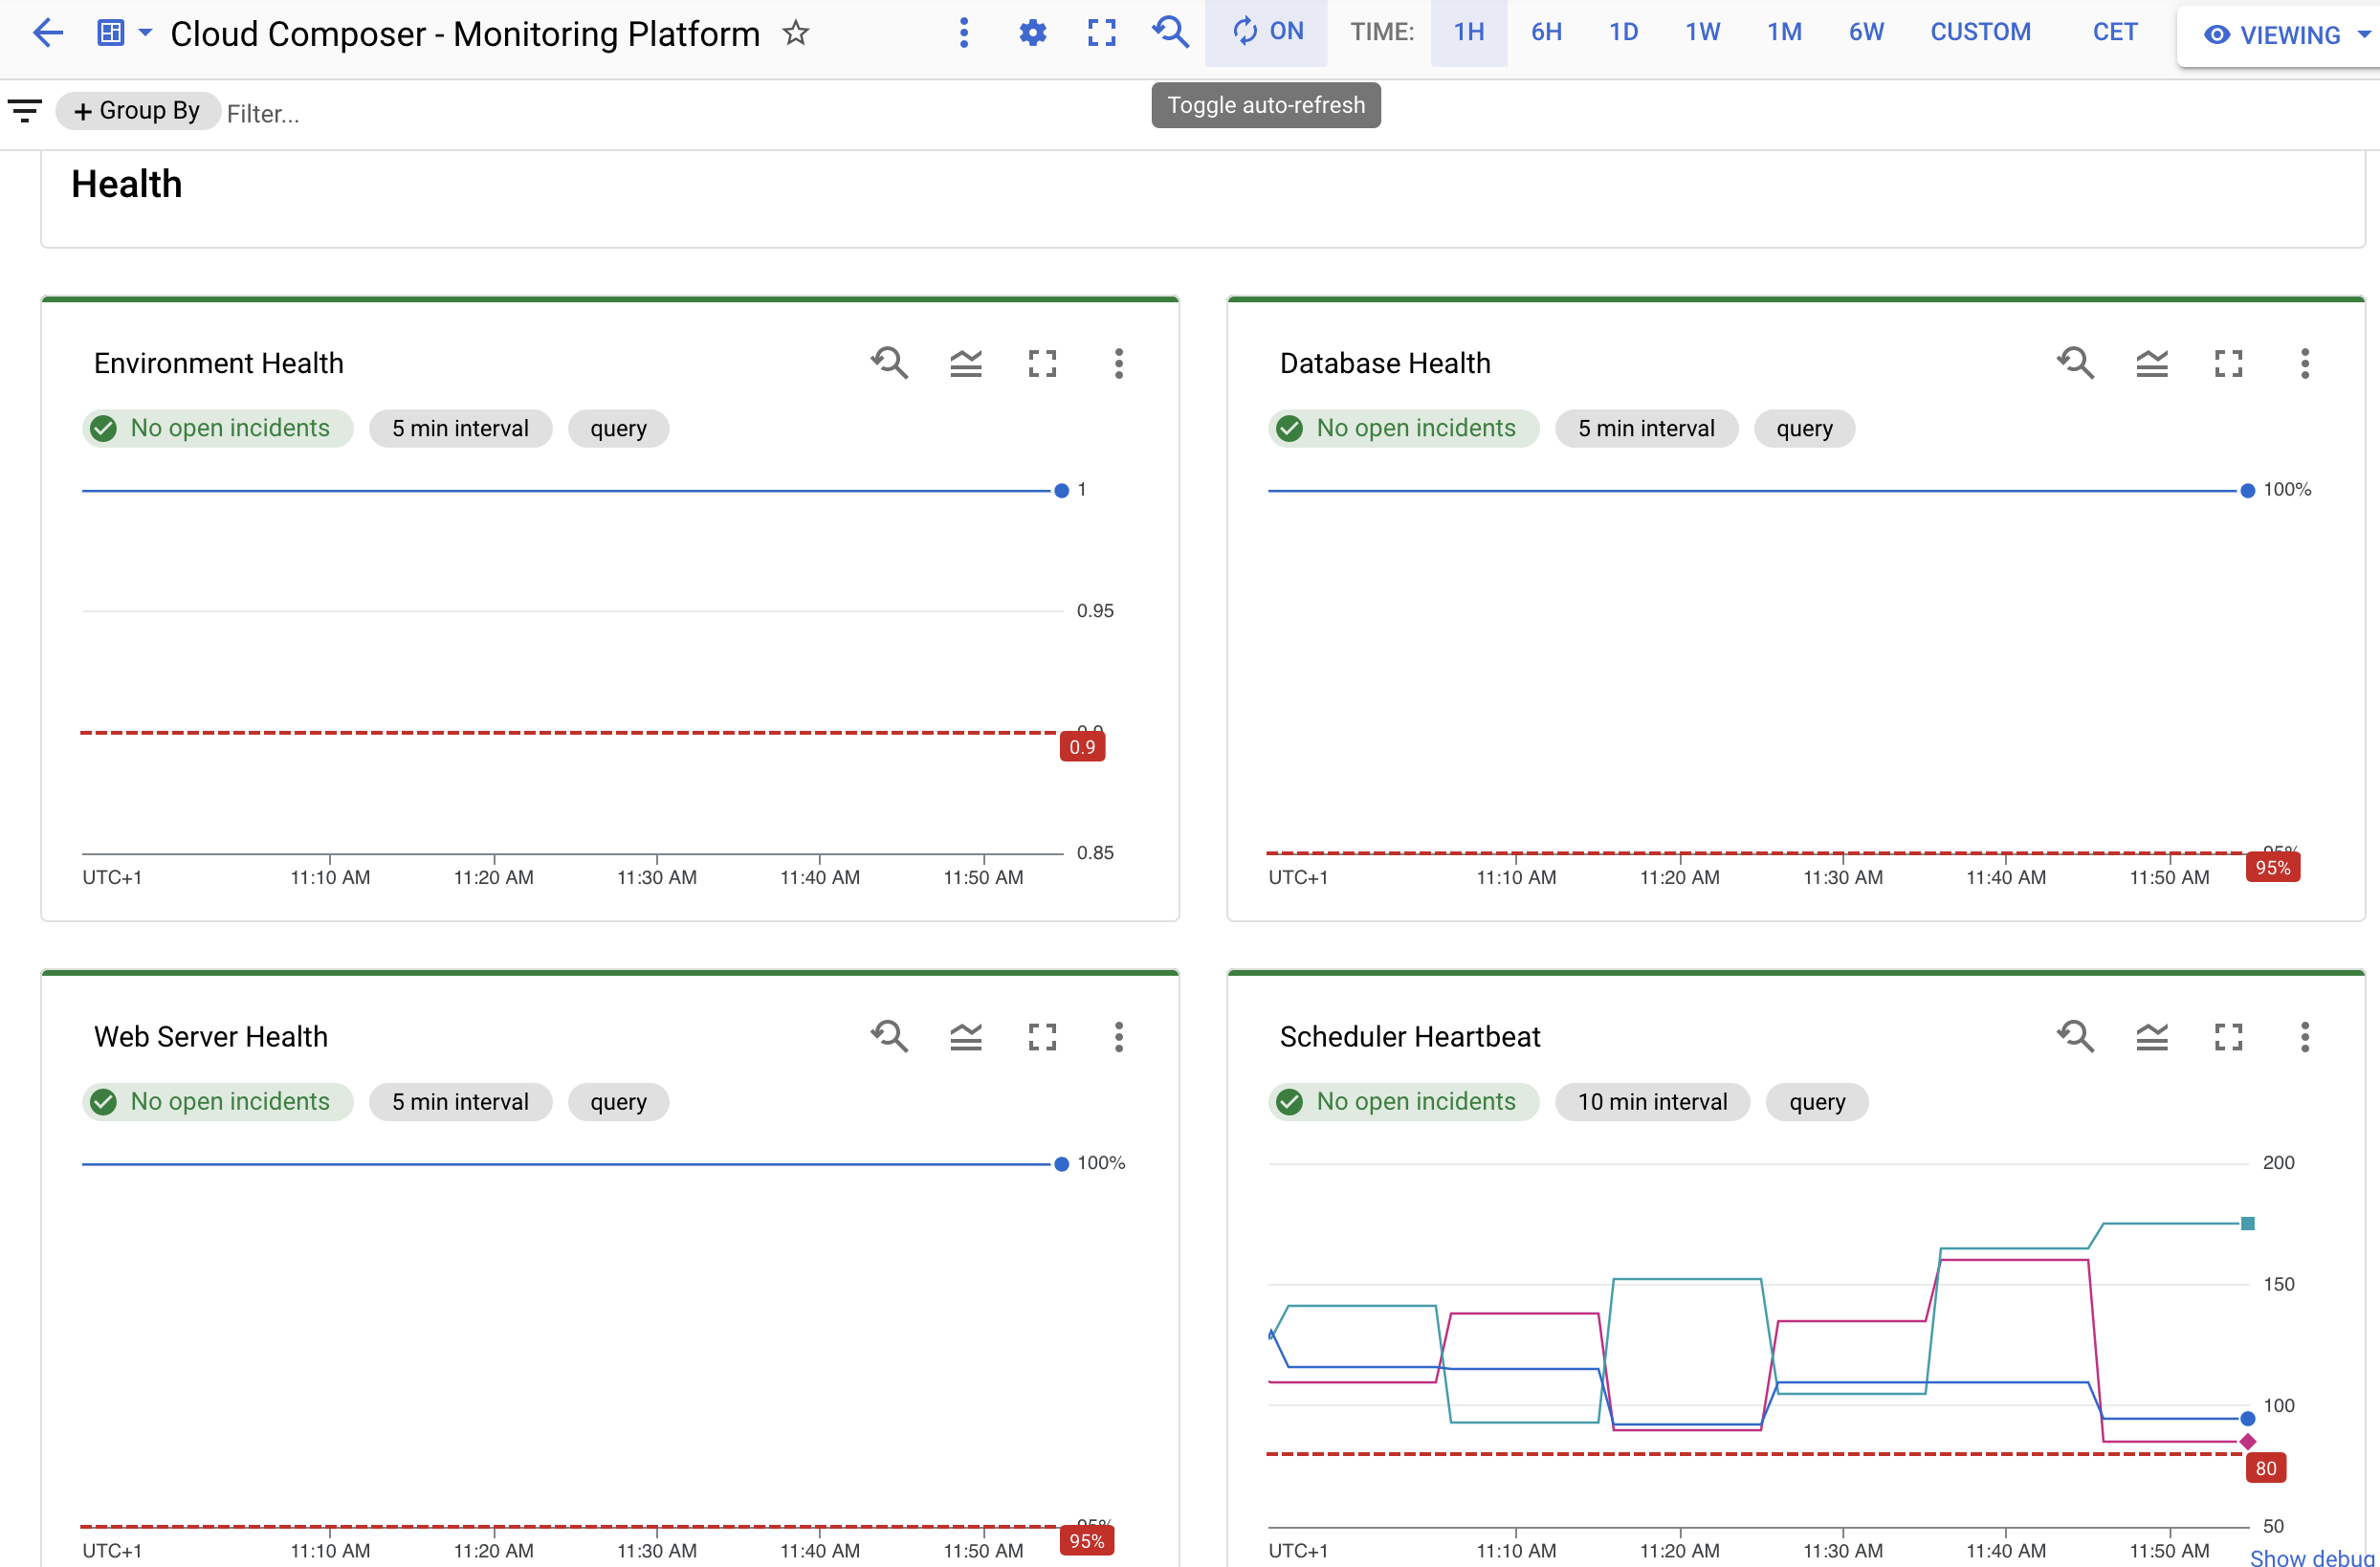
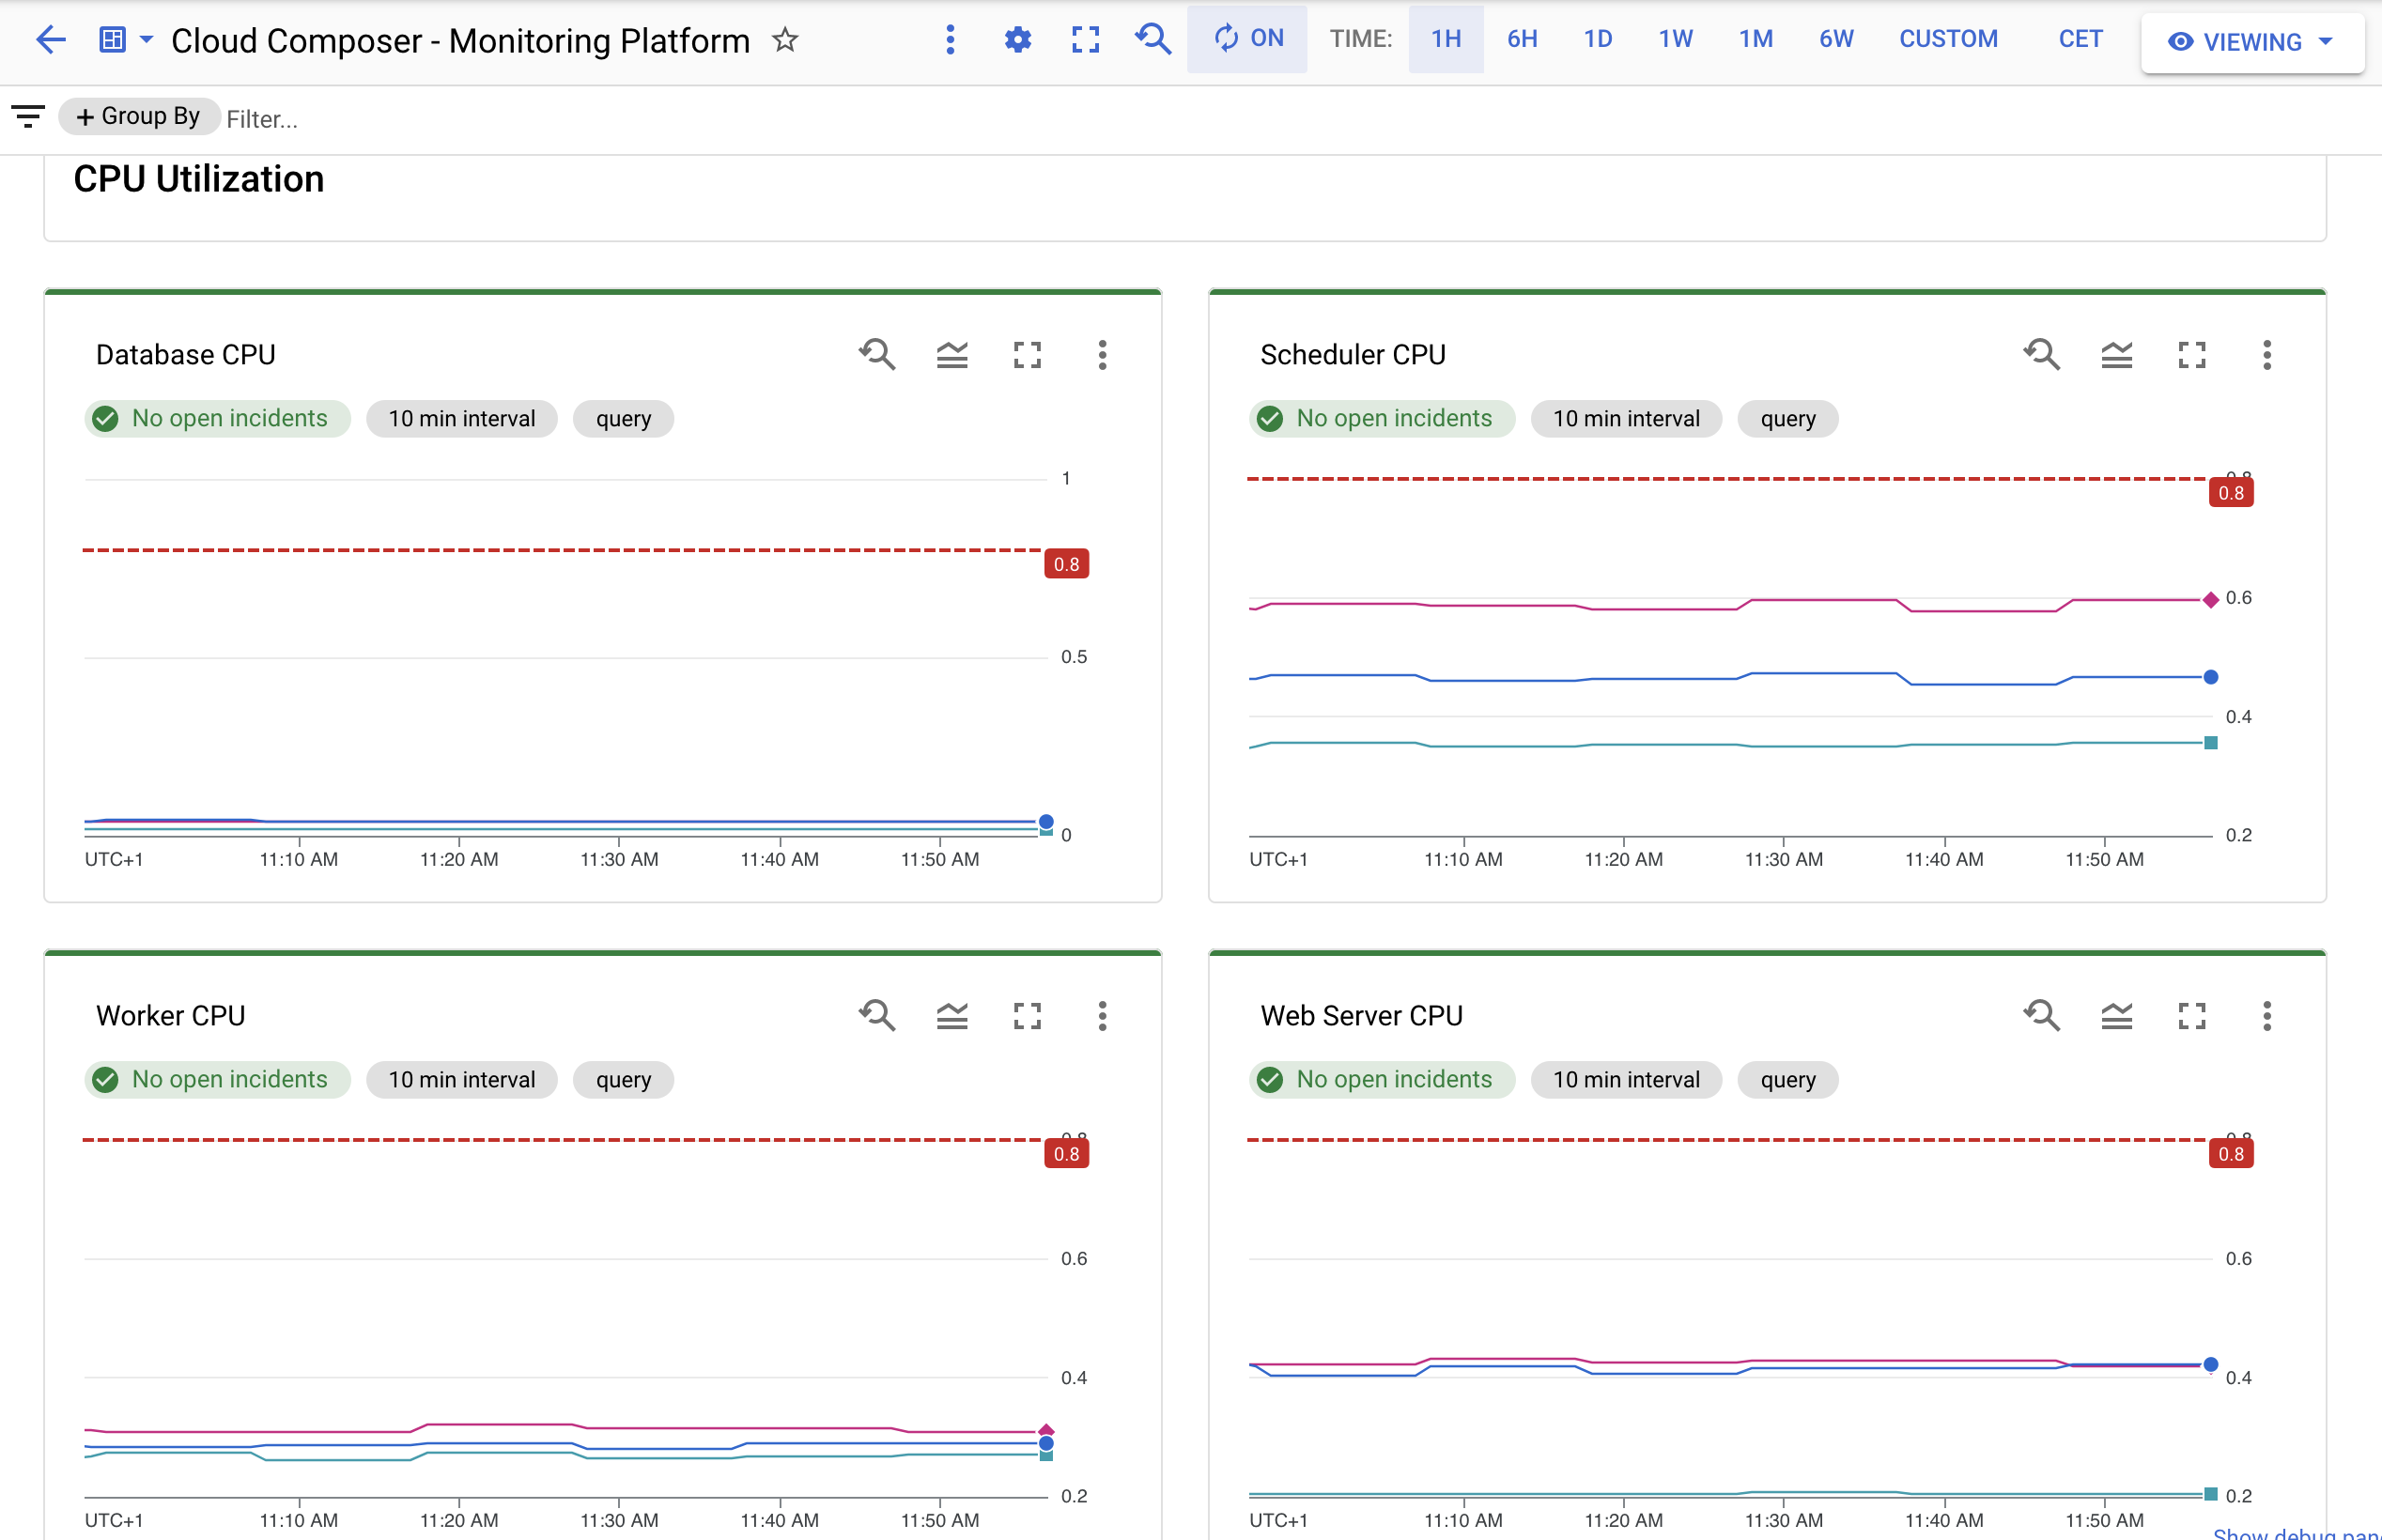
または CPU 指標:
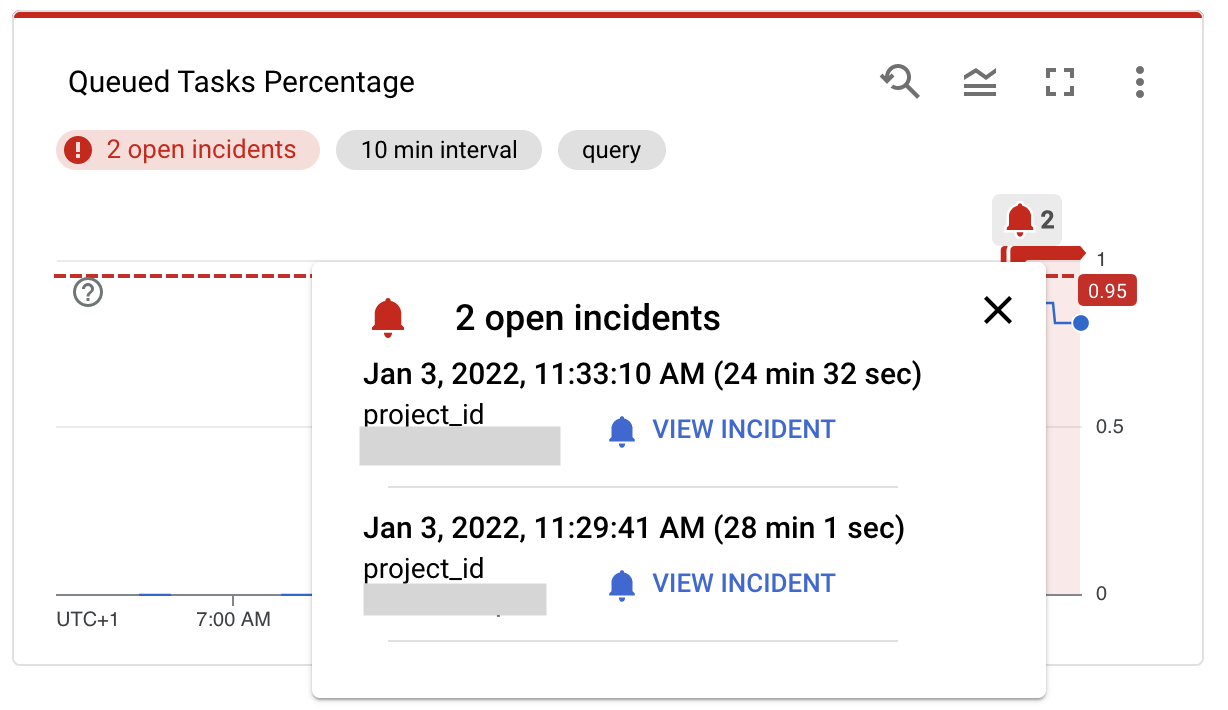
特定の行の上にポインタを置くと、その行が表す環境が表示されます。ダッシュボードには、プロジェクト名とリソースが表示されます。
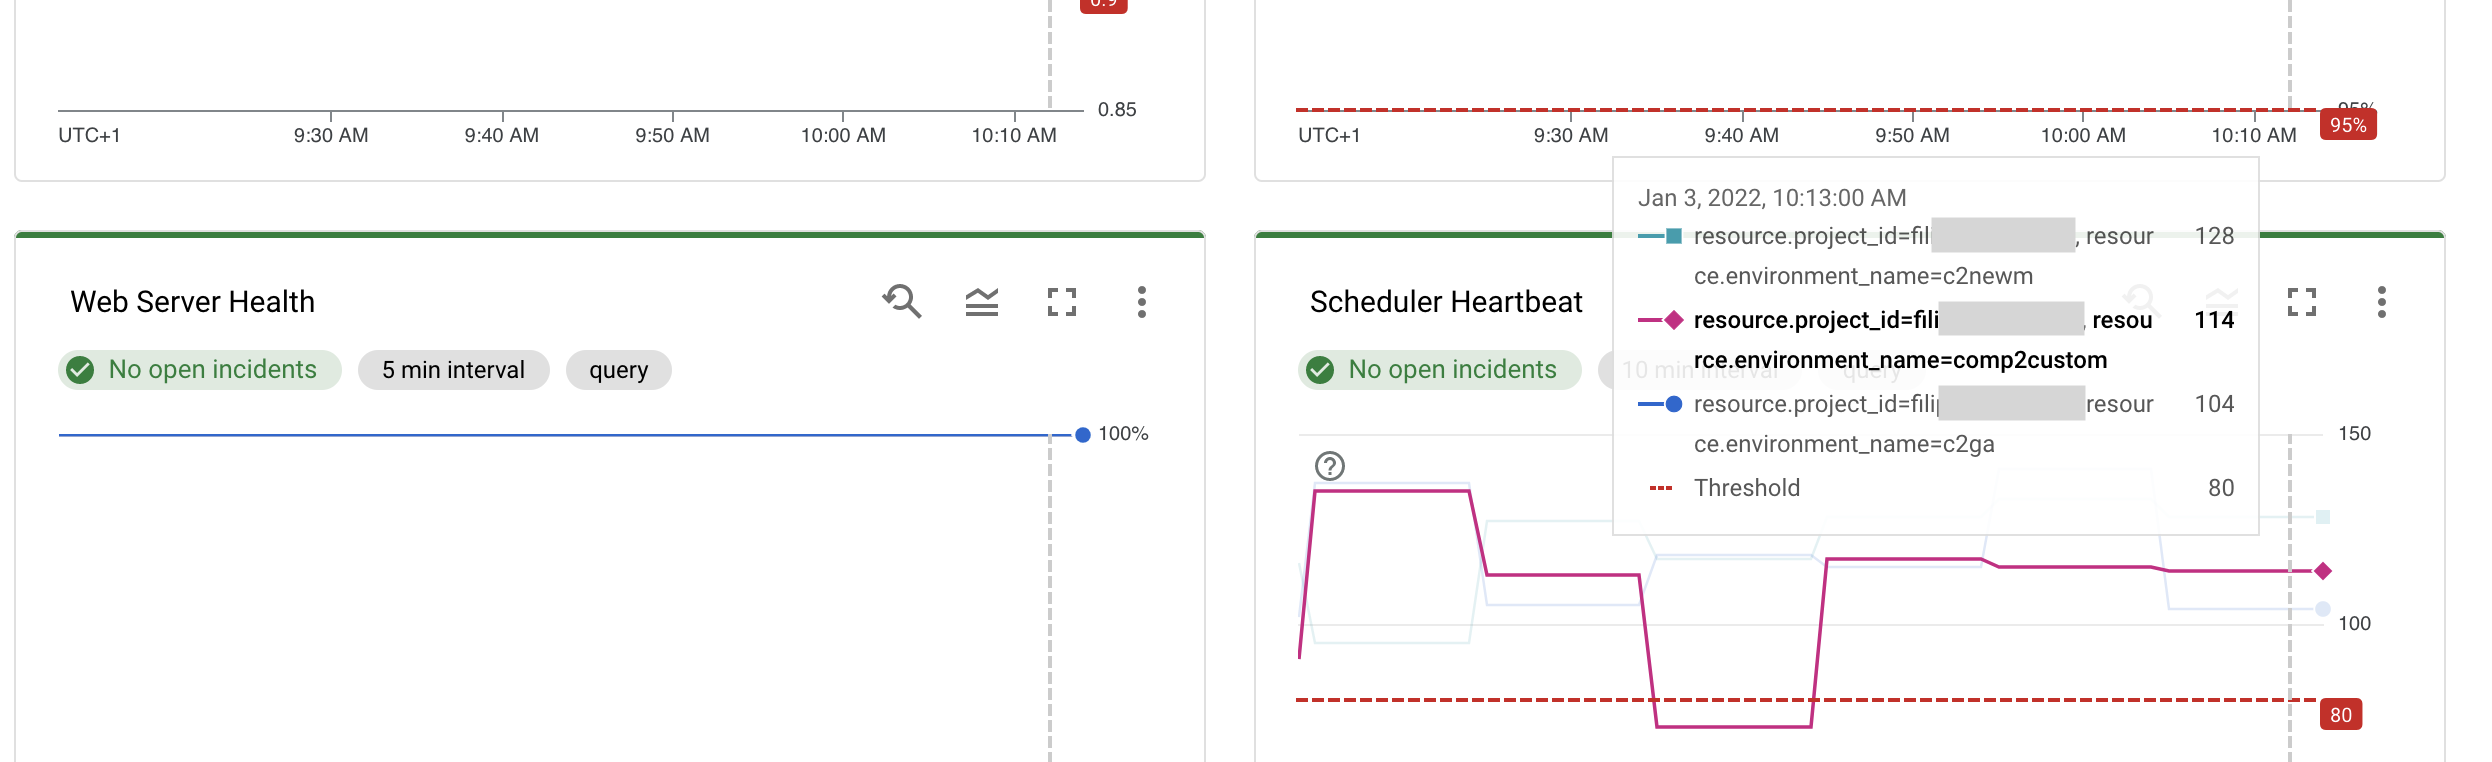
指標が事前定義されたしきい値を超えると、インシデントが発生して、その指標に対応するグラフにアラートが表示されます。
モニタリング対象指標のリスト
モニタリング指標の完全なリスト:
- Cloud Composer 環境のヘルス(Monitoring DAG に基づく)
- データベースのヘルス
- ウェブサーバーのヘルス
- スケジューラのハートビート
- すべてのワーカーの CPU とメモリの使用率
- Airflow データベースの CPU とメモリ使用率
- ウェブサーバーの CPU とメモリの使用率(Cloud Composer 2 でのみ使用可能)
- Airflow スケジューラの CPU とメモリの使用率
- 環境内のキュータスク、スケジュールされたタスク、キュータスク、またはスケジュールされたタスクの割合(Airflow の同時実行構成の問題を見つけるのに有用)
- DAG 解析時間
- ワーカーの現在の数と最小数 - ワーカーの安定性の問題やスケーリングの問題について理解するのに有用
- ワーカーポッドの強制排除
- ワーカー、スケジューラ、ウェブサーバー、その他のコンポーネント(個々のグラフ)によってログでスローされたエラーの数
準備
Cloud Composer と Cloud Monitoring を使用するには、Google Cloud プロジェクトを作成し、課金を有効にする必要があります。プロジェクトには Cloud Composer 環境が含まれている必要があります。このガイドでは、このプロジェクトをモニタリング プロジェクトと呼びます。
- Sign in to your Google Cloud account. If you're new to Google Cloud, create an account to evaluate how our products perform in real-world scenarios. New customers also get $300 in free credits to run, test, and deploy workloads.
-
In the Google Cloud console, on the project selector page, select or create a Google Cloud project.
-
Make sure that billing is enabled for your Google Cloud project.
-
In the Google Cloud console, on the project selector page, select or create a Google Cloud project.
-
Make sure that billing is enabled for your Google Cloud project.
- まだインストールしていなければ、Terraform をインストールします。
- プロジェクトの指標スコープを構成します。デフォルトでは、プロジェクトでは保存されている時系列データのみを表示またはモニタリングできます。データを表示するか、複数のプロジェクトに保存されているデータをモニタリングする場合は、プロジェクトの指標スコープを構成します。詳細については、指標スコープの概要をご覧ください。
実装手順
Terraform を実行するローカル コンピュータで、
GOOGLE_CLOUD_PROJECT環境変数をモニタリング プロジェクトの ID に設定します。export GOOGLE_CLOUD_PROJECT=MONITORING_PROJECT_IDTerraform Google プロバイダが認証され、次の権限があることを確認します。
- モニタリング プロジェクトの
roles/monitoring.editor権限 - すべてのモニタリング対象プロジェクトの
roles/monitoring.viewer、roles/logging.viewer
- モニタリング プロジェクトの
次の
main.tfファイルを、Terraform を実行するローカル コンピュータにコピーします。クリックして開く
# Monitoring for multiple Cloud Composer environments # # Usage: # 1. Create a new project that you will use for monitoring of Cloud Composer environments in other projects # 2. Replace YOUR_MONITORING_PROJECT with the name of this project in the "metrics_scope" parameter that is part of the "Add Monitored Projects to the Monitoring project" section # 3. Replace the list of projects to monitor with your list of projects with Cloud Composer environments to be monitored in the "for_each" parameter of the "Add Monitored Projects to the Monitoring project" section # 4. Set up your environment and apply the configuration following these steps: https://cloud.google.com/docs/terraform/basic-commands. Your GOOGLE_CLOUD_PROJECT environment variable should be the new monitoring project you just created. # # The script creates the following resources in the monitoring project: # 1. Adds monitored projects to Cloud Monitoring # 2. Creates Alert Policies # 3. Creates Monitoring Dashboard # ####################################################### # # Add Monitored Projects to the Monitoring project # ######################################################## resource "google_monitoring_monitored_project" "projects_monitored" { for_each = toset(["YOUR_PROJECT_TO_MONITOR_1", "YOUR_PROJECT_TO_MONITOR_2", "YOUR_PROJECT_TO_MONITOR_3"]) metrics_scope = join("", ["locations/global/metricsScopes/", "YOUR_MONITORING_PROJECT"]) name = each.value } ####################################################### # # Create alert policies in Monitoring project # ######################################################## resource "google_monitoring_alert_policy" "environment_health" { display_name = "Environment Health" combiner = "OR" conditions { display_name = "Environment Health" condition_monitoring_query_language { query = join("", [ "fetch cloud_composer_environment", "| {metric 'composer.googleapis.com/environment/dagbag_size'", "| group_by 5m, [value_dagbag_size_mean: if(mean(value.dagbag_size) > 0, 1, 0)]", "| align mean_aligner(5m)", "| group_by [resource.project_id, resource.environment_name], [value_dagbag_size_mean_aggregate: aggregate(value_dagbag_size_mean)]; ", "metric 'composer.googleapis.com/environment/healthy'", "| group_by 5m, [value_sum_signals: aggregate(if(value.healthy,1,0))]", "| align mean_aligner(5m)| absent_for 5m }", "| outer_join 0", "| group_by [resource.project_id, resource.environment_name]", "| value val(2)", "| align mean_aligner(5m)", "| window(5m)", "| condition val(0) < 0.9" ]) duration = "120s" trigger { count = "1" } } } # uncomment to set an auto close strategy for the alert #alert_strategy { # auto_close = "30m" #} } resource "google_monitoring_alert_policy" "database_health" { display_name = "Database Health" combiner = "OR" conditions { display_name = "Database Health" condition_monitoring_query_language { query = join("", [ "fetch cloud_composer_environment", "| metric 'composer.googleapis.com/environment/database_health'", "| group_by 5m,", " [value_database_health_fraction_true: fraction_true(value.database_health)]", "| every 5m", "| group_by 5m,", " [value_database_health_fraction_true_aggregate:", " aggregate(value_database_health_fraction_true)]", "| every 5m", "| group_by [resource.project_id, resource.environment_name],", " [value_database_health_fraction_true_aggregate_aggregate:", " aggregate(value_database_health_fraction_true_aggregate)]", "| condition val() < 0.95"]) duration = "120s" trigger { count = "1" } } } # uncomment to set an auto close strategy for the alert #alert_strategy { # auto_close = "30m" #} } resource "google_monitoring_alert_policy" "webserver_health" { display_name = "Web Server Health" combiner = "OR" conditions { display_name = "Web Server Health" condition_monitoring_query_language { query = join("", [ "fetch cloud_composer_environment", "| metric 'composer.googleapis.com/environment/web_server/health'", "| group_by 5m, [value_health_fraction_true: fraction_true(value.health)]", "| every 5m", "| group_by 5m,", " [value_health_fraction_true_aggregate:", " aggregate(value_health_fraction_true)]", "| every 5m", "| group_by [resource.project_id, resource.environment_name],", " [value_health_fraction_true_aggregate_aggregate:", " aggregate(value_health_fraction_true_aggregate)]", "| condition val() < 0.95"]) duration = "120s" trigger { count = "1" } } } # uncomment to set an auto close strategy for the alert #alert_strategy { # auto_close = "30m" #} } resource "google_monitoring_alert_policy" "scheduler_heartbeat" { display_name = "Scheduler Heartbeat" combiner = "OR" conditions { display_name = "Scheduler Heartbeat" condition_monitoring_query_language { query = join("", [ "fetch cloud_composer_environment", "| metric 'composer.googleapis.com/environment/scheduler_heartbeat_count'", "| group_by 10m,", " [value_scheduler_heartbeat_count_aggregate:", " aggregate(value.scheduler_heartbeat_count)]", "| every 10m", "| group_by 10m,", " [value_scheduler_heartbeat_count_aggregate_mean:", " mean(value_scheduler_heartbeat_count_aggregate)]", "| every 10m", "| group_by [resource.project_id, resource.environment_name],", " [value_scheduler_heartbeat_count_aggregate_mean_aggregate:", " aggregate(value_scheduler_heartbeat_count_aggregate_mean)]", "| condition val() < 80"]) duration = "120s" trigger { count = "1" } } } # uncomment to set an auto close strategy for the alert #alert_strategy { # auto_close = "30m" #} } resource "google_monitoring_alert_policy" "database_cpu" { display_name = "Database CPU" combiner = "OR" conditions { display_name = "Database CPU" condition_monitoring_query_language { query = join("", [ "fetch cloud_composer_environment", "| metric 'composer.googleapis.com/environment/database/cpu/utilization'", "| group_by 10m, [value_utilization_mean: mean(value.utilization)]", "| every 10m", "| group_by [resource.project_id, resource.environment_name]", "| condition val() > 0.8"]) duration = "120s" trigger { count = "1" } } } # uncomment to set an auto close strategy for the alert #alert_strategy { # auto_close = "30m" #} } resource "google_monitoring_alert_policy" "scheduler_cpu" { display_name = "Scheduler CPU" combiner = "OR" conditions { display_name = "Scheduler CPU" condition_monitoring_query_language { query = join("", [ "fetch k8s_container", "| metric 'kubernetes.io/container/cpu/limit_utilization'", "| filter (resource.pod_name =~ 'airflow-scheduler-.*')", "| group_by 10m, [value_limit_utilization_mean: mean(value.limit_utilization)]", "| every 10m", "| group_by [resource.cluster_name],", " [value_limit_utilization_mean_mean: mean(value_limit_utilization_mean)]", "| condition val() > 0.8"]) duration = "120s" trigger { count = "1" } } } # uncomment to set an auto close strategy for the alert #alert_strategy { # auto_close = "30m" #} } resource "google_monitoring_alert_policy" "worker_cpu" { display_name = "Worker CPU" combiner = "OR" conditions { display_name = "Worker CPU" condition_monitoring_query_language { query = join("", [ "fetch k8s_container", "| metric 'kubernetes.io/container/cpu/limit_utilization'", "| filter (resource.pod_name =~ 'airflow-worker.*')", "| group_by 10m, [value_limit_utilization_mean: mean(value.limit_utilization)]", "| every 10m", "| group_by [resource.cluster_name],", " [value_limit_utilization_mean_mean: mean(value_limit_utilization_mean)]", "| condition val() > 0.8"]) duration = "120s" trigger { count = "1" } } } # uncomment to set an auto close strategy for the alert #alert_strategy { # auto_close = "30m" #} } resource "google_monitoring_alert_policy" "webserver_cpu" { display_name = "Web Server CPU" combiner = "OR" conditions { display_name = "Web Server CPU" condition_monitoring_query_language { query = join("", [ "fetch k8s_container", "| metric 'kubernetes.io/container/cpu/limit_utilization'", "| filter (resource.pod_name =~ 'airflow-webserver.*')", "| group_by 10m, [value_limit_utilization_mean: mean(value.limit_utilization)]", "| every 10m", "| group_by [resource.cluster_name],", " [value_limit_utilization_mean_mean: mean(value_limit_utilization_mean)]", "| condition val() > 0.8"]) duration = "120s" trigger { count = "1" } } } # uncomment to set an auto close strategy for the alert #alert_strategy { # auto_close = "30m" #} } resource "google_monitoring_alert_policy" "parsing_time" { display_name = "DAG Parsing Time" combiner = "OR" conditions { display_name = "DAG Parsing Time" condition_monitoring_query_language { query = join("", [ "fetch cloud_composer_environment", "| metric 'composer.googleapis.com/environment/dag_processing/total_parse_time'", "| group_by 5m, [value_total_parse_time_mean: mean(value.total_parse_time)]", "| every 5m", "| group_by [resource.project_id, resource.environment_name]", "| condition val(0) > cast_units(30,\"s\")"]) duration = "120s" trigger { count = "1" } } } # uncomment to set an auto close strategy for the alert #alert_strategy { # auto_close = "30m" #} } resource "google_monitoring_alert_policy" "database_memory" { display_name = "Database Memory" combiner = "OR" conditions { display_name = "Database Memory" condition_monitoring_query_language { query = join("", [ "fetch cloud_composer_environment", "| metric 'composer.googleapis.com/environment/database/memory/utilization'", "| group_by 10m, [value_utilization_mean: mean(value.utilization)]", "| every 10m", "| group_by [resource.project_id, resource.environment_name]", "| condition val() > 0.8"]) duration = "0s" trigger { count = "1" } } } # uncomment to set an auto close strategy for the alert #alert_strategy { # auto_close = "30m" #} } resource "google_monitoring_alert_policy" "scheduler_memory" { display_name = "Scheduler Memory" combiner = "OR" conditions { display_name = "Scheduler Memory" condition_monitoring_query_language { query = join("", [ "fetch k8s_container", "| metric 'kubernetes.io/container/memory/limit_utilization'", "| filter (resource.pod_name =~ 'airflow-scheduler-.*')", "| group_by 10m, [value_limit_utilization_mean: mean(value.limit_utilization)]", "| every 10m", "| group_by [resource.cluster_name],", " [value_limit_utilization_mean_mean: mean(value_limit_utilization_mean)]", "| condition val() > 0.8"]) duration = "0s" trigger { count = "1" } } } documentation { content = join("", [ "Scheduler Memory exceeds a threshold, summed across all schedulers in the environment. ", "Add more schedulers OR increase scheduler's memory OR reduce scheduling load (e.g. through lower parsing frequency or lower number of DAGs/tasks running"]) } # uncomment to set an auto close strategy for the alert #alert_strategy { # auto_close = "30m" #} } resource "google_monitoring_alert_policy" "worker_memory" { display_name = "Worker Memory" combiner = "OR" conditions { display_name = "Worker Memory" condition_monitoring_query_language { query = join("", [ "fetch k8s_container", "| metric 'kubernetes.io/container/memory/limit_utilization'", "| filter (resource.pod_name =~ 'airflow-worker.*')", "| group_by 10m, [value_limit_utilization_mean: mean(value.limit_utilization)]", "| every 10m", "| group_by [resource.cluster_name],", " [value_limit_utilization_mean_mean: mean(value_limit_utilization_mean)]", "| condition val() > 0.8"]) duration = "0s" trigger { count = "1" } } } # uncomment to set an auto close strategy for the alert #alert_strategy { # auto_close = "30m" #} } resource "google_monitoring_alert_policy" "webserver_memory" { display_name = "Web Server Memory" combiner = "OR" conditions { display_name = "Web Server Memory" condition_monitoring_query_language { query = join("", [ "fetch k8s_container", "| metric 'kubernetes.io/container/memory/limit_utilization'", "| filter (resource.pod_name =~ 'airflow-webserver.*')", "| group_by 10m, [value_limit_utilization_mean: mean(value.limit_utilization)]", "| every 10m", "| group_by [resource.cluster_name],", " [value_limit_utilization_mean_mean: mean(value_limit_utilization_mean)]", "| condition val() > 0.8"]) duration = "0s" trigger { count = "1" } } } # uncomment to set an auto close strategy for the alert #alert_strategy { # auto_close = "30m" #} } resource "google_monitoring_alert_policy" "scheduled_tasks_percentage" { display_name = "Scheduled Tasks Percentage" combiner = "OR" conditions { display_name = "Scheduled Tasks Percentage" condition_monitoring_query_language { query = join("", [ "fetch cloud_composer_environment", "| metric 'composer.googleapis.com/environment/unfinished_task_instances'", "| align mean_aligner(10m)", "| every(10m)", "| window(10m)", "| filter_ratio_by [resource.project_id, resource.environment_name], metric.state = 'scheduled'", "| condition val() > 0.80"]) duration = "300s" trigger { count = "1" } } } # uncomment to set an auto close strategy for the alert #alert_strategy { # auto_close = "30m" #} } resource "google_monitoring_alert_policy" "queued_tasks_percentage" { display_name = "Queued Tasks Percentage" combiner = "OR" conditions { display_name = "Queued Tasks Percentage" condition_monitoring_query_language { query = join("", [ "fetch cloud_composer_environment", "| metric 'composer.googleapis.com/environment/unfinished_task_instances'", "| align mean_aligner(10m)", "| every(10m)", "| window(10m)", "| filter_ratio_by [resource.project_id, resource.environment_name], metric.state = 'queued'", "| group_by [resource.project_id, resource.environment_name]", "| condition val() > 0.95"]) duration = "300s" trigger { count = "1" } } } # uncomment to set an auto close strategy for the alert #alert_strategy { # auto_close = "30m" #} } resource "google_monitoring_alert_policy" "queued_or_scheduled_tasks_percentage" { display_name = "Queued or Scheduled Tasks Percentage" combiner = "OR" conditions { display_name = "Queued or Scheduled Tasks Percentage" condition_monitoring_query_language { query = join("", [ "fetch cloud_composer_environment", "| metric 'composer.googleapis.com/environment/unfinished_task_instances'", "| align mean_aligner(10m)", "| every(10m)", "| window(10m)", "| filter_ratio_by [resource.project_id, resource.environment_name], or(metric.state = 'queued', metric.state = 'scheduled' )", "| group_by [resource.project_id, resource.environment_name]", "| condition val() > 0.80"]) duration = "120s" trigger { count = "1" } } } # uncomment to set an auto close strategy for the alert #alert_strategy { # auto_close = "30m" #} } resource "google_monitoring_alert_policy" "workers_above_minimum" { display_name = "Workers above minimum (negative = missing workers)" combiner = "OR" conditions { display_name = "Workers above minimum" condition_monitoring_query_language { query = join("", [ "fetch cloud_composer_environment", "| { metric 'composer.googleapis.com/environment/num_celery_workers'", "| group_by 5m, [value_num_celery_workers_mean: mean(value.num_celery_workers)]", "| every 5m", "; metric 'composer.googleapis.com/environment/worker/min_workers'", "| group_by 5m, [value_min_workers_mean: mean(value.min_workers)]", "| every 5m }", "| outer_join 0", "| sub", "| group_by [resource.project_id, resource.environment_name]", "| condition val() < 0"]) duration = "0s" trigger { count = "1" } } } # uncomment to set an auto close strategy for the alert #alert_strategy { # auto_close = "30m" #} } resource "google_monitoring_alert_policy" "pod_evictions" { display_name = "Worker pod evictions" combiner = "OR" conditions { display_name = "Worker pod evictions" condition_monitoring_query_language { query = join("", [ "fetch cloud_composer_environment", "| metric 'composer.googleapis.com/environment/worker/pod_eviction_count'", "| align delta(1m)", "| every 1m", "| group_by [resource.project_id, resource.environment_name]", "| condition val() > 0"]) duration = "60s" trigger { count = "1" } } } # uncomment to set an auto close strategy for the alert #alert_strategy { # auto_close = "30m" #} } resource "google_monitoring_alert_policy" "scheduler_errors" { display_name = "Scheduler Errors" combiner = "OR" conditions { display_name = "Scheduler Errors" condition_monitoring_query_language { query = join("", [ "fetch cloud_composer_environment", "| metric 'logging.googleapis.com/log_entry_count'", "| filter (metric.log == 'airflow-scheduler' && metric.severity == 'ERROR')", "| group_by 5m,", " [value_log_entry_count_aggregate: aggregate(value.log_entry_count)]", "| every 5m", "| group_by [resource.project_id, resource.environment_name],", " [value_log_entry_count_aggregate_max: max(value_log_entry_count_aggregate)]", "| condition val() > 50"]) duration = "300s" trigger { count = "1" } } } # uncomment to set an auto close strategy for the alert #alert_strategy { # auto_close = "30m" #} } resource "google_monitoring_alert_policy" "worker_errors" { display_name = "Worker Errors" combiner = "OR" conditions { display_name = "Worker Errors" condition_monitoring_query_language { query = join("", [ "fetch cloud_composer_environment", "| metric 'logging.googleapis.com/log_entry_count'", "| filter (metric.log == 'airflow-worker' && metric.severity == 'ERROR')", "| group_by 5m,", " [value_log_entry_count_aggregate: aggregate(value.log_entry_count)]", "| every 5m", "| group_by [resource.project_id, resource.environment_name],", " [value_log_entry_count_aggregate_max: max(value_log_entry_count_aggregate)]", "| condition val() > 50"]) duration = "300s" trigger { count = "1" } } } # uncomment to set an auto close strategy for the alert #alert_strategy { # auto_close = "30m" #} } resource "google_monitoring_alert_policy" "webserver_errors" { display_name = "Web Server Errors" combiner = "OR" conditions { display_name = "Web Server Errors" condition_monitoring_query_language { query = join("", [ "fetch cloud_composer_environment", "| metric 'logging.googleapis.com/log_entry_count'", "| filter (metric.log == 'airflow-webserver' && metric.severity == 'ERROR')", "| group_by 5m,", " [value_log_entry_count_aggregate: aggregate(value.log_entry_count)]", "| every 5m", "| group_by [resource.project_id, resource.environment_name],", " [value_log_entry_count_aggregate_max: max(value_log_entry_count_aggregate)]", "| condition val() > 50"]) duration = "300s" trigger { count = "1" } } } # uncomment to set an auto close strategy for the alert #alert_strategy { # auto_close = "30m" #} } resource "google_monitoring_alert_policy" "other_errors" { display_name = "Other Errors" combiner = "OR" conditions { display_name = "Other Errors" condition_monitoring_query_language { query = join("", [ "fetch cloud_composer_environment", "| metric 'logging.googleapis.com/log_entry_count'", "| filter", " (metric.log !~ 'airflow-scheduler|airflow-worker|airflow-webserver'", " && metric.severity == 'ERROR')", "| group_by 5m, [value_log_entry_count_max: max(value.log_entry_count)]", "| every 5m", "| group_by [resource.project_id, resource.environment_name],", " [value_log_entry_count_max_aggregate: aggregate(value_log_entry_count_max)]", "| condition val() > 10"]) duration = "300s" trigger { count = "1" } } } # uncomment to set an auto close strategy for the alert #alert_strategy { # auto_close = "30m" #} } ####################################################### # # Create Monitoring Dashboard # ######################################################## resource "google_monitoring_dashboard" "Composer_Dashboard" { dashboard_json = <<EOF { "category": "CUSTOM", "displayName": "Cloud Composer - Monitoring Platform", "mosaicLayout": { "columns": 12, "tiles": [ { "height": 1, "widget": { "text": { "content": "", "format": "MARKDOWN" }, "title": "Health" }, "width": 12, "xPos": 0, "yPos": 0 }, { "height": 4, "widget": { "alertChart": { "name": "${google_monitoring_alert_policy.environment_health.name}" } }, "width": 6, "xPos": 0, "yPos": 1 }, { "height": 4, "widget": { "alertChart": { "name": "${google_monitoring_alert_policy.database_health.name}" } }, "width": 6, "xPos": 6, "yPos": 1 }, { "height": 4, "widget": { "alertChart": { "name": "${google_monitoring_alert_policy.webserver_health.name}" } }, "width": 6, "xPos": 0, "yPos": 5 }, { "height": 4, "widget": { "alertChart": { "name": "${google_monitoring_alert_policy.scheduler_heartbeat.name}" } }, "width": 6, "xPos": 6, "yPos": 5 }, { "height": 1, "widget": { "text": { "content": "", "format": "RAW" }, "title": "Airflow Task Execution and DAG Parsing" }, "width": 12, "xPos": 0, "yPos": 9 }, { "height": 4, "widget": { "alertChart": { "name": "${google_monitoring_alert_policy.scheduled_tasks_percentage.name}" } }, "width": 6, "xPos": 0, "yPos": 10 }, { "height": 4, "widget": { "alertChart": { "name": "${google_monitoring_alert_policy.queued_tasks_percentage.name}" } }, "width": 6, "xPos": 6, "yPos": 10 }, { "height": 4, "widget": { "alertChart": { "name": "${google_monitoring_alert_policy.queued_or_scheduled_tasks_percentage.name}" } }, "width": 6, "xPos": 0, "yPos": 14 }, { "height": 4, "widget": { "alertChart": { "name": "${google_monitoring_alert_policy.parsing_time.name}" } }, "width": 6, "xPos": 6, "yPos": 14 }, { "height": 1, "widget": { "text": { "content": "", "format": "RAW" }, "title": "Workers presence" }, "width": 12, "xPos": 0, "yPos": 18 }, { "height": 4, "widget": { "alertChart": { "name": "${google_monitoring_alert_policy.workers_above_minimum.name}" } }, "width": 6, "xPos": 0, "yPos": 19 }, { "height": 4, "widget": { "alertChart": { "name": "${google_monitoring_alert_policy.pod_evictions.name}" } }, "width": 6, "xPos": 6, "yPos": 19 }, { "height": 1, "widget": { "text": { "content": "", "format": "RAW" }, "title": "CPU Utilization" }, "width": 12, "xPos": 0, "yPos": 23 }, { "height": 4, "widget": { "alertChart": { "name": "${google_monitoring_alert_policy.database_cpu.name}" } }, "width": 6, "xPos": 0, "yPos": 24 }, { "height": 4, "widget": { "alertChart": { "name": "${google_monitoring_alert_policy.scheduler_cpu.name}" } }, "width": 6, "xPos": 6, "yPos": 24 }, { "height": 4, "widget": { "alertChart": { "name": "${google_monitoring_alert_policy.worker_cpu.name}" } }, "width": 6, "xPos": 0, "yPos": 28 }, { "height": 4, "widget": { "alertChart": { "name": "${google_monitoring_alert_policy.webserver_cpu.name}" } }, "width": 6, "xPos": 6, "yPos": 28 }, { "height": 1, "widget": { "text": { "content": "", "format": "RAW" }, "title": "Memory Utilization" }, "width": 12, "xPos": 0, "yPos": 32 }, { "height": 4, "widget": { "alertChart": { "name": "${google_monitoring_alert_policy.database_memory.name}" } }, "width": 6, "xPos": 0, "yPos": 33 }, { "height": 4, "widget": { "alertChart": { "name": "${google_monitoring_alert_policy.scheduler_memory.name}" } }, "width": 6, "xPos": 6, "yPos": 33 }, { "height": 4, "widget": { "alertChart": { "name": "${google_monitoring_alert_policy.worker_memory.name}" } }, "width": 6, "xPos": 0, "yPos": 37 }, { "height": 4, "widget": { "alertChart": { "name": "${google_monitoring_alert_policy.webserver_memory.name}" } }, "width": 6, "xPos": 6, "yPos": 37 }, { "height": 1, "widget": { "text": { "content": "", "format": "RAW" }, "title": "Airflow component errors" }, "width": 12, "xPos": 0, "yPos": 41 }, { "height": 4, "widget": { "alertChart": { "name": "${google_monitoring_alert_policy.scheduler_errors.name}" } }, "width": 6, "xPos": 0, "yPos": 42 }, { "height": 4, "widget": { "alertChart": { "name": "${google_monitoring_alert_policy.worker_errors.name}" } }, "width": 6, "xPos": 6, "yPos": 42 }, { "height": 4, "widget": { "alertChart": { "name": "${google_monitoring_alert_policy.webserver_errors.name}" } }, "width": 6, "xPos": 0, "yPos": 48 }, { "height": 4, "widget": { "alertChart": { "name": "${google_monitoring_alert_policy.other_errors.name}" } }, "width": 6, "xPos": 6, "yPos": 48 }, { "height": 1, "widget": { "text": { "content": "", "format": "RAW" }, "title": "Task errors" }, "width": 12, "xPos": 0, "yPos": 52 } ] } } EOF }"google_monitoring_monitored_project"resourceブロックを編集します。for_eachブロックのプロジェクトのリストをモニタリング対象プロジェクトに置き換えます。metrics_scopeの"YOUR_MONITORING_PROJECT"は、モニタリング プロジェクトの名前に置き換えます。
構成を確認して、Terraform が作成または更新するリソースが想定どおりであることを確認します。必要に応じて修正します。
terraform plan次のコマンドを実行し、プロンプトで「yes」と入力して、Terraform 構成を適用します。
terraform applyモニタリング プロジェクト の Google Cloud コンソールで、[モニタリング ダッシュボード] ページに移動します。
モニタリング ダッシュボード にする
[カスタム] タブで、[Cloud Composer - モニタリング プラットフォーム] という名前のカスタム ダッシュボードを探します。