# Monitoring for multiple Cloud Composer environments
#
# Usage:
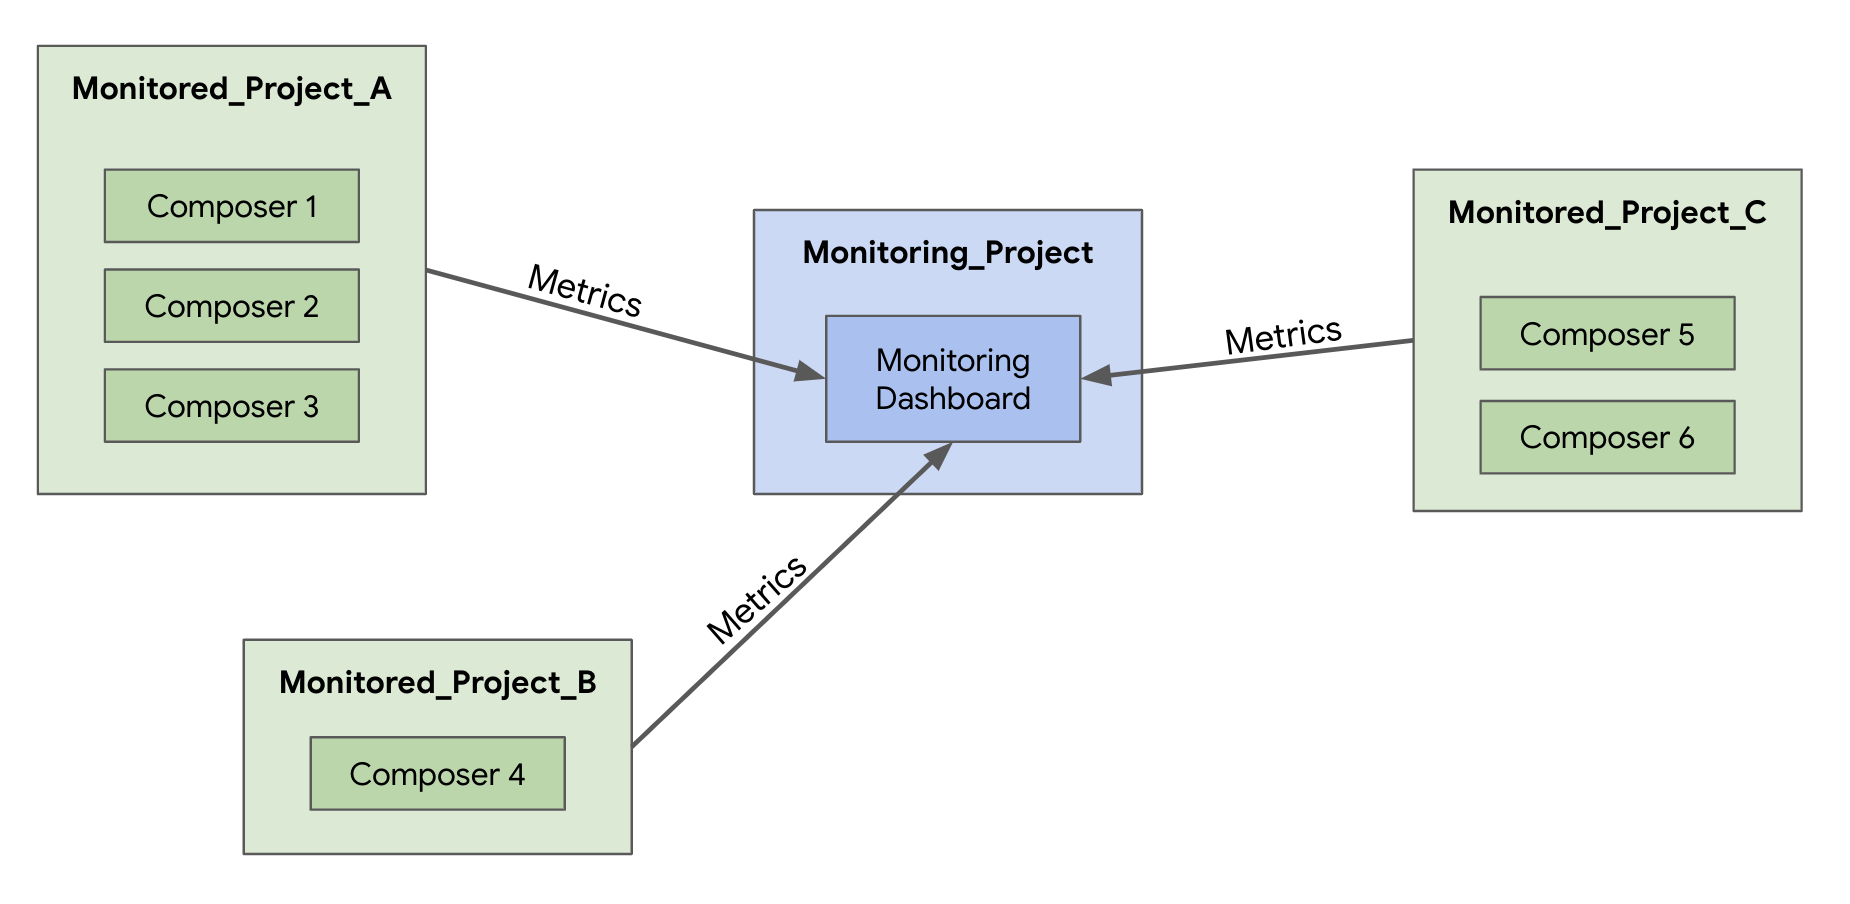
# 1. Create a new project that you will use for monitoring of Cloud Composer environments in other projects
# 2. Replace YOUR_MONITORING_PROJECT with the name of this project in the "metrics_scope" parameter that is part of the "Add Monitored Projects to the Monitoring project" section
# 3. Replace the list of projects to monitor with your list of projects with Cloud Composer environments to be monitored in the "for_each" parameter of the "Add Monitored Projects to the Monitoring project" section
# 4. Set up your environment and apply the configuration following these steps: https://cloud.google.com/docs/terraform/basic-commands. Your GOOGLE_CLOUD_PROJECT environment variable should be the new monitoring project you just created.
#
# The script creates the following resources in the monitoring project:
# 1. Adds monitored projects to Cloud Monitoring
# 2. Creates Alert Policies
# 3. Creates Monitoring Dashboard
#
#######################################################
#
# Add Monitored Projects to the Monitoring project
#
########################################################
resource "google_monitoring_monitored_project" "projects_monitored" {
for_each = toset(["YOUR_PROJECT_TO_MONITOR_1", "YOUR_PROJECT_TO_MONITOR_2", "YOUR_PROJECT_TO_MONITOR_3"])
metrics_scope = join("", ["locations/global/metricsScopes/", "YOUR_MONITORING_PROJECT"])
name = each.value
}
#######################################################
#
# Create alert policies in Monitoring project
#
########################################################
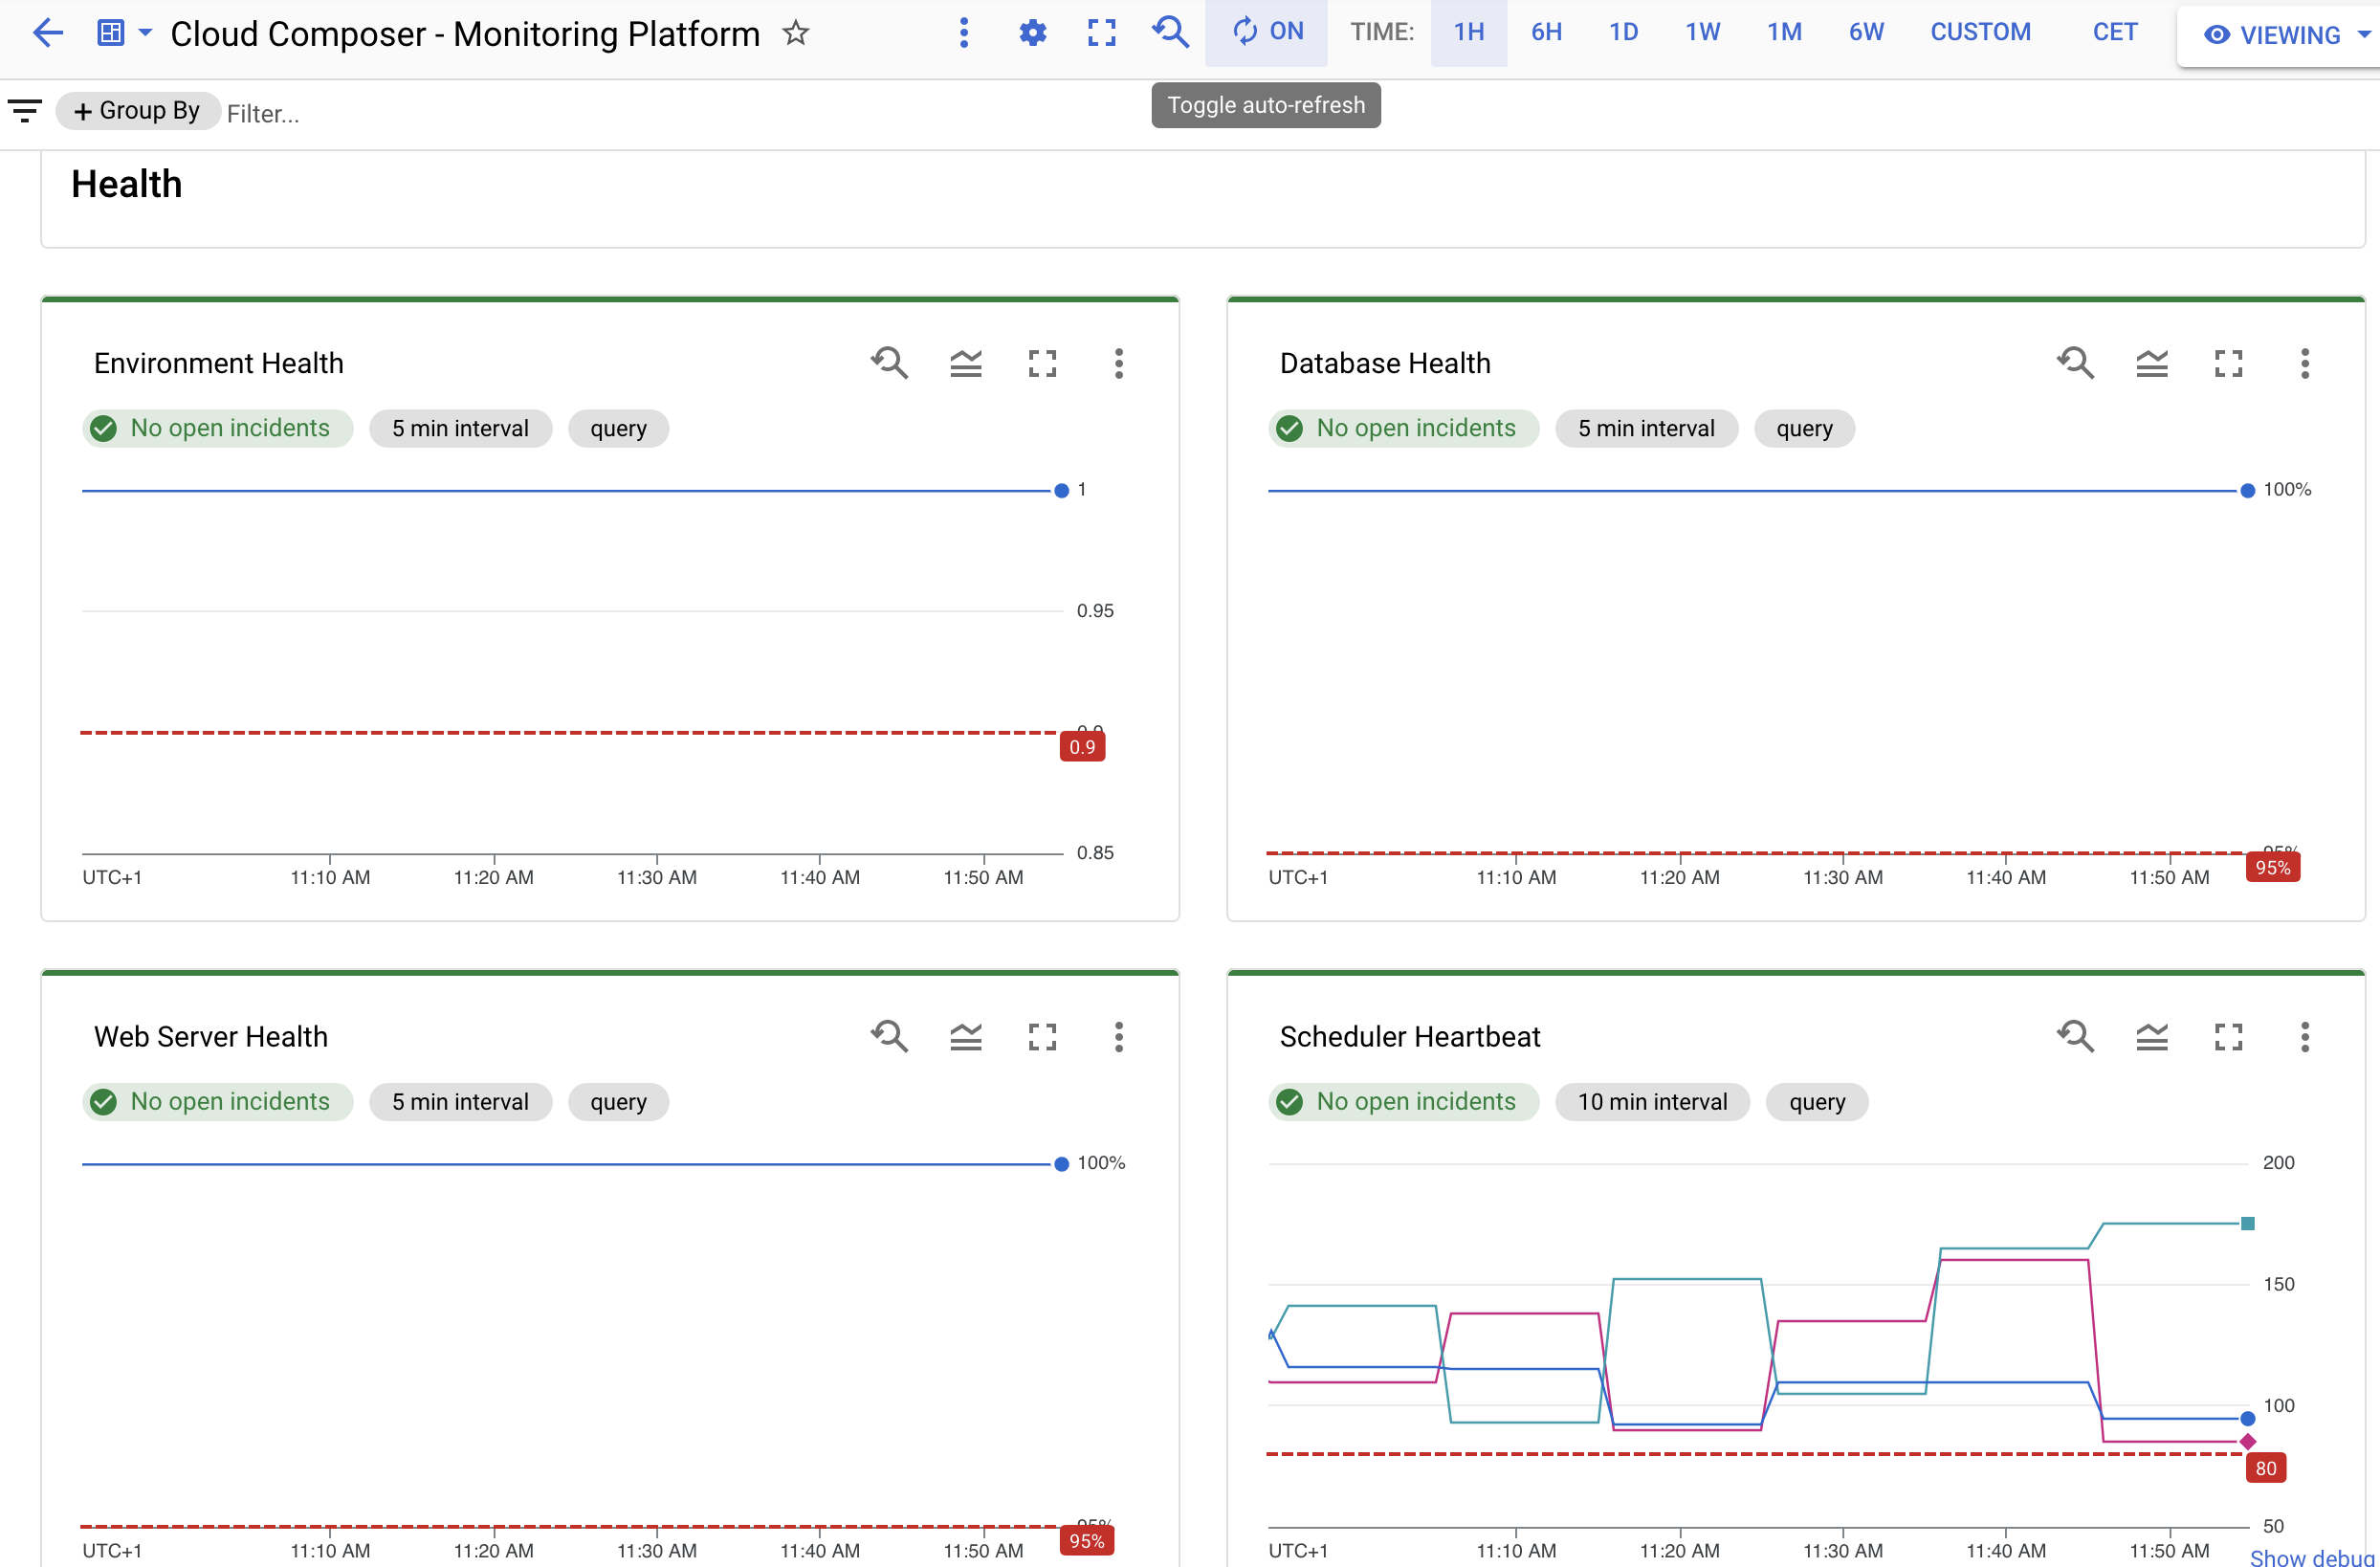
resource "google_monitoring_alert_policy" "environment_health" {
display_name = "Environment Health"
combiner = "OR"
conditions {
display_name = "Environment Health"
condition_monitoring_query_language {
query = join("", [
"fetch cloud_composer_environment",
"| {metric 'composer.googleapis.com/environment/dagbag_size'",
"| group_by 5m, [value_dagbag_size_mean: if(mean(value.dagbag_size) > 0, 1, 0)]",
"| align mean_aligner(5m)",
"| group_by [resource.project_id, resource.environment_name], [value_dagbag_size_mean_aggregate: aggregate(value_dagbag_size_mean)]; ",
"metric 'composer.googleapis.com/environment/healthy'",
"| group_by 5m, [value_sum_signals: aggregate(if(value.healthy,1,0))]",
"| align mean_aligner(5m)| absent_for 5m }",
"| outer_join 0",
"| group_by [resource.project_id, resource.environment_name]",
"| value val(2)",
"| align mean_aligner(5m)",
"| window(5m)",
"| condition val(0) < 0.9"
])
duration = "120s"
trigger {
count = "1"
}
}
}
# uncomment to set an auto close strategy for the alert
#alert_strategy {
# auto_close = "30m"
#}
}
resource "google_monitoring_alert_policy" "database_health" {
display_name = "Database Health"
combiner = "OR"
conditions {
display_name = "Database Health"
condition_monitoring_query_language {
query = join("", [
"fetch cloud_composer_environment",
"| metric 'composer.googleapis.com/environment/database_health'",
"| group_by 5m,",
" [value_database_health_fraction_true: fraction_true(value.database_health)]",
"| every 5m",
"| group_by 5m,",
" [value_database_health_fraction_true_aggregate:",
" aggregate(value_database_health_fraction_true)]",
"| every 5m",
"| group_by [resource.project_id, resource.environment_name],",
" [value_database_health_fraction_true_aggregate_aggregate:",
" aggregate(value_database_health_fraction_true_aggregate)]",
"| condition val() < 0.95"])
duration = "120s"
trigger {
count = "1"
}
}
}
# uncomment to set an auto close strategy for the alert
#alert_strategy {
# auto_close = "30m"
#}
}
resource "google_monitoring_alert_policy" "webserver_health" {
display_name = "Web Server Health"
combiner = "OR"
conditions {
display_name = "Web Server Health"
condition_monitoring_query_language {
query = join("", [
"fetch cloud_composer_environment",
"| metric 'composer.googleapis.com/environment/web_server/health'",
"| group_by 5m, [value_health_fraction_true: fraction_true(value.health)]",
"| every 5m",
"| group_by 5m,",
" [value_health_fraction_true_aggregate:",
" aggregate(value_health_fraction_true)]",
"| every 5m",
"| group_by [resource.project_id, resource.environment_name],",
" [value_health_fraction_true_aggregate_aggregate:",
" aggregate(value_health_fraction_true_aggregate)]",
"| condition val() < 0.95"])
duration = "120s"
trigger {
count = "1"
}
}
}
# uncomment to set an auto close strategy for the alert
#alert_strategy {
# auto_close = "30m"
#}
}
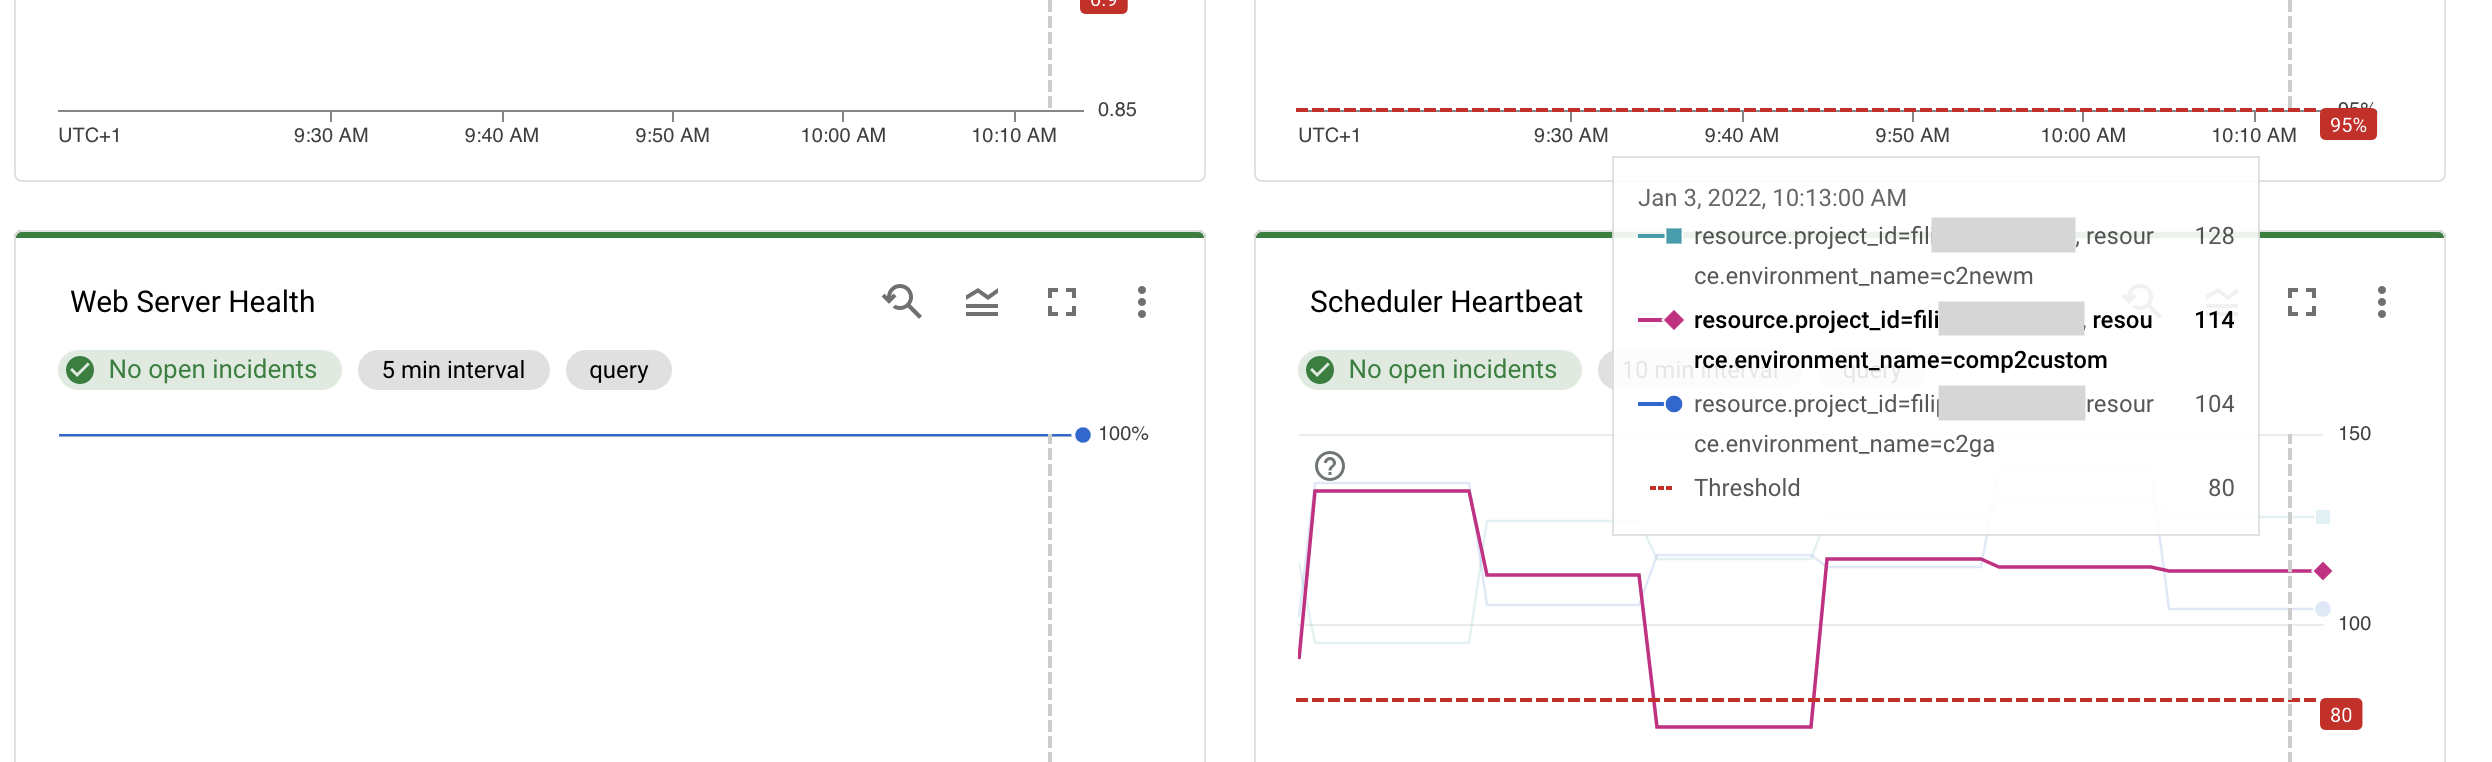
resource "google_monitoring_alert_policy" "scheduler_heartbeat" {
display_name = "Scheduler Heartbeat"
combiner = "OR"
conditions {
display_name = "Scheduler Heartbeat"
condition_monitoring_query_language {
query = join("", [
"fetch cloud_composer_environment",
"| metric 'composer.googleapis.com/environment/scheduler_heartbeat_count'",
"| group_by 10m,",
" [value_scheduler_heartbeat_count_aggregate:",
" aggregate(value.scheduler_heartbeat_count)]",
"| every 10m",
"| group_by 10m,",
" [value_scheduler_heartbeat_count_aggregate_mean:",
" mean(value_scheduler_heartbeat_count_aggregate)]",
"| every 10m",
"| group_by [resource.project_id, resource.environment_name],",
" [value_scheduler_heartbeat_count_aggregate_mean_aggregate:",
" aggregate(value_scheduler_heartbeat_count_aggregate_mean)]",
"| condition val() < 80"])
duration = "120s"
trigger {
count = "1"
}
}
}
# uncomment to set an auto close strategy for the alert
#alert_strategy {
# auto_close = "30m"
#}
}
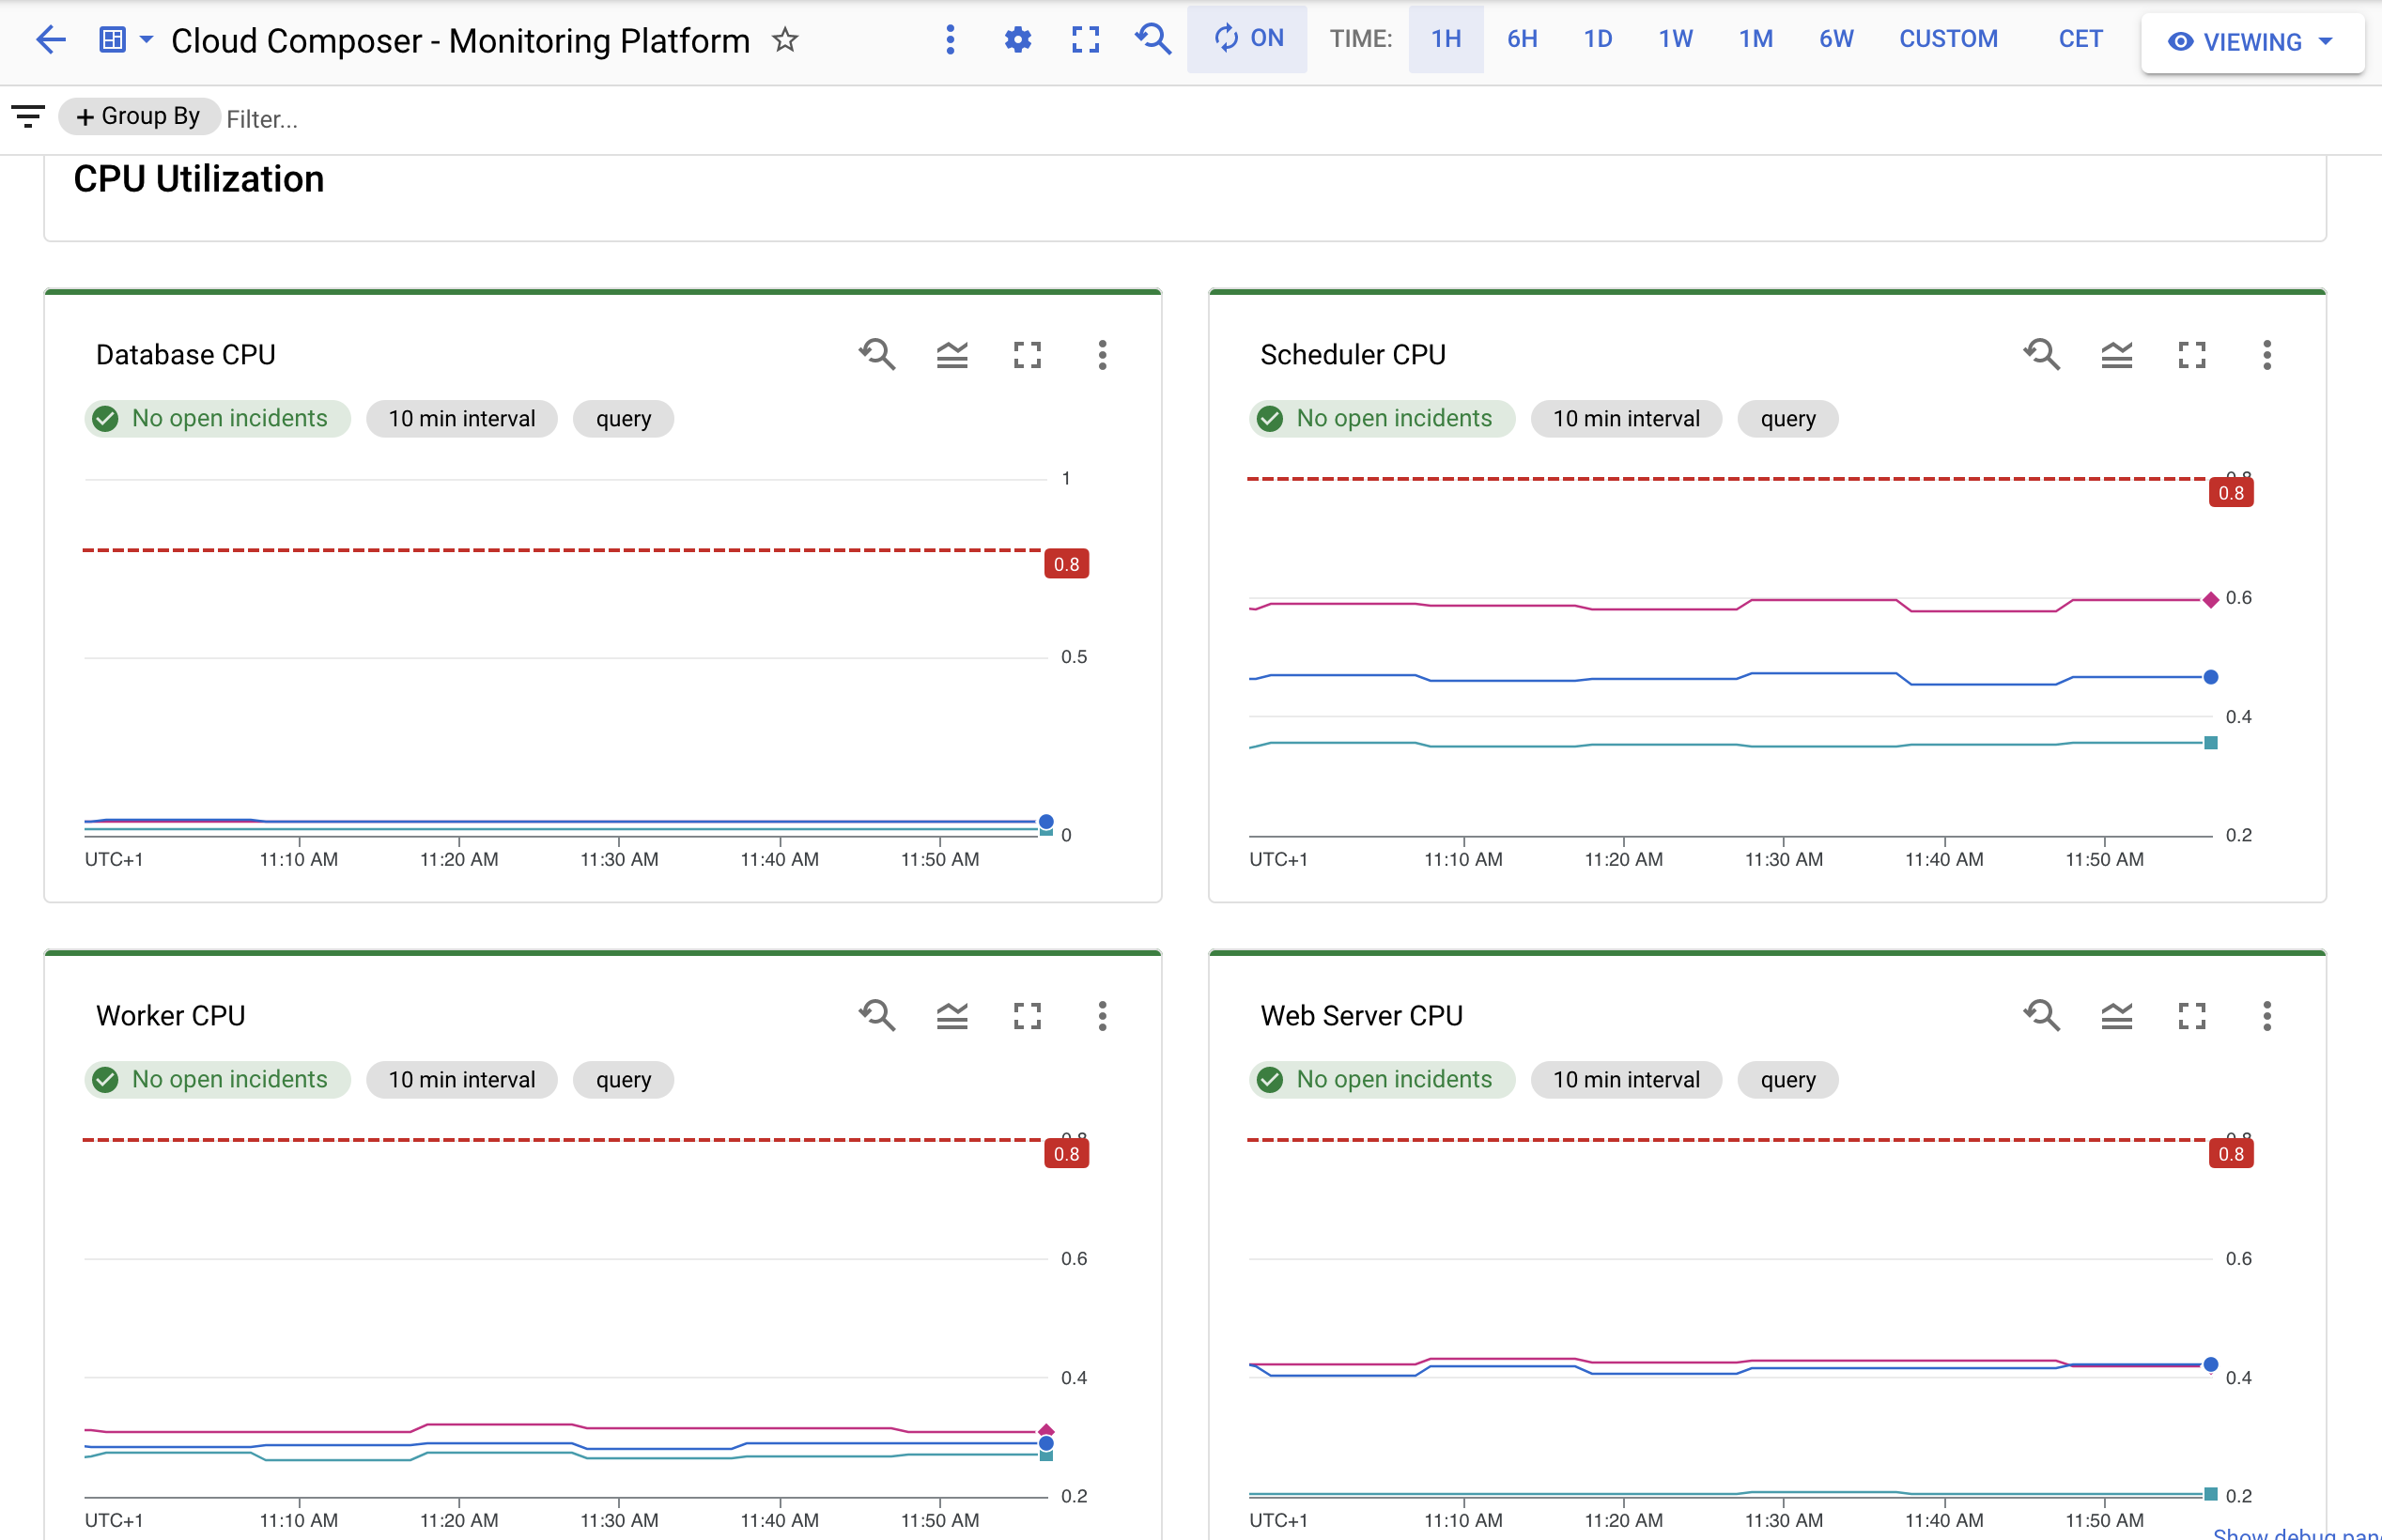
resource "google_monitoring_alert_policy" "database_cpu" {
display_name = "Database CPU"
combiner = "OR"
conditions {
display_name = "Database CPU"
condition_monitoring_query_language {
query = join("", [
"fetch cloud_composer_environment",
"| metric 'composer.googleapis.com/environment/database/cpu/utilization'",
"| group_by 10m, [value_utilization_mean: mean(value.utilization)]",
"| every 10m",
"| group_by [resource.project_id, resource.environment_name]",
"| condition val() > 0.8"])
duration = "120s"
trigger {
count = "1"
}
}
}
# uncomment to set an auto close strategy for the alert
#alert_strategy {
# auto_close = "30m"
#}
}
resource "google_monitoring_alert_policy" "scheduler_cpu" {
display_name = "Scheduler CPU"
combiner = "OR"
conditions {
display_name = "Scheduler CPU"
condition_monitoring_query_language {
query = join("", [
"fetch k8s_container",
"| metric 'kubernetes.io/container/cpu/limit_utilization'",
"| filter (resource.pod_name =~ 'airflow-scheduler-.*')",
"| group_by 10m, [value_limit_utilization_mean: mean(value.limit_utilization)]",
"| every 10m",
"| group_by [resource.cluster_name],",
" [value_limit_utilization_mean_mean: mean(value_limit_utilization_mean)]",
"| condition val() > 0.8"])
duration = "120s"
trigger {
count = "1"
}
}
}
# uncomment to set an auto close strategy for the alert
#alert_strategy {
# auto_close = "30m"
#}
}
resource "google_monitoring_alert_policy" "worker_cpu" {
display_name = "Worker CPU"
combiner = "OR"
conditions {
display_name = "Worker CPU"
condition_monitoring_query_language {
query = join("", [
"fetch k8s_container",
"| metric 'kubernetes.io/container/cpu/limit_utilization'",
"| filter (resource.pod_name =~ 'airflow-worker.*')",
"| group_by 10m, [value_limit_utilization_mean: mean(value.limit_utilization)]",
"| every 10m",
"| group_by [resource.cluster_name],",
" [value_limit_utilization_mean_mean: mean(value_limit_utilization_mean)]",
"| condition val() > 0.8"])
duration = "120s"
trigger {
count = "1"
}
}
}
# uncomment to set an auto close strategy for the alert
#alert_strategy {
# auto_close = "30m"
#}
}
resource "google_monitoring_alert_policy" "webserver_cpu" {
display_name = "Web Server CPU"
combiner = "OR"
conditions {
display_name = "Web Server CPU"
condition_monitoring_query_language {
query = join("", [
"fetch k8s_container",
"| metric 'kubernetes.io/container/cpu/limit_utilization'",
"| filter (resource.pod_name =~ 'airflow-webserver.*')",
"| group_by 10m, [value_limit_utilization_mean: mean(value.limit_utilization)]",
"| every 10m",
"| group_by [resource.cluster_name],",
" [value_limit_utilization_mean_mean: mean(value_limit_utilization_mean)]",
"| condition val() > 0.8"])
duration = "120s"
trigger {
count = "1"
}
}
}
# uncomment to set an auto close strategy for the alert
#alert_strategy {
# auto_close = "30m"
#}
}
resource "google_monitoring_alert_policy" "parsing_time" {
display_name = "DAG Parsing Time"
combiner = "OR"
conditions {
display_name = "DAG Parsing Time"
condition_monitoring_query_language {
query = join("", [
"fetch cloud_composer_environment",
"| metric 'composer.googleapis.com/environment/dag_processing/total_parse_time'",
"| group_by 5m, [value_total_parse_time_mean: mean(value.total_parse_time)]",
"| every 5m",
"| group_by [resource.project_id, resource.environment_name]",
"| condition val(0) > cast_units(30,\"s\")"])
duration = "120s"
trigger {
count = "1"
}
}
}
# uncomment to set an auto close strategy for the alert
#alert_strategy {
# auto_close = "30m"
#}
}
resource "google_monitoring_alert_policy" "database_memory" {
display_name = "Database Memory"
combiner = "OR"
conditions {
display_name = "Database Memory"
condition_monitoring_query_language {
query = join("", [
"fetch cloud_composer_environment",
"| metric 'composer.googleapis.com/environment/database/memory/utilization'",
"| group_by 10m, [value_utilization_mean: mean(value.utilization)]",
"| every 10m",
"| group_by [resource.project_id, resource.environment_name]",
"| condition val() > 0.8"])
duration = "0s"
trigger {
count = "1"
}
}
}
# uncomment to set an auto close strategy for the alert
#alert_strategy {
# auto_close = "30m"
#}
}
resource "google_monitoring_alert_policy" "scheduler_memory" {
display_name = "Scheduler Memory"
combiner = "OR"
conditions {
display_name = "Scheduler Memory"
condition_monitoring_query_language {
query = join("", [
"fetch k8s_container",
"| metric 'kubernetes.io/container/memory/limit_utilization'",
"| filter (resource.pod_name =~ 'airflow-scheduler-.*')",
"| group_by 10m, [value_limit_utilization_mean: mean(value.limit_utilization)]",
"| every 10m",
"| group_by [resource.cluster_name],",
" [value_limit_utilization_mean_mean: mean(value_limit_utilization_mean)]",
"| condition val() > 0.8"])
duration = "0s"
trigger {
count = "1"
}
}
}
documentation {
content = join("", [
"Scheduler Memory exceeds a threshold, summed across all schedulers in the environment. ",
"Add more schedulers OR increase scheduler's memory OR reduce scheduling load (e.g. through lower parsing frequency or lower number of DAGs/tasks running"])
}
# uncomment to set an auto close strategy for the alert
#alert_strategy {
# auto_close = "30m"
#}
}
resource "google_monitoring_alert_policy" "worker_memory" {
display_name = "Worker Memory"
combiner = "OR"
conditions {
display_name = "Worker Memory"
condition_monitoring_query_language {
query = join("", [
"fetch k8s_container",
"| metric 'kubernetes.io/container/memory/limit_utilization'",
"| filter (resource.pod_name =~ 'airflow-worker.*')",
"| group_by 10m, [value_limit_utilization_mean: mean(value.limit_utilization)]",
"| every 10m",
"| group_by [resource.cluster_name],",
" [value_limit_utilization_mean_mean: mean(value_limit_utilization_mean)]",
"| condition val() > 0.8"])
duration = "0s"
trigger {
count = "1"
}
}
}
# uncomment to set an auto close strategy for the alert
#alert_strategy {
# auto_close = "30m"
#}
}
resource "google_monitoring_alert_policy" "webserver_memory" {
display_name = "Web Server Memory"
combiner = "OR"
conditions {
display_name = "Web Server Memory"
condition_monitoring_query_language {
query = join("", [
"fetch k8s_container",
"| metric 'kubernetes.io/container/memory/limit_utilization'",
"| filter (resource.pod_name =~ 'airflow-webserver.*')",
"| group_by 10m, [value_limit_utilization_mean: mean(value.limit_utilization)]",
"| every 10m",
"| group_by [resource.cluster_name],",
" [value_limit_utilization_mean_mean: mean(value_limit_utilization_mean)]",
"| condition val() > 0.8"])
duration = "0s"
trigger {
count = "1"
}
}
}
# uncomment to set an auto close strategy for the alert
#alert_strategy {
# auto_close = "30m"
#}
}
resource "google_monitoring_alert_policy" "scheduled_tasks_percentage" {
display_name = "Scheduled Tasks Percentage"
combiner = "OR"
conditions {
display_name = "Scheduled Tasks Percentage"
condition_monitoring_query_language {
query = join("", [
"fetch cloud_composer_environment",
"| metric 'composer.googleapis.com/environment/unfinished_task_instances'",
"| align mean_aligner(10m)",
"| every(10m)",
"| window(10m)",
"| filter_ratio_by [resource.project_id, resource.environment_name], metric.state = 'scheduled'",
"| condition val() > 0.80"])
duration = "300s"
trigger {
count = "1"
}
}
}
# uncomment to set an auto close strategy for the alert
#alert_strategy {
# auto_close = "30m"
#}
}
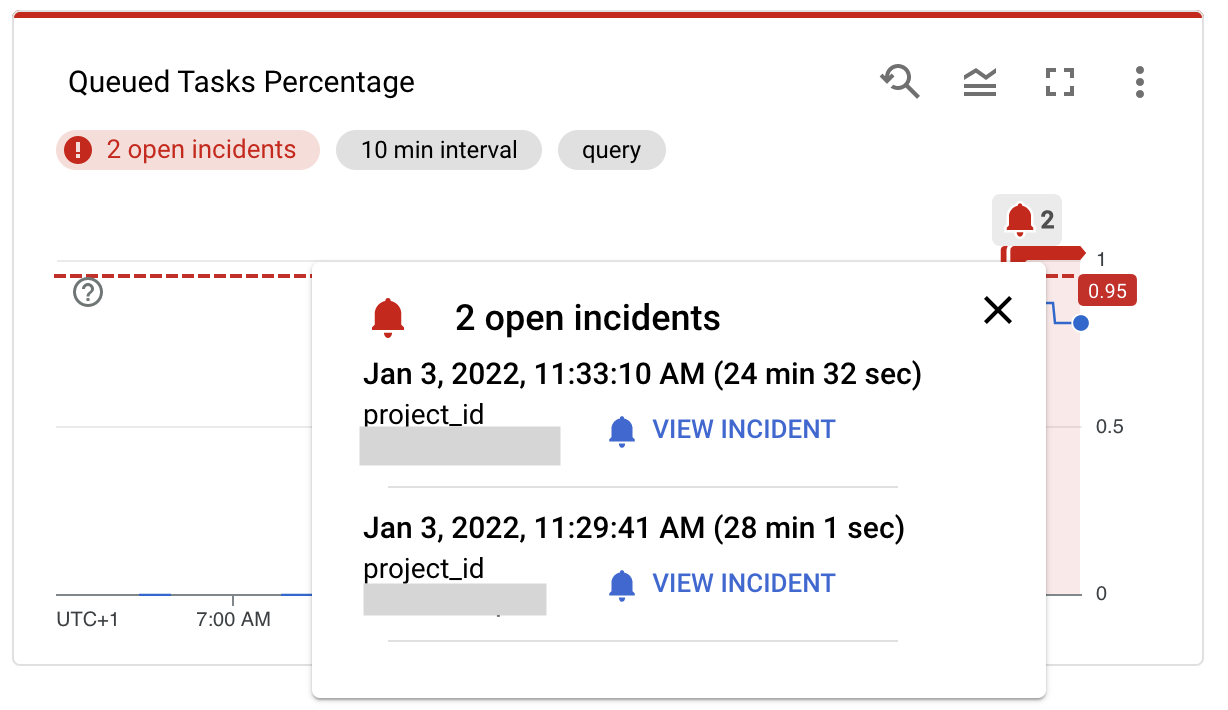
resource "google_monitoring_alert_policy" "queued_tasks_percentage" {
display_name = "Queued Tasks Percentage"
combiner = "OR"
conditions {
display_name = "Queued Tasks Percentage"
condition_monitoring_query_language {
query = join("", [
"fetch cloud_composer_environment",
"| metric 'composer.googleapis.com/environment/unfinished_task_instances'",
"| align mean_aligner(10m)",
"| every(10m)",
"| window(10m)",
"| filter_ratio_by [resource.project_id, resource.environment_name], metric.state = 'queued'",
"| group_by [resource.project_id, resource.environment_name]",
"| condition val() > 0.95"])
duration = "300s"
trigger {
count = "1"
}
}
}
# uncomment to set an auto close strategy for the alert
#alert_strategy {
# auto_close = "30m"
#}
}
resource "google_monitoring_alert_policy" "queued_or_scheduled_tasks_percentage" {
display_name = "Queued or Scheduled Tasks Percentage"
combiner = "OR"
conditions {
display_name = "Queued or Scheduled Tasks Percentage"
condition_monitoring_query_language {
query = join("", [
"fetch cloud_composer_environment",
"| metric 'composer.googleapis.com/environment/unfinished_task_instances'",
"| align mean_aligner(10m)",
"| every(10m)",
"| window(10m)",
"| filter_ratio_by [resource.project_id, resource.environment_name], or(metric.state = 'queued', metric.state = 'scheduled' )",
"| group_by [resource.project_id, resource.environment_name]",
"| condition val() > 0.80"])
duration = "120s"
trigger {
count = "1"
}
}
}
# uncomment to set an auto close strategy for the alert
#alert_strategy {
# auto_close = "30m"
#}
}
resource "google_monitoring_alert_policy" "workers_above_minimum" {
display_name = "Workers above minimum (negative = missing workers)"
combiner = "OR"
conditions {
display_name = "Workers above minimum"
condition_monitoring_query_language {
query = join("", [
"fetch cloud_composer_environment",
"| { metric 'composer.googleapis.com/environment/num_celery_workers'",
"| group_by 5m, [value_num_celery_workers_mean: mean(value.num_celery_workers)]",
"| every 5m",
"; metric 'composer.googleapis.com/environment/worker/min_workers'",
"| group_by 5m, [value_min_workers_mean: mean(value.min_workers)]",
"| every 5m }",
"| outer_join 0",
"| sub",
"| group_by [resource.project_id, resource.environment_name]",
"| condition val() < 0"])
duration = "0s"
trigger {
count = "1"
}
}
}
# uncomment to set an auto close strategy for the alert
#alert_strategy {
# auto_close = "30m"
#}
}
resource "google_monitoring_alert_policy" "pod_evictions" {
display_name = "Worker pod evictions"
combiner = "OR"
conditions {
display_name = "Worker pod evictions"
condition_monitoring_query_language {
query = join("", [
"fetch cloud_composer_environment",
"| metric 'composer.googleapis.com/environment/worker/pod_eviction_count'",
"| align delta(1m)",
"| every 1m",
"| group_by [resource.project_id, resource.environment_name]",
"| condition val() > 0"])
duration = "60s"
trigger {
count = "1"
}
}
}
# uncomment to set an auto close strategy for the alert
#alert_strategy {
# auto_close = "30m"
#}
}
resource "google_monitoring_alert_policy" "scheduler_errors" {
display_name = "Scheduler Errors"
combiner = "OR"
conditions {
display_name = "Scheduler Errors"
condition_monitoring_query_language {
query = join("", [
"fetch cloud_composer_environment",
"| metric 'logging.googleapis.com/log_entry_count'",
"| filter (metric.log == 'airflow-scheduler' && metric.severity == 'ERROR')",
"| group_by 5m,",
" [value_log_entry_count_aggregate: aggregate(value.log_entry_count)]",
"| every 5m",
"| group_by [resource.project_id, resource.environment_name],",
" [value_log_entry_count_aggregate_max: max(value_log_entry_count_aggregate)]",
"| condition val() > 50"])
duration = "300s"
trigger {
count = "1"
}
}
}
# uncomment to set an auto close strategy for the alert
#alert_strategy {
# auto_close = "30m"
#}
}
resource "google_monitoring_alert_policy" "worker_errors" {
display_name = "Worker Errors"
combiner = "OR"
conditions {
display_name = "Worker Errors"
condition_monitoring_query_language {
query = join("", [
"fetch cloud_composer_environment",
"| metric 'logging.googleapis.com/log_entry_count'",
"| filter (metric.log == 'airflow-worker' && metric.severity == 'ERROR')",
"| group_by 5m,",
" [value_log_entry_count_aggregate: aggregate(value.log_entry_count)]",
"| every 5m",
"| group_by [resource.project_id, resource.environment_name],",
" [value_log_entry_count_aggregate_max: max(value_log_entry_count_aggregate)]",
"| condition val() > 50"])
duration = "300s"
trigger {
count = "1"
}
}
}
# uncomment to set an auto close strategy for the alert
#alert_strategy {
# auto_close = "30m"
#}
}
resource "google_monitoring_alert_policy" "webserver_errors" {
display_name = "Web Server Errors"
combiner = "OR"
conditions {
display_name = "Web Server Errors"
condition_monitoring_query_language {
query = join("", [
"fetch cloud_composer_environment",
"| metric 'logging.googleapis.com/log_entry_count'",
"| filter (metric.log == 'airflow-webserver' && metric.severity == 'ERROR')",
"| group_by 5m,",
" [value_log_entry_count_aggregate: aggregate(value.log_entry_count)]",
"| every 5m",
"| group_by [resource.project_id, resource.environment_name],",
" [value_log_entry_count_aggregate_max: max(value_log_entry_count_aggregate)]",
"| condition val() > 50"])
duration = "300s"
trigger {
count = "1"
}
}
}
# uncomment to set an auto close strategy for the alert
#alert_strategy {
# auto_close = "30m"
#}
}
resource "google_monitoring_alert_policy" "other_errors" {
display_name = "Other Errors"
combiner = "OR"
conditions {
display_name = "Other Errors"
condition_monitoring_query_language {
query = join("", [
"fetch cloud_composer_environment",
"| metric 'logging.googleapis.com/log_entry_count'",
"| filter",
" (metric.log !~ 'airflow-scheduler|airflow-worker|airflow-webserver'",
" && metric.severity == 'ERROR')",
"| group_by 5m, [value_log_entry_count_max: max(value.log_entry_count)]",
"| every 5m",
"| group_by [resource.project_id, resource.environment_name],",
" [value_log_entry_count_max_aggregate: aggregate(value_log_entry_count_max)]",
"| condition val() > 10"])
duration = "300s"
trigger {
count = "1"
}
}
}
# uncomment to set an auto close strategy for the alert
#alert_strategy {
# auto_close = "30m"
#}
}
#######################################################
#
# Create Monitoring Dashboard
#
########################################################
resource "google_monitoring_dashboard" "Composer_Dashboard" {
dashboard_json = <<EOF
{
"category": "CUSTOM",
"displayName": "Cloud Composer - Monitoring Platform",
"mosaicLayout": {
"columns": 12,
"tiles": [
{
"height": 1,
"widget": {
"text": {
"content": "",
"format": "MARKDOWN"
},
"title": "Health"
},
"width": 12,
"xPos": 0,
"yPos": 0
},
{
"height": 4,
"widget": {
"alertChart": {
"name": "${google_monitoring_alert_policy.environment_health.name}"
}
},
"width": 6,
"xPos": 0,
"yPos": 1
},
{
"height": 4,
"widget": {
"alertChart": {
"name": "${google_monitoring_alert_policy.database_health.name}"
}
},
"width": 6,
"xPos": 6,
"yPos": 1
},
{
"height": 4,
"widget": {
"alertChart": {
"name": "${google_monitoring_alert_policy.webserver_health.name}"
}
},
"width": 6,
"xPos": 0,
"yPos": 5
},
{
"height": 4,
"widget": {
"alertChart": {
"name": "${google_monitoring_alert_policy.scheduler_heartbeat.name}"
}
},
"width": 6,
"xPos": 6,
"yPos": 5
},
{
"height": 1,
"widget": {
"text": {
"content": "",
"format": "RAW"
},
"title": "Airflow Task Execution and DAG Parsing"
},
"width": 12,
"xPos": 0,
"yPos": 9
},
{
"height": 4,
"widget": {
"alertChart": {
"name": "${google_monitoring_alert_policy.scheduled_tasks_percentage.name}"
}
},
"width": 6,
"xPos": 0,
"yPos": 10
},
{
"height": 4,
"widget": {
"alertChart": {
"name": "${google_monitoring_alert_policy.queued_tasks_percentage.name}"
}
},
"width": 6,
"xPos": 6,
"yPos": 10
},
{
"height": 4,
"widget": {
"alertChart": {
"name": "${google_monitoring_alert_policy.queued_or_scheduled_tasks_percentage.name}"
}
},
"width": 6,
"xPos": 0,
"yPos": 14
},
{
"height": 4,
"widget": {
"alertChart": {
"name": "${google_monitoring_alert_policy.parsing_time.name}"
}
},
"width": 6,
"xPos": 6,
"yPos": 14
},
{
"height": 1,
"widget": {
"text": {
"content": "",
"format": "RAW"
},
"title": "Workers presence"
},
"width": 12,
"xPos": 0,
"yPos": 18
},
{
"height": 4,
"widget": {
"alertChart": {
"name": "${google_monitoring_alert_policy.workers_above_minimum.name}"
}
},
"width": 6,
"xPos": 0,
"yPos": 19
},
{
"height": 4,
"widget": {
"alertChart": {
"name": "${google_monitoring_alert_policy.pod_evictions.name}"
}
},
"width": 6,
"xPos": 6,
"yPos": 19
},
{
"height": 1,
"widget": {
"text": {
"content": "",
"format": "RAW"
},
"title": "CPU Utilization"
},
"width": 12,
"xPos": 0,
"yPos": 23
},
{
"height": 4,
"widget": {
"alertChart": {
"name": "${google_monitoring_alert_policy.database_cpu.name}"
}
},
"width": 6,
"xPos": 0,
"yPos": 24
},
{
"height": 4,
"widget": {
"alertChart": {
"name": "${google_monitoring_alert_policy.scheduler_cpu.name}"
}
},
"width": 6,
"xPos": 6,
"yPos": 24
},
{
"height": 4,
"widget": {
"alertChart": {
"name": "${google_monitoring_alert_policy.worker_cpu.name}"
}
},
"width": 6,
"xPos": 0,
"yPos": 28
},
{
"height": 4,
"widget": {
"alertChart": {
"name": "${google_monitoring_alert_policy.webserver_cpu.name}"
}
},
"width": 6,
"xPos": 6,
"yPos": 28
},
{
"height": 1,
"widget": {
"text": {
"content": "",
"format": "RAW"
},
"title": "Memory Utilization"
},
"width": 12,
"xPos": 0,
"yPos": 32
},
{
"height": 4,
"widget": {
"alertChart": {
"name": "${google_monitoring_alert_policy.database_memory.name}"
}
},
"width": 6,
"xPos": 0,
"yPos": 33
},
{
"height": 4,
"widget": {
"alertChart": {
"name": "${google_monitoring_alert_policy.scheduler_memory.name}"
}
},
"width": 6,
"xPos": 6,
"yPos": 33
},
{
"height": 4,
"widget": {
"alertChart": {
"name": "${google_monitoring_alert_policy.worker_memory.name}"
}
},
"width": 6,
"xPos": 0,
"yPos": 37
},
{
"height": 4,
"widget": {
"alertChart": {
"name": "${google_monitoring_alert_policy.webserver_memory.name}"
}
},
"width": 6,
"xPos": 6,
"yPos": 37
},
{
"height": 1,
"widget": {
"text": {
"content": "",
"format": "RAW"
},
"title": "Airflow component errors"
},
"width": 12,
"xPos": 0,
"yPos": 41
},
{
"height": 4,
"widget": {
"alertChart": {
"name": "${google_monitoring_alert_policy.scheduler_errors.name}"
}
},
"width": 6,
"xPos": 0,
"yPos": 42
},
{
"height": 4,
"widget": {
"alertChart": {
"name": "${google_monitoring_alert_policy.worker_errors.name}"
}
},
"width": 6,
"xPos": 6,
"yPos": 42
},
{
"height": 4,
"widget": {
"alertChart": {
"name": "${google_monitoring_alert_policy.webserver_errors.name}"
}
},
"width": 6,
"xPos": 0,
"yPos": 48
},
{
"height": 4,
"widget": {
"alertChart": {
"name": "${google_monitoring_alert_policy.other_errors.name}"
}
},
"width": 6,
"xPos": 6,
"yPos": 48
},
{
"height": 1,
"widget": {
"text": {
"content": "",
"format": "RAW"
},
"title": "Task errors"
},
"width": 12,
"xPos": 0,
"yPos": 52
}
]
}
}
EOF
}