本文档介绍了可用于从 Compute Engine 上的 Prometheus 收集指标的 Ops Agent 指标接收器的配置和使用。本文档还介绍了可用于试用接收器的示例。
Google Kubernetes Engine 的用户能够通过使用 Google Cloud Managed Service for Prometheus 收集 Prometheus 指标。Ops Agent Prometheus 接收器为 Compute Engine 用户提供了相同的功能。
您可以使用 Cloud Monitoring 提供的所有工具(包括 PromQL)来查看和分析 Prometheus 接收器收集的数据。例如,您可以使用 Metrics Explorer(如适用于 Monitoring 的Google Cloud 控制台中所述)来查询数据。您还可以创建 Cloud Monitoring 信息中心和提醒政策来监控 Prometheus 指标。我们建议您使用 PromQL 作为 Prometheus 指标的查询语言。
您还可以在 Cloud Monitoring 之外的界面(例如 Prometheus 界面和 Grafana)中查看 Prometheus 指标。
选择正确的接收器
在决定使用 Prometheus 接收器之前,请确定是否已有适用于您使用的应用的 Ops Agent 集成。如需了解与 Ops Agent 的现有集成,请参阅监控第三方应用。如果已有集成,我们建议使用它。如需了解详情,请参阅选择现有集成。
如果满足以下条件,我们建议使用 Ops Agent Prometheus 接收器:
您具有使用 Prometheus 的经验,依靠 Prometheus 标准,并了解爬取间隔和基数等因素如何影响您的费用。如需了解详情,请参阅选择 Prometheus 接收器。
您监控的软件尚不属于现有 Ops Agent 集成集。
现有集成
Ops Agent 为许多第三方应用提供了集成。这些集成为您提供了以下各项:
- 适用于应用的选定
workload.googleapis.com指标集 - 用于直观呈现指标的信息中心。
使用现有集成注入的指标将按代理收集的指标的字节数计费。如需了解此价格,请参阅按注入的字节数计费的指标。指标的数量和类型是事先已知的,您可以使用该信息来估算费用。
例如,如果您使用的是 Apache Web Server (httpd) 集成,Ops Agent 会收集五个标量指标;每个数据点计为 8 个字节。如果 Ops Agent 默认采样频率为 60 秒,则每天注入的字节数为 57,600 * 主机数:
- 8(字节)* 1440(每天分钟数)* 5(指标)* n(主机)或
- 57,600 * n(主机)
如需详细了解如何估算费用,请参阅基于注入的字节数的价格示例。
Prometheus 接收器
使用 Ops Agent 收集 Prometheus 指标时,以下规则适用:
您的应用发出的指标数量和基数由您控制。没有一组特选指标。您注入的数据量取决于您的 Prometheus 应用和 Ops Agent Prometheus 接收器的配置。
指标将作为
prometheus.googleapis.com指标注入到 Cloud Monitoring 中。这些指标在注入到 Cloud Monitoring 时被分类为“自定义”指标类型,并且受自定义指标的配额和限制的约束。您必须根据所注入的指标集和业务需求设计和创建所需的任何 Cloud Monitoring 信息中心。如需了解如何创建信息中心,请参阅信息中心和图表。
指标注入的价格取决于按所注入样本数计费的指标的数量。如需估算使用 Prometheus 接收器时的费用,您需要确定您在结算周期内可能收集的样本数量。估算基于以下因素:
- 标量指标的数量;每个值都是一个样本
- 分布指标的数量;每个直方图计为(2 + 直方图中的存储桶数)个样本
- 每个指标的采样频率
- 在其中对指标进行采样的主机数量
如需详细了解如何计算样本数量和估算费用,请参阅基于样本注入数量的价格示例。
前提条件
如需使用 Prometheus 接收器收集 Prometheus 指标,您必须安装 Ops Agent 2.25.0 或更高版本。
Ops Agent 接收器需要使用发出 Prometheus 指标的端点。因此,您的应用必须直接提供此类端点,或者使用 Prometheus 库或导出器公开端点。许多库和语言框架(例如 Spring 和 DropWizard)或发出非 Prometheus 指标的应用(例如 StatsD、DogStatsD 和 Graphite)可以使用 Prometheus 客户端库或导出器发出 Prometheus 样式的指标。例如,如需发出 Prometheus 指标:
- Spring 用户可以使用 Spring Metrics 库。
- StatsD 用户可以使用
statsd_exporter软件包。 - Graphite 用户可以使用
graphite_exporter软件包。
当应用直接或通过使用库或导出器发出 Prometheus 指标后,该指标可以由配置了 Prometheus 接收器的 Ops Agent 进行收集。
配置 Ops Agent
Ops Agent 配置模型通常涉及定义以下各项:
- 接收器,用于确定收集哪些指标。
- 处理器:描述 Ops Agent 如何修改指标。
- 流水线,用于将接收器和处理器连接为一项服务。
用于注入 Prometheus 指标的配置略有不同:不涉及处理器。
Prometheus 指标配置
配置 Ops Agent 以注入 Prometheus 指标与常规配置不同,如下所示:
您无需为 Prometheus 指标创建 Ops Agent 处理器。Prometheus 接收器支持 Prometheus
scrape_config规范指定的几乎所有配置选项,包括重新添加标签选项。任何指标处理都使用爬取配置的
relabel_configs和metric_relabel_configs部分完成(如 Prometheus 接收器中所述),而不是使用 Ops Agent 处理器。如需了解详情,请参阅“重新添加标签:修改正在爬取的数据”。您只能根据 Prometheus 接收器定义 Prometheus 流水线。您未指定任何处理器。您也无法在流水线中使用任何非 Prometheus 接收器来收集 Prometheus 指标。
该接收器的大部分配置是爬取配置选项的规范。为简洁起见,省略这些选项,下面展示了使用 Prometheus 接收器的 Ops Agent 配置的结构。您可以指定 RECEIVER_ID 和 PIPELINE_ID 的值。
metrics:
  receivers:
    RECEIVER_ID:
      type: prometheus
      config:
        scrape_configs:
          [... omitted for brevity ...]

  service:
    pipelines:
      PIPELINE_ID:
        receivers: [RECEIVER_ID]
以下部分更详细地介绍了 Prometheus 接收器。如需查看接收器和流水线的功能示例,请参阅添加 Ops Agent 接收器和流水线。
Prometheus 接收器
如需为 Prometheus 指标指定接收器,请创建 prometheus 类型的指标接收器,并指定一组 scrape_config 选项。该接收器支持所有 Prometheus scrape_config 选项,但以下各项除外:
- 服务发现部分
*_sd_config。 honor_labels设置。
因此,您可以复制现有的爬取配置,并将其用于 Ops Agent,只需少量修改或无需任何修改。
Prometheus 接收器的完整结构如下所示:
metrics:
  receivers:
    prom_application:
      type: prometheus
      config:
        scrape_configs:
          - job_name: 'STRING' # must be unique across all Prometheus receivers
            scrape_interval: # duration, like 10m or 15s
            scrape_timeout:  # duration, like 10m or 15s
            metrics_path: # resource path for metrics, default = /metrics
            honor_timestamps: # boolean, default = false
            scheme: # http or https, default = http
            params:
              - STRING: STRING
            basic_auth:
              username: STRING
              password: SECRET
              password_file: STRING
            authorization:
              type: STRING # default = Bearer
              credentials: SECRET
              credentials_file: FILENAME

            oauth2: OAUTH2 # See Prometheus oauth2
            follow_redirects: # boolean, default = true
            enable_http2: # boolean, default = true
            tls_config: TLS_CONFIG # See Prometheus tls_config
            proxy_url: STRING

            static_configs:
              STATIC_CONFIG # See Prometheus static_config
            relabel_configs:
              RELABEL_CONFIG # See Prometheus relabel_config
            metric_relabel_configs:
              METRIC_RELABEL_CONFIGS # See Prometheus metric_relabel_configs
如需查看重新添加标签配置的示例,请参阅其他接收器配置。
示例:为 Prometheus 配置 Ops Agent
本部分展示了如何配置 Ops Agent 以从应用中收集 Prometheus 指标的示例。此示例使用 Prometheus 社区提供的 JSON 导出器 (json_exporter),该导出器会在端口 7979 上公开 Prometheus 指标。
设置该示例需要以下资源,您可能需要安装这些资源:
gitcurlmakepython3- Go 语言,1.19 版或更高版本
创建或配置应用
如需获取并运行 JSON 导出器,请按照以下步骤操作:
通过运行以下命令克隆
json_exporter仓库并签出导出器:git clone https://github.com/prometheus-community/json_exporter.git cd json_exporter git checkout v0.5.0
通过运行以下命令来构建导出器:
make build
通过运行以下命令来启动 Python HTTP 服务器:
python3 -m http.server 8000 &
通过运行以下命令启动 JSON 导出器:
./json_exporter --config.file examples/config.yml &
查询 JSON 导出器以验证其是否正在运行并在端口 7979 上公开指标:
curl "http://localhost:7979/probe?module=default&target=http://localhost:8000/examples/data.json"
如果查询成功,您会看到类似于以下内容的输出:
# HELP example_global_value Example of a top-level global value scrape in the json
# TYPE example_global_value untyped
example_global_value{environment="beta",location="planet-mars"} 1234
# HELP example_value_active Example of sub-level value scrapes from a json
# TYPE example_value_active untyped
example_value_active{environment="beta",id="id-A"} 1
example_value_active{environment="beta",id="id-C"} 1
# HELP example_value_boolean Example of sub-level value scrapes from a json
# TYPE example_value_boolean untyped
example_value_boolean{environment="beta",id="id-A"} 1
example_value_boolean{environment="beta",id="id-C"} 0
# HELP example_value_count Example of sub-level value scrapes from a json
# TYPE example_value_count untyped
example_value_count{environment="beta",id="id-A"} 1
example_value_count{environment="beta",id="id-C"} 3
在此输出中,类似
example_value_active的字符串是指标名称,并使用大括号括起标签和值。数据值遵循标签集。
添加 Ops Agent 接收器和流水线
如需将 Ops Agent 配置为从 JSON 导出器应用注入指标,您必须修改代理的配置以添加 Prometheus 接收器和流水线。对于 JSON 导出器示例,请按照以下步骤操作:
修改 Ops Agent 配置文件
/etc/google-cloud-ops-agent/config.yaml,并添加以下 Prometheus 接收器和流水线条目:metrics: receivers: prometheus: type: prometheus config: scrape_configs: - job_name: 'json_exporter' scrape_interval: 10s metrics_path: /probe params: module: [default] target: [http://localhost:8000/examples/data.json] static_configs: - targets: ['localhost:7979'] service: pipelines: prometheus_pipeline: receivers: - prometheus如果此文件中已有其他配置条目,请将 Prometheus 接收器和流水线添加到现有
metrics和service条目。如需了解详情,请参阅指标配置。如需查看接收器中重新添加标签配置的示例,请参阅其他接收器配置。
重启 Ops Agent
如需应用配置更改,您必须重启 Ops Agent。
LINUX
要重启代理,请在您的实例上运行以下命令:
sudo service google-cloud-ops-agent restart
如需确认代理已重启,请运行以下命令并验证“Metrics Agent”和“Logging Agent”组件是否已启动:
sudo systemctl status google-cloud-ops-agent"*"
Windows
使用 RDP 或类似工具连接到您的实例,然后登录到 Windows。
右键点击 PowerShell 图标并选择以管理员身份运行,以管理员权限打开 PowerShell 终端。
如需重启代理,请运行以下 PowerShell 命令:
Restart-Service google-cloud-ops-agent -Force
如需确认代理已重启,请运行以下命令并验证“Metrics Agent”和“Logging Agent”组件是否已启动:
Get-Service google-cloud-ops-agent*
Cloud Monitoring 中的 Prometheus 指标
您可以将 Cloud Monitoring 提供的工具与 Prometheus 接收器收集的数据搭配使用。例如,您可以使用 Metrics Explorer 绘制数据图表(如适用于 Monitoring 的Google Cloud 控制台中所述)。以下部分介绍了使用 Metrics Explorer 的 Cloud Monitoring 中提供的查询工具:
您可以为指标创建 Cloud Monitoring 信息中心和提醒政策。如需了解信息中心以及您可以使用的图表类型,请参阅信息中心和图表。如需了解提醒政策,请参阅使用提醒政策。
您还可以在其他界面(例如 Prometheus 界面和 Grafana)中查看指标。如需了解如何设置这些界面,请参阅 Google Cloud Managed Service for Prometheus 文档中的以下部分:
使用 PromQL
对于使用 Prometheus 接收器注入的指标,建议使用 PromQL 作为查询语言。
如需验证是否在注入 Prometheus 数据,较简单的方法是使用 Google Cloud 控制台中的 Cloud Monitoring Metrics Explorer 页面:
-
在 Google Cloud 控制台中,前往 leaderboard Metrics Explorer 页面:
如果您使用搜索栏查找此页面,请选择子标题为监控的结果。
在查询构建器窗格的工具栏中,选择名为 code MQL 或 code PromQL 的按钮。
验证已在PromQL 切换开关中选择 PromQL。语言切换开关位于同一工具栏中,用于设置查询的格式。
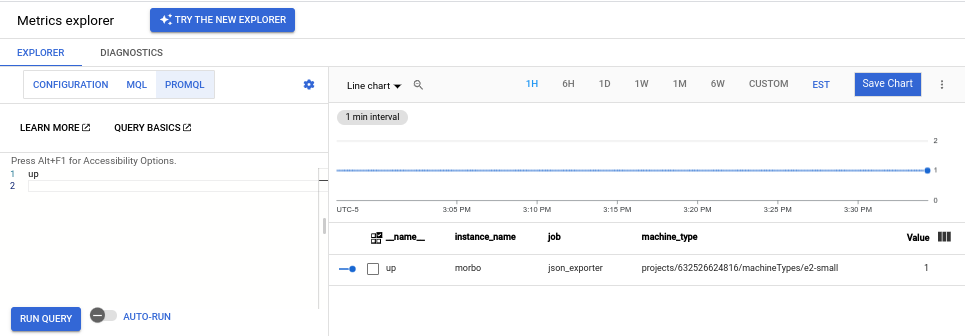
在编辑器中输入以下查询,然后点击运行查询:
up
如果系统正在注入您的数据,您会看到如下所示的图表:
如果您运行的是 JSON 导出器示例,则还可以发出如下所示的查询:
按名称查询已导出的特定指标的所有数据,例如:
example_value_count
下面展示了
example_value_count的图表,其中包括 JSON 导出器应用定义的标签以及 Ops Agent 添加的标签: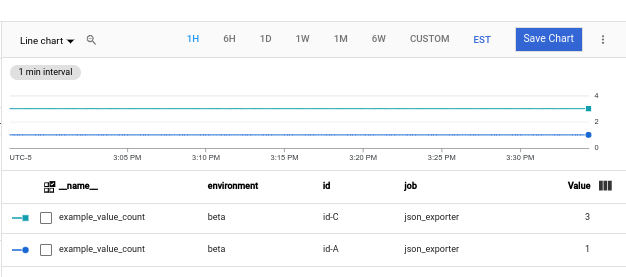
查询源自特定命名空间的已导出指标的数据。
namespace标签的值是分配给虚拟机的 Compute Engine 实例 ID(一长串数字,例如5671897148133813325)。查询如下所示:example_value_count{namespace="INSTANCE_ID"}查询与特定正则表达式匹配的数据。JSON 导出器会发出标签为
id且具有id-A、id-B、id-C等值的指标。如需过滤具有与此模式匹配的id标签的任何指标,请使用以下查询:example_value_count{id=~"id.*"}
如需详细了解如何在 Metrics Explorer 和 Cloud Monitoring 图表中使用 PromQL,请参阅 Cloud Monitoring 中的 PromQL。
在 Cloud Monitoring 中查看指标使用情况和诊断信息
Cloud Monitoring 指标管理页面提供的信息可帮助您控制在收费指标上支出的金额,而不会影响可观测性。指标管理页面报告以下信息:
- 针对指标网域中基于字节和基于样本的结算以及各个指标的注入量。
- 有关标签和指标基数的数据。
- 每个指标的读取次数。
- 指标在提醒政策和自定义信息中心内的使用。
- 指标写入错误率。
您还可以使用指标管理来排除不需要的指标,从而免除注入这些指标的费用。
如需查看指标管理页面,请执行以下操作:
-
在 Google Cloud 控制台中,前往 指标管理页面:
如果您使用搜索栏查找此页面,请选择子标题为监控的结果。
- 在工具栏中,选择时间窗口。默认情况下,指标管理页面会显示有关前一天收集的指标的信息。
如需详细了解指标管理页面,请参阅查看和管理指标使用情况。
重新添加标签:修改正在爬取的数据
在重新爬取目标之前,您可以使用重新添加标签修改爬取目标的标签集或其指标。如果您在重新添加标签配置中有多个步骤,则这些步骤会按照它们在配置文件中出现的顺序进行应用。
Ops Agent 会创建一组元标签(以字符串 __meta_ 为前缀的标签)。这些元标签会记录运行 Ops Agent 的 Compute Engine 实例的相关信息。以 __ 字符串为前缀的标签(包括元标签)仅在重新添加标签期间可用。您可以使用重新添加标签在爬取的标签中捕获这些标签的值。
指标重新添加标签适用于样本;它是注入前的最后一步。您可以使用指标重新添加标签来删除不需要注入的时序;删除这些时序可以减少注入的样本数量,从而降低费用。
如需详细了解如何重新添加标签,请参阅 relabel_config 和 metric_relabel_configs 的 Prometheus 文档。
重新添加标签期间可用的 Compute Engine 元标签
Ops Agent 爬取指标时,包含一组元标签,这些标签的值基于运行代理的 Compute Engine 虚拟机的配置。您可以使用这些标签和 Prometheus 接收器的 relabel_configs 部分,向从中注入它们的虚拟机添加额外的元数据。如需查看示例,请参阅其他接收器配置。
目标提供了以下元标签,供您在 relabel_configs 部分中使用:
__meta_gce_instance_id:Compute Engine 实例(本地)的数字 ID__meta_gce_instance_name:Compute Engine 实例(本地)的名称;Ops Agent 会自动将此值放置在指标的可变instance_name标签中。__meta_gce_machine_type:实例的机器类型的完整或部分网址;Ops Agent 会自动将此值放置在指标的可变machine_type标签中。__meta_gce_metadata_NAME:实例的每个元数据项__meta_gce_network:实例的网址__meta_gce_private_ip:实例的专用 IP 地址__meta_gce_interface_ipv4_NAME:每个命名接口的 IPv4 地址__meta_gce_project:实例在其中运行的 Google Cloud 项目(本地)__meta_gce_public_ip:实例的公共 IP 地址(如果存在)__meta_gce_tags:实例标记的英文逗号分隔列表__meta_gce_zone:实例在其中运行的 Compute Engine 可用区的网址
这些标签的值在 Ops Agent 启动时进行设置。如果您修改了值,则必须重启 Ops Agent 以刷新值。
其他接收器配置
本部分提供了使用 Prometheus 接收器的 relabel_configs 和 metric_relabel_configs 部分来修改注入的指标的数量和结构的示例。此部分还包含使用重新添加标签选项的修订版 JSON 导出器的接收器的示例。
添加虚拟机元数据
您可以使用 relabel_configs 部分向指标添加标签。例如,以下部分使用 Ops Agent 提供的元标签 __meta_gce_zone 来创建指标标签 zone,该标签在重新添加标签后会保留,因为 zone 不具有 __ 前缀。
如需查看可用元标签的列表,请参阅重新添加标签期间可用的 Compute Engine 元标签。默认 Ops Agent 配置会为您重新添加一些元标签。
relabel_configs:
  - source_labels: [__meta_gce_zone]
    regex: '(.+)'
    replacement: '${1}'
    target_label: zone
“示例:为 Prometheus 配置 Ops Agent”中显示的 Prometheus 接收器包含添加此标签的操作。
删除指标
您可以使用 metrics_relabel_configs 部分删除不想注入的指标;此模式有助于控制费用。
例如,您可以使用以下模式来丢弃名称与 METRIC_NAME_REGEX_1 或 METRIC_NAME_REGEX_2 匹配的任何指标:
metric_relabel_configs:
  - source_labels: [ __name__ ]
    regex: 'METRIC_NAME_REGEX_1'
    action: drop
  - source_labels: [ __name__ ]
    regex: 'METRIC_NAME_REGEX_2'
    action: drop
添加静态标签
您可以使用 metrics_relabel_configs 部分向 Prometheus 接收器注入的所有指标添加静态标签。您可以使用以下模式将 staticLabel1 和 staticLabel2 标签添加到所有注入的指标:
metric_relabel_configs:
  - source_labels: [ __address__ ]
    action: replace
    replacement: 'STATIC_VALUE_1'
    target_label: staticLabel1
  - source_labels: [ __address__ ]
    action: replace
    replacement: 'STATIC_VALUE_2'
    target_label: staticLabel2
以下版本的 JSON 导出器的 Prometheus 接收器的示例会使用这些配置模式执行以下操作:
- 根据 Ops Agent 提供的
__meta_gce_zone元标签的值设置zone标签。 - 删除导出器的
example_global_value指标。 - 将值为“静态值”的
staticLabel标签添加到所有注入的指标。
metrics:
  receivers:
    prometheus:
        type: prometheus
        config:
          scrape_configs:
            - job_name: 'json_exporter'
              scrape_interval: 10s
              metrics_path: /probe
              params:
                module: [default]
                target: [http://localhost:8000/examples/data.json]
              static_configs:
                - targets: ['localhost:7979']
              relabel_configs:
                - source_labels: [__meta_gce_zone]
                  regex: '(.+)'
                  replacement: '${1}'
                  target_label: zone
              metric_relabel_configs:
                - source_labels: [ __name__ ]
                  regex: 'example_global_value'
                  action: drop
                - source_labels: [ __address__ ]
                  action: replace
                  replacement: 'A static value'
                  target_label: staticLabel