O que é a monitorização de aplicações?
A monitorização de aplicações permite-lhe monitorizar os recursos e a infraestrutura na perspetiva de uma aplicação. Ou seja, não inicia uma investigação pesquisando os seus recursos e determinando quais são usados pela sua aplicação. Em alternativa, inicia uma investigação com a sua aplicação e, em seguida, encontra informações sobre os recursos e a infraestrutura que utiliza. Os painéis de controlo que a monitorização de aplicações gera para a sua aplicação permitem-lhe compreender o estado operacional da sua aplicação e dos respetivos serviços e cargas de trabalho.
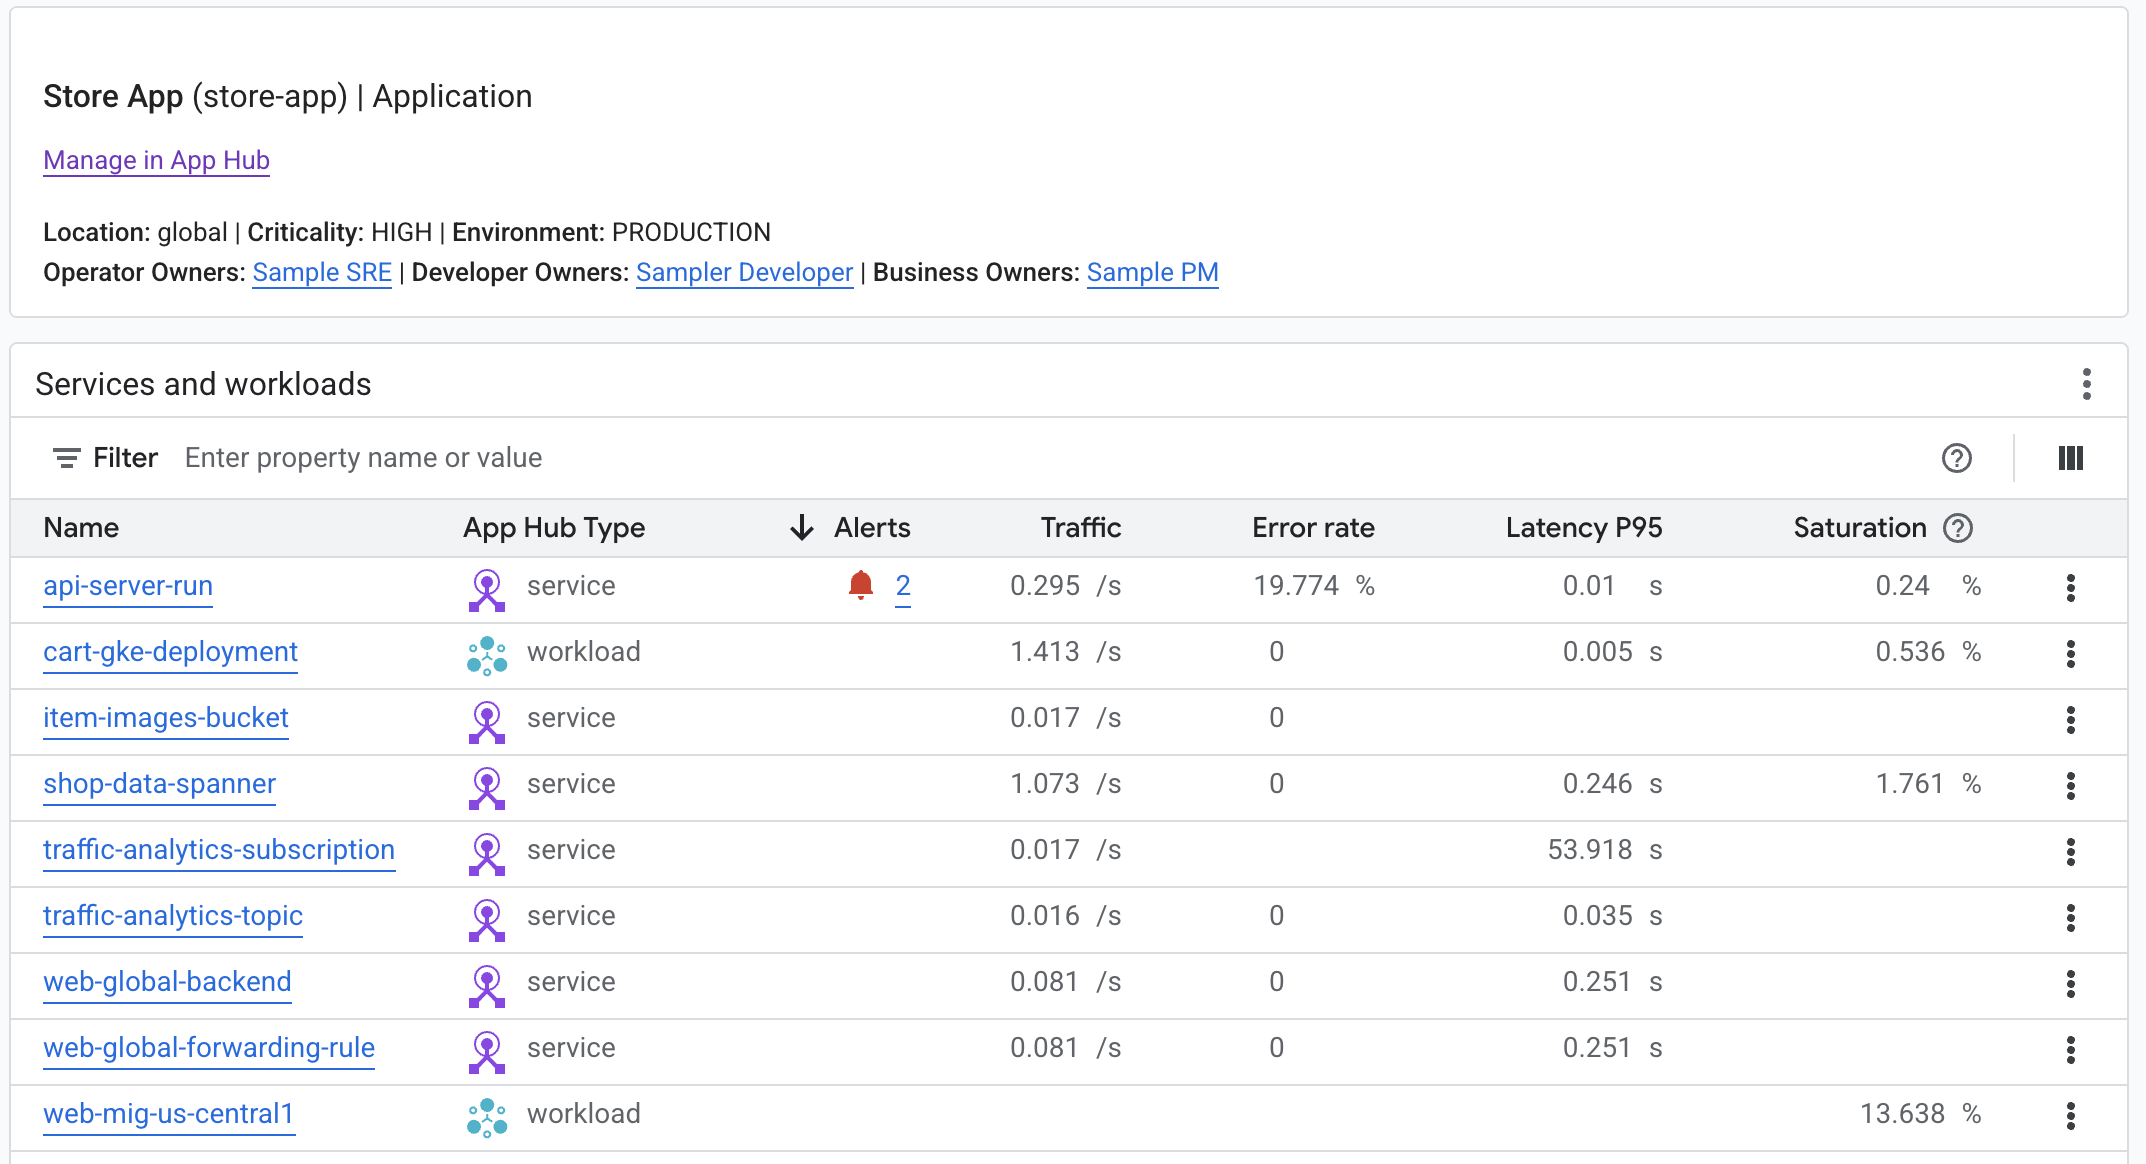
Por exemplo, a captura de ecrã seguinte mostra as informações de resumo que a monitorização de aplicações fornece para uma aplicação específica:
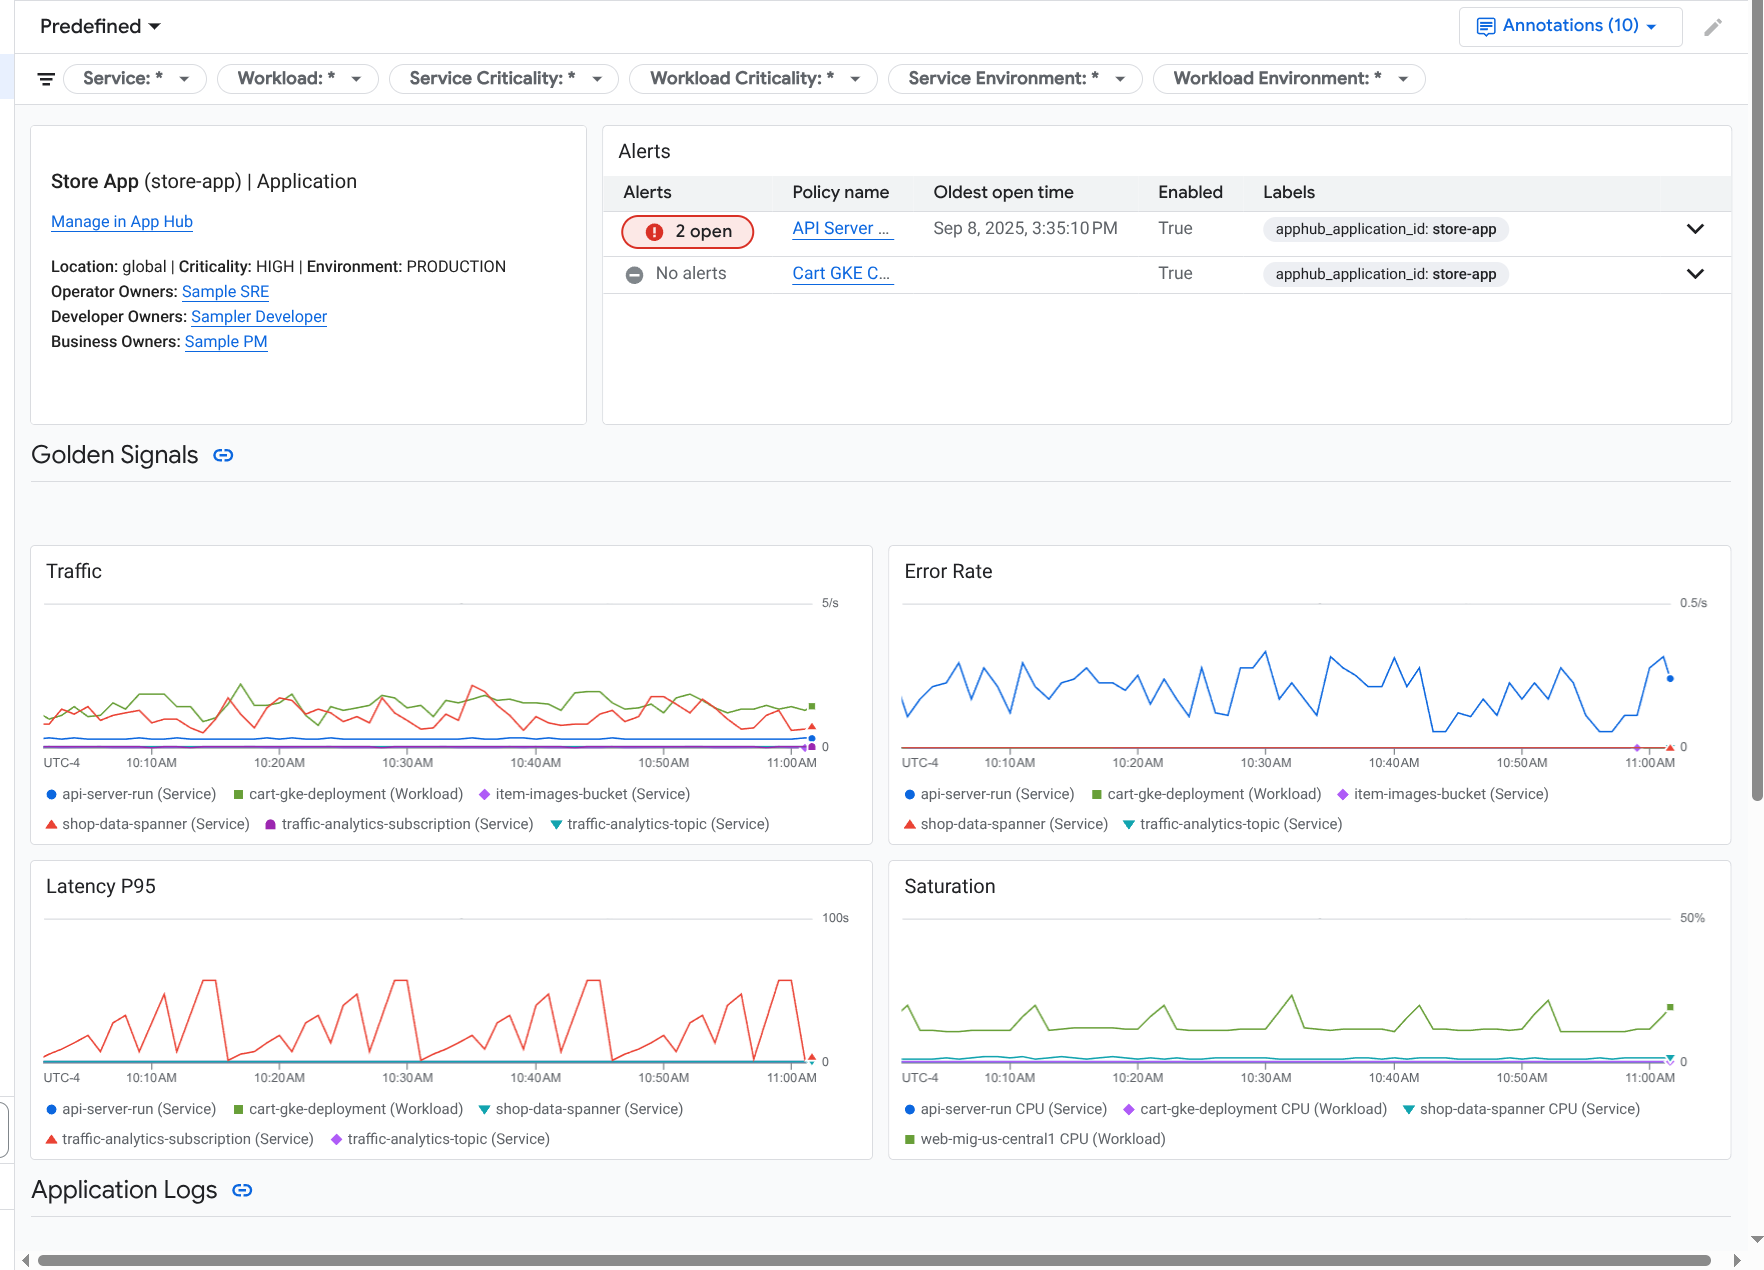
Para esta mesma aplicação, a monitorização de aplicações também cria um painel de controlo que mostra informações mais detalhadas, como sinais de ouro, dados de registo e informações sobre incidentes abertos:
Para usar a monitorização de aplicações, tem de criar a sua aplicação e registar serviços e cargas de trabalho na aplicação e, em seguida, configurar o âmbito de observabilidade. Para criar uma aplicação e registar serviços e cargas de trabalho na mesma, pode usar o App Hub ou implementar a sua aplicação através do Application Design Center.
Por que motivo deve adotar a monitorização de aplicações
A utilização da monitorização de aplicações pode poupar-lhe tempo e esforço. Por exemplo, suponha que usa o Application Design Center para ajudar a criar e implementar a sua aplicação. Em seguida, usa o App Hub para ajudar a organizar e gerir essa aplicação, e usa a monitorização de aplicações para compreender o desempenho da sua aplicação e diagnosticar falhas:
- Painéis de controlo de aplicações, serviços e cargas de trabalho
- Propagação de etiquetas para os serviços e as cargas de trabalho de aplicações do App Hub.
- Filtre a telemetria por criticidade e ambiente.
- Integração perfeita com código aberto
Quando a sua aplicação é implementada, o serviço de monitorização de aplicações descobre a sua aplicação e cria automaticamente painéis de controlo personalizados para o seu ambiente. Para apoiar a sua investigação de incidentes, estes painéis de controlo suportam a pesquisa e a filtragem.
Os painéis de controlo criados pela monitorização de aplicações apresentam o seguinte:
- Informações como a localização, a criticidade e os proprietários.
- Informações sobre incidentes abertos.
- Dados de registo e métricas gerados pela infraestrutura suportada. Os dados das métricas incluem sinais universais, como taxas de erro e tráfego, e métricas selecionadas.
Quando as suas aplicações são executadas na infraestrutura suportada, o Google Cloud Observability anexa etiquetas específicas da aplicação aos seus dados de telemetria. Estas etiquetas identificam a sua aplicação do App Hub. Pode usar estas etiquetas específicas da aplicação quando consultar os dados de telemetria. As páginas Explorador de registos, Explorador de métricas e Explorador de rastreios permitem-lhe usar etiquetas para filtrar e agregar dados.
Comece a usar a monitorização de aplicações
Para usar a monitorização de aplicações, faça o seguinte:
Configure o âmbito da observabilidade para poder ver a telemetria de uma aplicação registada no App Hub. Para ver informações acerca deste passo, consulte o artigo Configure a monitorização de aplicações.
Anexe etiquetas específicas da aplicação às suas políticas de alerta. Para obter informações sobre este passo, consulte o artigo Associe uma política de alerta a uma aplicação do App Hub.
Se quiser que os dados de métricas e rastreios gerados pela aplicação incluam etiquetas de aplicações, instrumente a sua aplicação com o OpenTelemetry ou use o Google Cloud Managed Service for Prometheus. Para mais informações, consulte o artigo Instrumente a app para a monitorização de aplicações.
Abra e explore os painéis de controlo da monitorização de aplicações. Para ver informações sobre como ver estes painéis de controlo, consulte o artigo Veja a telemetria da aplicação.