After you have deployed Google Cloud Managed Service for Prometheus, you can query the data sent to the managed service and display the results in charts and dashboards.
This document describes metrics scopes, which determine the data you can query, and how to use Cloud Monitoring to retrieve and use the data you've collected.
All query interfaces for Managed Service for Prometheus are configured to retrieve data from Monarch using the Cloud Monitoring API. By querying Monarch instead of querying data from local Prometheus servers, you get global monitoring at scale.
Before you begin
If you have not already deployed the managed service, then set up managed collection or self-deployed collection. You can skip this if you're only interested in querying Cloud Monitoring metrics using PromQL.
Queries and metrics scopes
The data you can query is determined by the Cloud Monitoring construct metrics scope, regardless of the method you use to query the data.
A Monitoring metrics scope is a read-time-only construct that lets you query metric data belonging to multiple Google Cloud projects. Every metrics scope is hosted by a designated Google Cloud project, called the scoping project.
By default, a project is the scoping project for its own metrics scope, and the metrics scope contains the metrics and configuration for that project. A scoping project can have more than one monitored project in its metrics scope, and the metrics and configurations from all the monitored projects in the metrics scope are visible to the scoping project. A monitored project can also belong to more than one metrics scope.
When you query the metrics in a scoping project, and if that scoping project hosts a multi-project metrics scope, you can retrieve data from multiple projects. If your metrics scope contains all your projects, then your queries and rules evaluate globally.
For more information about scoping projects and metrics scope, see Metrics scopes. For information about configuring multi-project metrics scope, see View metrics for multiple projects.
Managed Service for Prometheus data in Cloud Monitoring
Managed Service for Prometheus shares the data-storage backend, Monarch, with Cloud Monitoring. You can use all of the tools provided by Cloud Monitoring with the data collected by Managed Service for Prometheus. For example, you can use Metrics Explorer, as described in Google Cloud console for Monitoring, and you can set alerts based on these metrics. You can also import your Grafana dashboards into Cloud Monitoring.
When working with metric data, including data from Managed Service for Prometheus, in Cloud Monitoring, you can use the query tools provided by Cloud Monitoring:
Querying using PromQL in Cloud Monitoring
The simplest way to query your Prometheus data is to use the Cloud Monitoring Metrics Explorer page in the Google Cloud console. To verify that your Prometheus data is being collected correctly, do the following:
-
In the Google Cloud console, go to the leaderboard Metrics explorer page:
If you use the search bar to find this page, then select the result whose subheading is Monitoring.
In the toolbar of the query-builder pane, select the button whose name is either code MQL or code PromQL.
Verify that PromQL is selected in the Language toggle. The language toggle is in the same toolbar that lets you format your query.
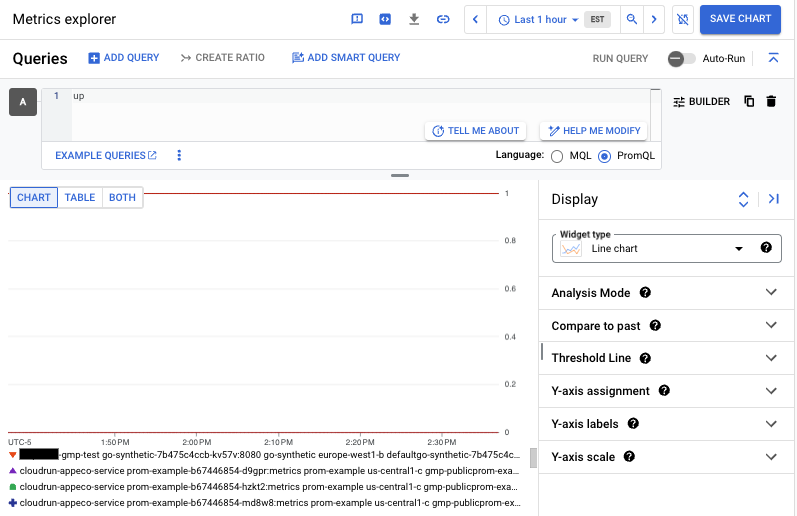
Enter the following query into the editor, and then click Run query:
up
If your data is being ingested, then you see a chart like the following:
For information about how to query Cloud Monitoring system metrics using PromQL, see PromQL for Cloud Monitoring metrics.
For more information about using PromQL in Metrics Explorer and Cloud Monitoring charts, see PromQL in Cloud Monitoring.
Other query options in Cloud Monitoring
To view your Prometheus data as Cloud Monitoring time series and to create charts and dashboards, you can also use the menu-driven interfaces or MQL. The following shows a simple query in Metrics Explorer:
-
In the Google Cloud console, go to the leaderboard Metrics explorer page:
If you use the search bar to find this page, then select the result whose subheading is Monitoring.
Specify the data to appear on the chart. In addition to using the PromQL button described previously, you can also use the menu-driven interface. To construct a query, do the following:
Within the query-builder pane, click "Select a metric".
In the search field, type "up/" to filter the list, then select Prometheus Target, then select Up, then select Prometheus/up/gauge.
Click "Apply".
The chart that results from this query shows the same data as the chart shown in the PromQL example.
Queries created using the menu-driven interface can be converted to PromQL by selecting the PromQL button. This translation might not correctly convert histogram functions or other uncommon operators.
The prometheus_target resource
In Cloud Monitoring, time-series data is written against a monitored-resource
type. For Prometheus metrics, the monitored-resource type is
prometheus_target. Monitoring queries for
Prometheus metrics that are not written in PromQL
must specify this resource type.
The prometheus_target resource has the following labels, which you can
use for filtering and manipulating queried data:
project_id: The identifier of the Google Cloud project associated with this resource.location: The physical location (Google Cloud region) where the data is stored. This value is typically the region of your GKE cluster or Compute Engine instance. If data is collected from an AWS or on-premises deployment, then the value might be the closest Google Cloud region.cluster: The GKE cluster or related concept; might be empty.namespace: The GKE namespace or related concept; might be empty.job: The job label of the Prometheus target, if known; might be empty for rule-evaluation results.instance: The instance label of the Prometheus target, if known; might be empty for rule-evaluation results.
The values for these labels are set during collection.