After you have deployed Google Cloud Managed Service for Prometheus, you can query the data sent to the managed service and display the results in charts and dashboards.
This document describes metrics scopes, which determine the data you can query, and the following Prometheus-based ways to retrieve and use the data you've collected:
- The Prometheus HTTP API
- The Prometheus UI
All query interfaces for Managed Service for Prometheus are configured to retrieve data from Monarch using the Cloud Monitoring API. By querying Monarch instead of querying data from local Prometheus servers, you get global monitoring at scale.
Before you begin
If you have not already deployed the managed service, then set up managed collection or self-deployed collection. You can skip this if you're only interested in querying Cloud Monitoring metrics using PromQL.
Configure your environment
To avoid repeatedly entering your project ID or cluster name, perform the following configuration:
Configure the command-line tools as follows:
Configure the gcloud CLI to refer to the ID of your Google Cloud project:
gcloud config set project PROJECT_ID
Configure the
kubectlCLI to use your cluster:kubectl config set-cluster CLUSTER_NAME
For more information about these tools, see the following:
Set up a namespace
Create the NAMESPACE_NAME Kubernetes namespace for resources you create
as part of the example application:
kubectl create ns NAMESPACE_NAME
Verify service account credentials
If your Kubernetes cluster has Workload Identity Federation for GKE enabled, then you can skip this section.
When running on GKE, Managed Service for Prometheus
automatically retrieves credentials from the environment based on the
Compute Engine default service account. The default service account has the
necessary permissions, monitoring.metricWriter and monitoring.viewer, by
default. If you don't use Workload Identity Federation for GKE, and you have previously
removed either of those roles from the default node service account, you will
have to re-add those missing permissions before continuing.
Configure a service account for Workload Identity Federation for GKE
If your Kubernetes cluster doesn't have Workload Identity Federation for GKE enabled, then you can skip this section.
Managed Service for Prometheus captures metric data by using the Cloud Monitoring API. If your cluster is using Workload Identity Federation for GKE, you must grant your Kubernetes service account permission to the Monitoring API. This section describes the following:
- Creating a dedicated Google Cloud service account,
gmp-test-sa. - Binding the Google Cloud service account to the default Kubernetes
service account in a test namespace,
NAMESPACE_NAME. - Granting the necessary permission to the Google Cloud service account.
Create and bind the service account
This step appears in several places in the Managed Service for Prometheus documentation. If you have already performed this step as part of a prior task, then you don't need to repeat it. Skip ahead to Authorize the service account.
The following command sequence creates the gmp-test-sa service account
and binds it to the default Kubernetes service account in the
NAMESPACE_NAME namespace:
gcloud config set project PROJECT_ID \
&&
gcloud iam service-accounts create gmp-test-sa \
&&
gcloud iam service-accounts add-iam-policy-binding \
  --role roles/iam.workloadIdentityUser \
  --member "serviceAccount:PROJECT_ID.svc.id.goog[NAMESPACE_NAME/default]" \
  gmp-test-sa@PROJECT_ID.iam.gserviceaccount.com \
&&
kubectl annotate serviceaccount \
  --namespace NAMESPACE_NAME \
  default \
  iam.gke.io/gcp-service-account=gmp-test-sa@PROJECT_ID.iam.gserviceaccount.com
If you are using a different GKE namespace or service account, adjust the commands appropriately.
Authorize the service account
Groups of related permissions are collected into roles, and you grant the roles to a principal, in this example, the Google Cloud service account. For more information about Monitoring roles, see Access control.
The following command grants the Google Cloud service account,
gmp-test-sa, the Monitoring API roles it needs to
read
metric data.
If you have already granted the Google Cloud service account a specific role as part of prior task, then you don't need to do it again.
To authorize your service account to read from a multi-project metrics scope, follow these instructions and then see Change the queried project.gcloud projects add-iam-policy-binding PROJECT_ID \ --member=serviceAccount:gmp-test-sa@PROJECT_ID.iam.gserviceaccount.com \ --role=roles/monitoring.viewer
Debug your Workload Identity Federation for GKE configuration
If you are having trouble getting Workload Identity Federation for GKE to work, see the documentation for verifying your Workload Identity Federation for GKE setup and the Workload Identity Federation for GKE troubleshooting guide.
As typos and partial copy-pastes are the most common sources of errors when configuring Workload Identity Federation for GKE, we strongly recommend using the editable variables and clickable copy-paste icons embedded in the code samples in these instructions.
Workload Identity Federation for GKE in production environments
The example described in this document binds the Google Cloud service account to the default Kubernetes service account and gives the Google Cloud service account all necessary permissions to use the Monitoring API.
In a production environment, you might want to use a finer-grained approach, with a service account for each component, each with minimal permissions. For more information on configuring service accounts for workload-identity management, see Using Workload Identity Federation for GKE.
Queries and metrics scopes
The data you can query is determined by the Cloud Monitoring construct metrics scope, regardless of the method you use to query the data. For example, if you use Grafana to query Managed Service for Prometheus data, then each metrics scope must be configured as a separate data source.
A Monitoring metrics scope is a read-time-only construct that lets you query metric data belonging to multiple Google Cloud projects. Every metrics scope is hosted by a designated Google Cloud project, called the scoping project.
By default, a project is the scoping project for its own metrics scope, and the metrics scope contains the metrics and configuration for that project. A scoping project can have more than one monitored project in its metrics scope, and the metrics and configurations from all the monitored projects in the metrics scope are visible to the scoping project. A monitored project can also belong to more than one metrics scope.
When you query the metrics in a scoping project, and if that scoping project hosts a multi-project metrics scope, you can retrieve data from multiple projects. If your metrics scope contains all your projects, then your queries and rules evaluate globally.
For more information about scoping projects and metrics scope, see Metrics scopes. For information about configuring multi-project metrics scope, see View metrics for multiple projects.
Managed Service for Prometheus data in Cloud Monitoring
The simplest way to verify that your Prometheus data is being exported is to use the Cloud Monitoring Metrics Explorer page in the Google Cloud console, which supports PromQL. For instructions, see Querying using PromQL in Cloud Monitoring.
Standalone Prometheus frontend UI
You can use the standalone Prometheus frontend UI to access and visualize ingested data. This UI runs PromQL queries against all data in your Google Cloud project, as determined by the metrics scope associated with your project.
The frontend UI also acts as an authentication proxy for accessing ingested
data. This feature can be used for client tools that don't support OAuth2
for service accounts,
including Grafana or horizontal pod autoscaling using the prometheus-adapter
library.
We strongly recommend configuring Grafana to visualize data from Managed Service for Prometheus using the data source syncer. The instructions for configuring Grafana using the standalone Prometheus frontend UI are included here as reference for users who have previously configured Grafana using this method.
Deploy the frontend UI
To deploy the standalone Prometheus frontend UI for Managed Service for Prometheus, run the following commands:
Deploy the
frontendservice and configure it to query the scoping project of your metrics scope of your choice:curl https://raw.githubusercontent.com/GoogleCloudPlatform/prometheus-engine/e2cd07628f5bf3be5dc794ce8f4d4b9a206447ec/examples/frontend.yaml | sed 's/\$PROJECT_ID/PROJECT_ID/' | kubectl apply -n NAMESPACE_NAME -f -
Port-forward the
frontendservice to your local machine. The following example forwards the service to port 9090:kubectl -n NAMESPACE_NAME port-forward svc/frontend 9090
This command does not return, and while it is running, it reports accesses to the URL.
If you want to continue using a Grafana deployment installed by kube-prometheus,
then deploy the standalone Prometheus frontend UI in the monitoring namespace
instead.
You can access the standalone Prometheus frontend UI in your browser at the URL
http://localhost:9090. If you are using Cloud Shell for this step, you can
get access by using the Web Preview button.
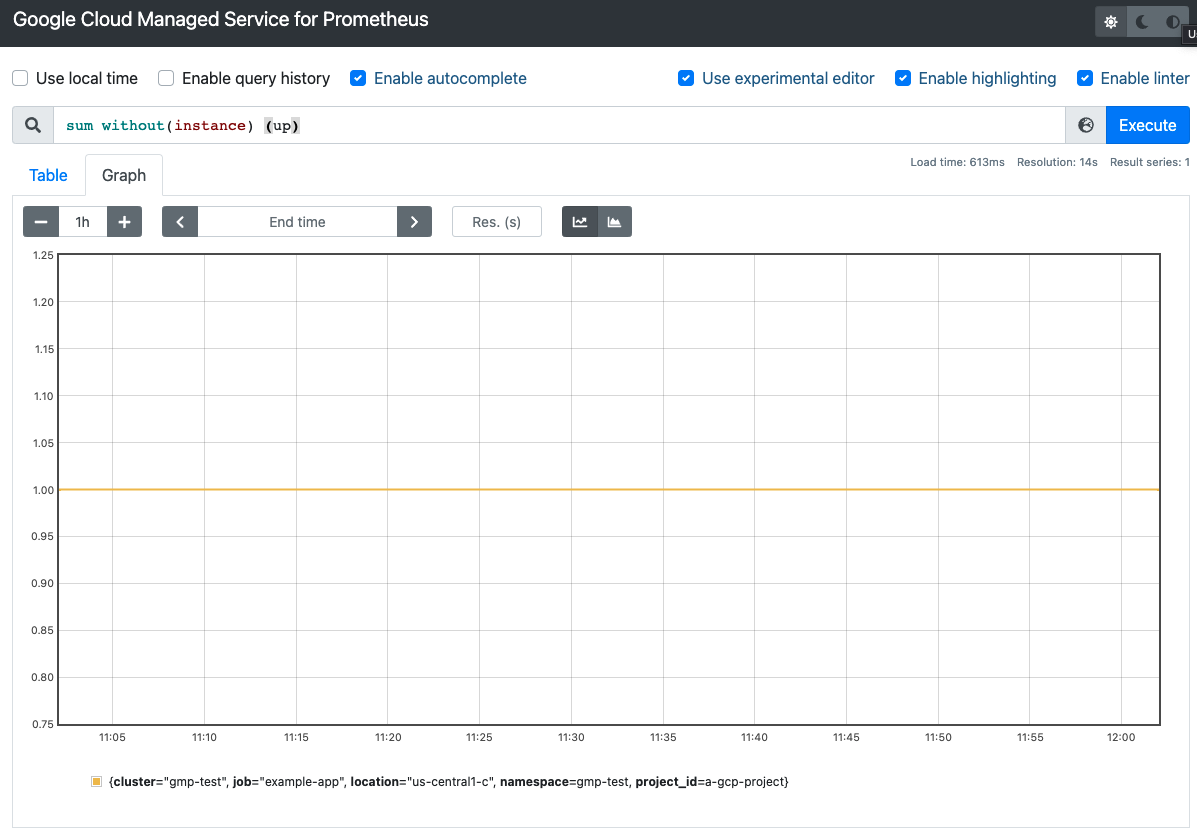
The following screenshot shows a table in the standalone Prometheus frontend
UI that displays the up metric:
You can also set up suitable authentication and authorization on the
frontend service by using, for example, Identity Aware Proxy.
For more information on exposing services, see Exposing applications using
services.
Change the queried project to get multi-project monitoring
The frontend deployment uses the configured Google Cloud project as the
scoping project. If this project is the scoping project of a
multi-project metrics scope, then it can read metrics from all
projects in the metrics scope.
You can specify a project with a multi-project metrics scope by using the
--query.project-id flag.
Typically, you use a dedicated project as a scoping project, and
this project is not the same project the frontend deployment runs in.
To let the deployment read a different target project, you must do the
following:
- Tell the
frontenddeployment which project is the target project. Grant the service account permission to read the target project. If you have been using the Compute Engine
defaultservice account, you can do one of the following:Enable Workload Identity Federation for GKE for your cluster and follow the configuration steps.
Provide an explicit service-account key.
To grant the permissions needed to access a different Google Cloud project, do the following:
Grant the service account permission to read from the target project you want to query:
gcloud projects add-iam-policy-binding SCOPING_PROJECT_ID \ --member=serviceAccount:gmp-test-sa@PROJECT_ID.iam.gserviceaccount.com \ --role=roles/monitoring.viewer
Open the
frontenddeployment created previously for editing:kubectl -n NAMESPACE_NAME edit deploy frontend
Specify the target project by using the
--query.project-idflag:apiVersion: apps/v1 kind: Deployment metadata: namespace: NAMESPACE_NAME name: frontend spec: template containers: - name: frontend args: - --query.project-id=SCOPING_PROJECT_ID ...Save the file and close the editor. After the change is applied, the frontend pods are restarted and query the new scoping project.
Authenticate the frontend UI
The frontend deployment supports
basic access authentication
for authenticated access in versions 0.5.0 and above. To enable authentication,
add the AUTH_USERNAME and AUTH_PASSWORD environment variables to the
deployment:
apiVersion: apps/v1
kind: Deployment
metadata:
namespace: NAMESPACE_NAME
name: frontend
spec:
template
containers:
- name: frontend
env:
- name: AUTH_USERNAME
value: USERNAME
- name: AUTH_PASSWORD
value: PASSWORD
...
Provide credentials explicitly
You can skip this section if you are running the frontend container in
a Google Kubernetes Engine cluster. If you are having authentication issues on
GKE, see Verify service account credentials.
When running on GKE, the frontend
automatically retrieves credentials from the environment based on the
node's service account or the Workload Identity Federation for GKE setup.
In non-GKE Kubernetes clusters, credentials must be explicitly
provided to the frontend by using flags or the
GOOGLE_APPLICATION_CREDENTIALS environment variable.
Set the context to your target project:
gcloud config set project PROJECT_ID
Create a service account:
gcloud iam service-accounts create gmp-test-sa
This step creates the service account that you might have already created in the Workload Identity Federation for GKE instructions.
Grant the required permissions to the service account:
gcloud projects add-iam-policy-binding PROJECT_ID \
  --member=serviceAccount:gmp-test-sa@PROJECT_ID.iam.gserviceaccount.com \
  --role=roles/monitoring.viewer
Create and download a key for the service account:
gcloud iam service-accounts keys create gmp-test-sa-key.json \
  --iam-account=gmp-test-sa@PROJECT_ID.iam.gserviceaccount.com
Add the key file as a secret to your non-GKE cluster:
kubectl -n NAMESPACE_NAME create secret generic gmp-test-sa \
  --from-file=key.json=gmp-test-sa-key.json
Open the frontend Deployment resource for editing:
kubectl -n NAMESPACE_NAME edit deploy frontend
Add the text shown in bold to the resource:
apiVersion: apps/v1
kind: Deployment
metadata:
  namespace: NAMESPACE_NAME
  name: frontend
spec:
  template
    containers:
    - name: frontend
      args:
      - --query.credentials-file=/gmp/key.json
...
      volumeMounts:
      - name: gmp-sa
        mountPath: /gmp
        readOnly: true
...
    volumes:
    - name: gmp-sa
      secret:
        secretName: gmp-test-sa
...
Save the file and close the editor. After the change is applied, the pods are re-created and start authenticating to the metric backend with the given service account.
GOOGLE_APPLICATION_CREDENTIALSenvironment variable.Using Grafana through the Frontend Proxy
Managed Service for Prometheus uses the built-in Prometheus data source for Grafana, meaning that you can keep using any community-created or personal Grafana dashboards without any changes. You can also import your Grafana dashboards into Cloud Monitoring.
Authenticating to Google Cloud APIs
Google Cloud APIs all require authentication using OAuth2; however, Grafana doesn't support OAuth2 authentication for service accounts used with Prometheus data sources. To use Grafana with Managed Service for Prometheus, you can use the standalone Prometheus frontend UI as an authentication proxy.
You must point Grafana at the standalone frontend UI proxy to query data globally. If you do not follow these steps, then Grafana only executes queries against data in the local Prometheus server.
If you have not already deployed the Prometheus UI
frontendservice as a proxy, deploy it now by running the following command:curl https://raw.githubusercontent.com/GoogleCloudPlatform/prometheus-engine/v0.15.3/examples/frontend.yaml | sed 's/\$PROJECT_ID/PROJECT_ID/' | kubectl apply -n NAMESPACE_NAME -f -
For non-GKE Kubernetes clusters such as Anthos clusters, also see Provide credentials explicitly to give the
frontendservice the permissions needed to query metrics.See change the queried project for instructions on configuring the metrics scope used by the
frontendservice to query across multiple projects.If you have a pre-existing Grafana deployment, such as one installed by the
kube-prometheuslibrary or one installed using a helm chart, you can continue using it with Managed Service for Prometheus. If so, see Configure a data source for next steps. Otherwise, you must first deploy Grafana.Deploy Grafana
If you don't have a running Grafana deployment in your cluster, then you can create an ephemeral test deployment to experiment with.
To create an ephemeral Grafana deployment, apply the Managed Service for Prometheus
grafana.yamlmanifest to your cluster, and port-forward thegrafanaservice to your local machine. The following example forwards the service to port 3000.Apply the
grafana.yamlmanifest:kubectl -n NAMESPACE_NAME apply -f https://raw.githubusercontent.com/GoogleCloudPlatform/prometheus-engine/beb779d32f4dd531a3faad9f2916617b8d9baefd/examples/grafana.yaml
Port-forward the
grafanaservice to your local machine. This example forwards the service to port 3000:kubectl -n NAMESPACE_NAME port-forward svc/grafana 3000
This command does not return, and while it is running, it reports accesses to the URL.
You can access Grafana in your browser at the URL
http://localhost:3000with the username:passwordadmin:admin.
Configure a data source
To query Managed Service for Prometheus in Grafana by using the Prometheus UI as the authentication proxy, you must add a new data source to Grafana. To add a data source for the managed service, do the following:
Go to your Grafana deployment, for example, by browsing to the URL
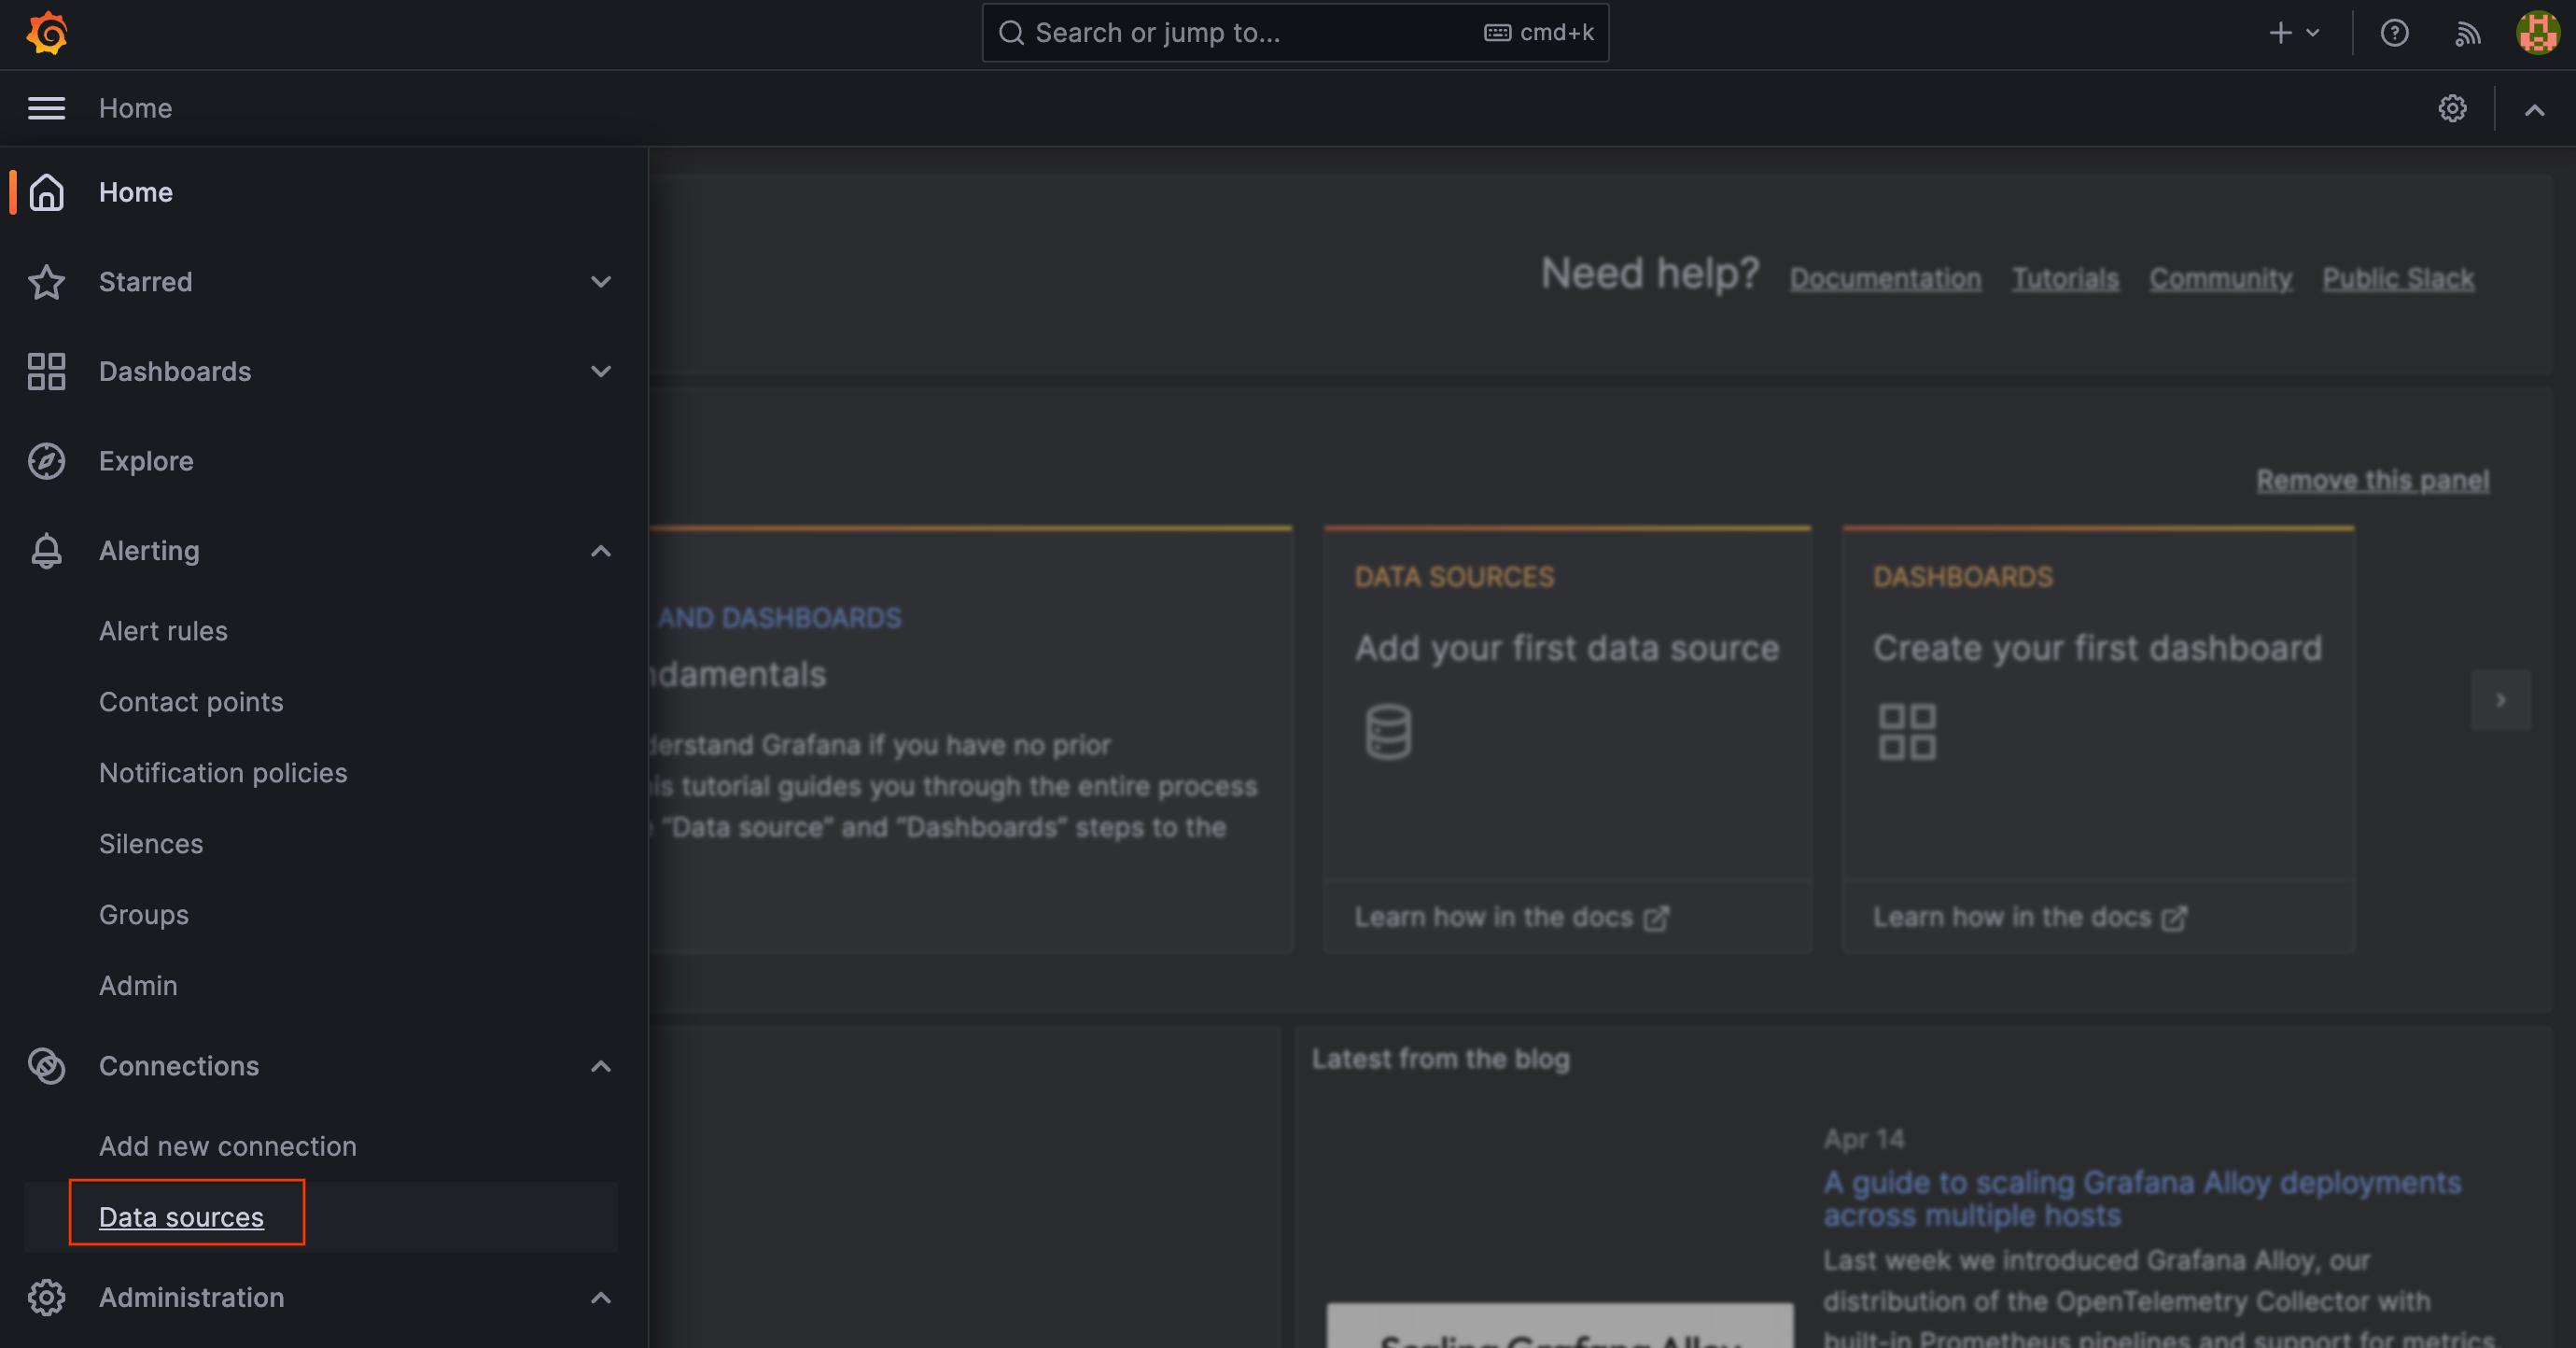
http://localhost:3000to reach the Grafana welcome page.Select Configuration from the main Grafana menu, then select Data Sources.
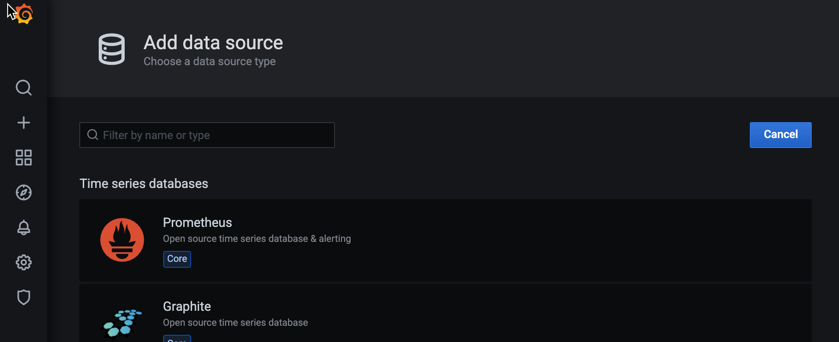
Select Add data source, and select Prometheus as the time series database.
In the URL field of the HTTP pane, enter the URL of the Managed Service for Prometheus
frontendservice. If you configured the Prometheus frontend UI to run on port 9090, then the service URL for this field ishttp://frontend.NAMESPACE_NAME.svc:9090.In the Timeout field of the HTTP pane, set the value to
120.If you configured the frontend UI proxy with Basic auth, enable the Basic auth switch in the Auth pane and fill out the username and password.
In the Query timeout field, set the value to
2m.In the HTTP Method field, select
GET.In the Prometheus type field, select
Prometheus.In the Prometheus version field, select
2.40.xor higher.If you have multiple Prometheus data sources, then you might give this one a name like "Managed Prometheus Service". You can leave other fields with their default values.
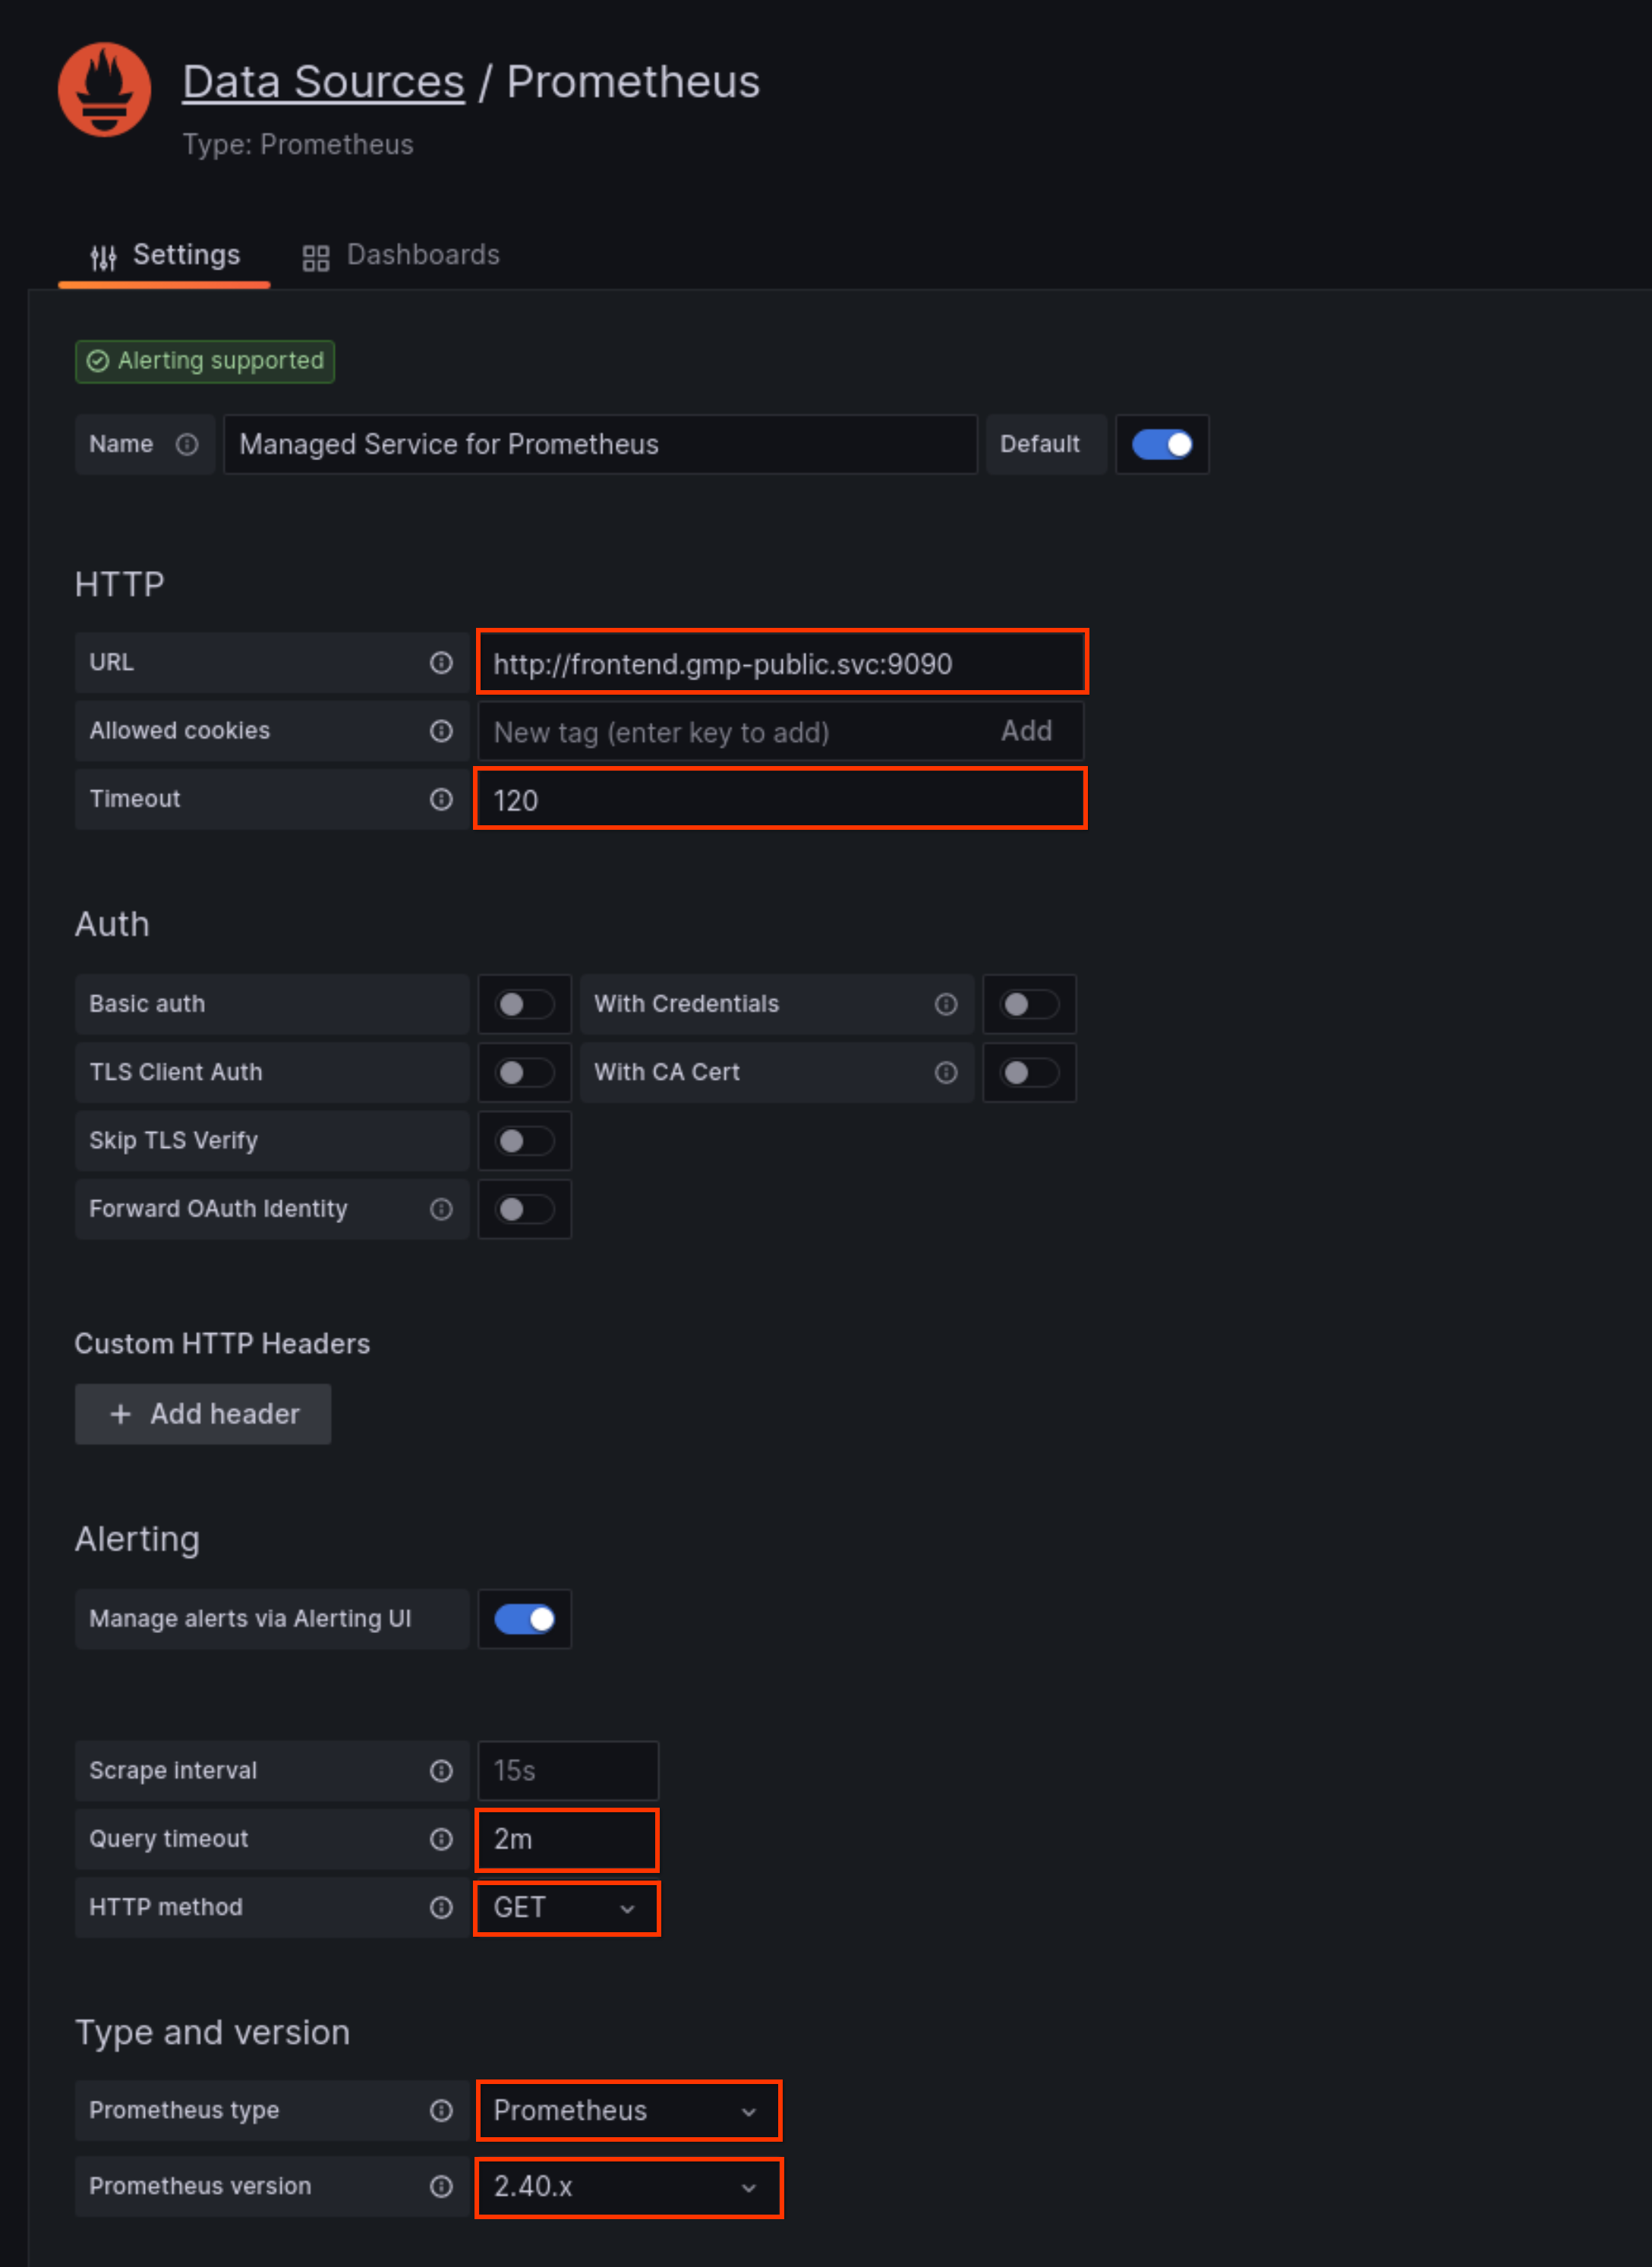
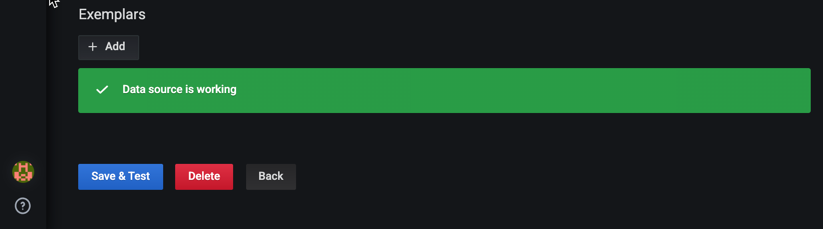
Click Save & Test, and look for the message "The data source is working".
Use the new data source
You can now create Grafana dashboards using the new data source. You can also redirect existing dashboards to the new data source. The following screenshot shows a Grafana chart that displays the
upmetric: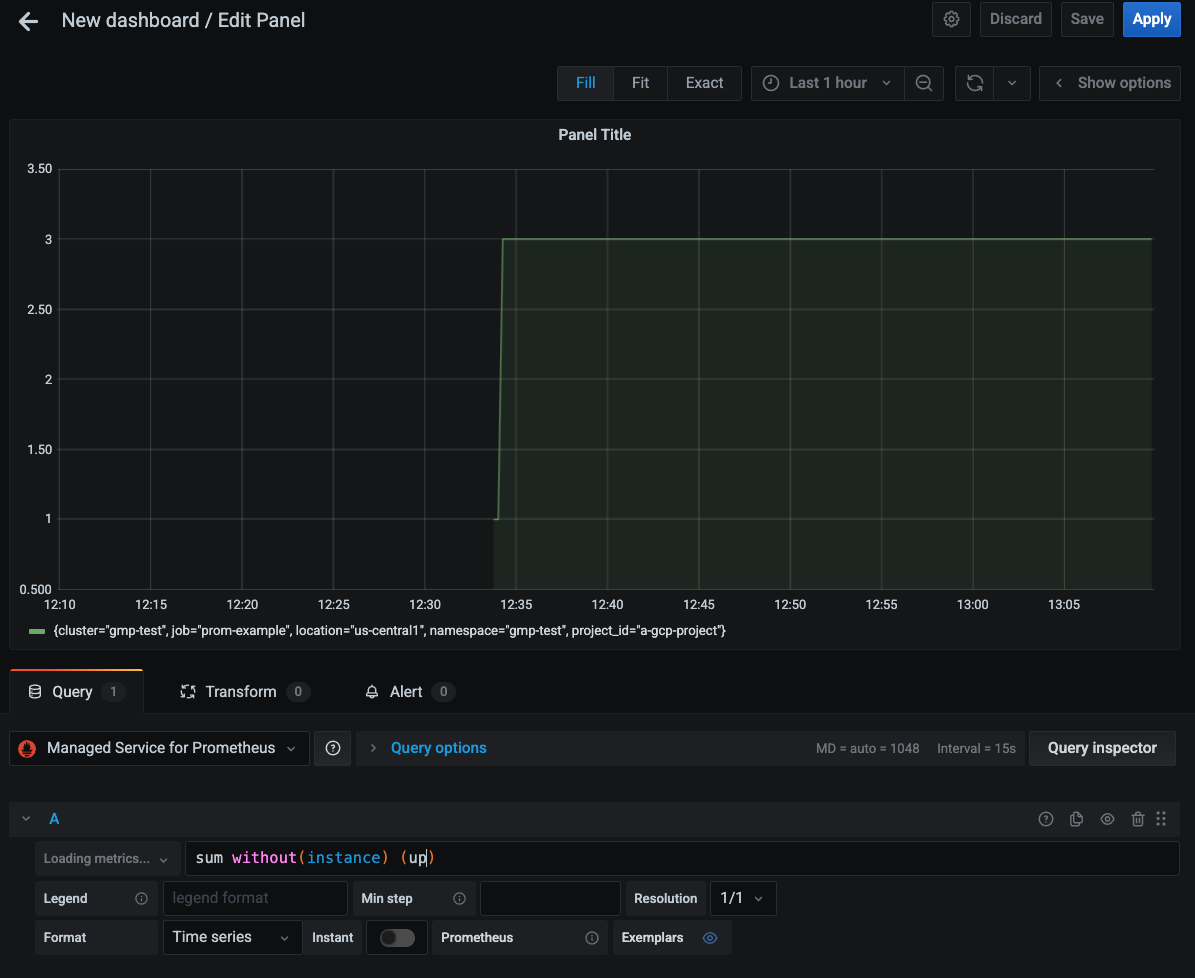
Connecting Managed Service for Prometheus to Thanos
You can federate Managed Service for Prometheus to a self-deployed Thanos stack by using the open-source thanos-promql-connector. Google Cloud does not provide support for this integration.
Prometheus HTTP API
Managed Service for Prometheus supports the upstream Prometheus HTTP API at the URL prefixed by
https://monitoring.googleapis.com/v1/projects/PROJECT_ID/location/global/prometheus/api/v1/. For information about the supported endpoints, see API compatibility.This API can be accessed by any tool that can interact with a standard Prometheus server. This is an API endpoint only; it doesn't serve a UI. As a Google Cloud API, the API uses OAuth2 authentication, and as part of the Cloud Monitoring API, the value of the
PROJECT_IDis the scoping project of a metrics scope, so you can retrieve data from any project in the metrics scope. For more information about scoping, see Metrics scopes.To use this endpoint, provide a PromQL expression. For example, the following instant query retrieves all time series that have the metric name
up:curl https://monitoring.googleapis.com/v1/projects/PROJECT_ID/location/global/prometheus/api/v1/query \ -d "query=up" \ -H "Authorization: Bearer $(gcloud auth print-access-token)"
If the request is successful, then the query returns a result like the following, which has been formatted for readability:
{
  "status":"success",
  "data":{
    "resultType":"vector",
    "result":[{
      "metric": {
        "__name__":"up",
        "cluster":"gmp-test",
        "instance":"prom-example-84c6f547f5-g4ljn:web",
        "job":"prometheus",
        "location":"us-central1-a",
        "project_id":"a-gcp-project"
      },
      "value": [1634873239.971,"1"]
    }]
  }
}
For information about querying Google Cloud system metrics using PromQL, see PromQL for Cloud Monitoring metrics.
API compatibility
The following Prometheus HTTP API endpoints are supported by Managed Service for Prometheus under the URL prefixed by
https://monitoring.googleapis.com/v1/projects/PROJECT_ID/location/global/prometheus/api/v1/.For full documentation, see the Cloud Monitoring API reference documentation. The Promethus HTTP endpoints aren't available in the Cloud Monitoring language-specific client libraries.
For information about PromQL compatibility, see PromQL support.
The following endpoints are fully supported:
The
/api/v1/label/<label_name>/valuesendpoint only works if the__name__label is provided either by using it as the<label_name>value or by exactly matching on it using a series selector. For example, the following calls are fully supported:/api/v1/label/__name__/values/api/v1/label/__name__/values?match[]={__name__=~".*metricname.*"}/api/v1/label/labelname/values?match[]={__name__="metricname"}
This limitation causes
label_values($label)variable queries in Grafana to fail. Instead, you can uselabel_values($metric, $label). This type of query is recommended because it avoids fetching values for labels on metrics that are not relevant to the given dashboard.The
/api/v1/seriesendpoint is supported forGETbut notPOSTrequests. When you use the data source syncer or frontend proxy, this restriction is managed for you. You can also configure your Prometheus data sources in Grafana to issue onlyGETrequests. Thematch[]parameter does not support regular expression matching on the__name__label.